. 2022 Feb;59(2):1214-1229.
doi: 10.1007/s12035-021-02682-6. Epub 2021 Dec 28.

Lack of p62 Impairs Glycogen Aggregation and Exacerbates Pathology in a Mouse Model of Myoclonic Epilepsy of Lafora

Affiliations

Lack of p62 Impairs Glycogen Aggregation and Exacerbates Pathology in a Mouse Model of Myoclonic Epilepsy of Lafora

Pasquale Pellegrini et al. Mol Neurobiol. 2022 Feb.

Abstract

Lafora disease (LD) is a fatal childhood-onset dementia characterized by the extensive accumulation of glycogen aggregates-the so-called Lafora Bodies (LBs)-in several organs. The accumulation of LBs in the brain underlies the neurological phenotype of the disease. LBs are composed of abnormal glycogen and various associated proteins, including p62, an autophagy adaptor that participates in the aggregation and clearance of misfolded proteins. To study the role of p62 in the formation of LBs and its participation in the pathology of LD, we generated a mouse model of the disease (malinKO) lacking p62. Deletion of p62 prevented LB accumulation in skeletal muscle and cardiac tissue. In the brain, the absence of p62 altered LB morphology and increased susceptibility to epilepsy. These results demonstrate that p62 participates in the formation of LBs and suggest that the sequestration of abnormal glycogen into LBs is a protective mechanism through which it reduces the deleterious consequences of its accumulation in the brain.

Keywords: Epilepsy; Glycogen; Lafora bodies; Lafora disease; Malin; Neuroinflammation; p62.


Conflict of interest statement

The authors declare that they have no competing interests.

Figures

Fig. 1
Fig. 1
Accumulation of p62 aggregates over time in malinKO mice. a Representative images of the progressive accumulation of p62 in the cortex and hippocampus of malinKO mice. DAPI: 4 ',6-diamidino-2-fenilindol; WGA: wheat germ agglutinin. Scale bar: 50 µm. bc Quantification of the number of p62-positive LBs per area (n of particles/mm2) in the prefrontal cortex or hippocampus (B) and skeletal muscle (C). n = 7–12 mice. For comparisons between groups, one-way ANOVA was performed using Prism7 software (GraphPad). * P < 0.05, ∗  ∗ P < 0.01, ∗  ∗  ∗ P < 0.001, ∗  ∗  ∗  ∗ P < 0.0001. Adjusted p-values (cortex): control 4 m vs. control 11 m P = 0.9997; control 4 m vs. malinKO 4 m P = 0.7191; control 4 m vs. malinKO 11 m P = 0.0010; control 11 m vs. malinKO 4 m P = 0.7829; control 11 m vs. malinKO 11 m P = 0.0013; and malinKO 4 m vs. malinKO 11 m P = 0.0001. Adjusted p-values (hippocampus): control 4 m vs. control 11 m P > 0.9999; control 4 m vs. malinKO 4 m P = 0.9929; control 4 m vs. malinKO 11 m P = 0.0109; control 11 m vs. malinKO 4 m P = 0.9936; control 11 m vs. malinKO 11 m P = 0.0111; and malinKO 4 m vs. malinKO 11 m P = 0.0005. Adjusted p-values (skeletal muscle): control 4 m vs. control 11 m P = 0.9556; control 4 m vs. malinKO 4 m P = 0.5429; control 4 m vs. malinKO 11 m P = 0.0020; control 11 m vs. malinKO 4 m P = 0.7784; control 11 m vs. malinKO 11 m P = 0.0014; and malinKO 4 m vs. malinKO 11 m P = 0.0041
Fig. 2
Fig. 2
p62 deletion prevents glycogen aggregation in skeletal muscle but not in brain. A. Histological localization of LBs. Periodic acid-Schiff staining (PAS) is shown for the indicated tissues of 11-month-old malinKO and malinKO + p62KO mice. Scale bar = 25 μ m (skeletal muscle and heart), 200 μ m (brain). Brain aggregates are visible in the insets. B-C. Representative immunostaining of p62 and MGS in skeletal muscle (quadriceps) and brain (cortex). Scale bar = 25 μ m. D. Glycogen content. For comparisons between groups, one-way ANOVA followed by Holm's Multiple Comparisons Test was performed using Prism7 software (GraphPad). Results are presented as the group mean ± SEM. (n = 6 animals per group). * P < 0.05, ∗  ∗ P < 0.01, ∗  ∗  ∗ P < 0.001, ∗  ∗  ∗  ∗ P < 0.0001. Adjusted p-values. Brain glycogen: control vs. p62KO p = 0.4593; control vs. malinKO p < 0.0001; control vs. malinKO + p62KO p < 0.0001; and malinKO vs. malinKO + p62KO p = 0.3052. Muscle glycogen: control vs. p62KO p = 0.3238; control vs. malinKO p = 0.0358; control vs. malinKO + p62KO * p < 0.05; and malinKO vs. malinKO + p62KO p = 0.8546
Fig. 3
Fig. 3
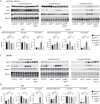
p62 deletion rescues accumulation of insoluble glycogen-bound proteins MGS and laforin in skeletal muscle but not in brain. A-C. Western blotting for MGS, p62 and laforin in muscle (A) and brain (C). Total protein was used as loading control. B-D. Densitometry of the western blots in skeletal muscle (B) and brain (D). For comparisons between groups, one-way ANOVA followed by Holm's Multiple Comparisons Test was performed. N = 6–9 animals/group were analyzed. Results are presented as the group mean ± SEM. * P < 0.05, ∗  ∗ P < 0.01, ∗  ∗  ∗ P < 0.001, ∗  ∗  ∗  ∗ P < 0.0001. Adjusted p-values for MGS (a) or laforin (b): Brain whole lysates: control vs. p62KO p = 0.057 (a), p = 0.3489 (b); control vs. malinKO p < 0.0001 (a) p < 0.0001 (b); control vs. malinKO + p62KO p = 0.0066 (a), p < 0.0001 (b); and malinKO vs. malinKO + p62KO p = 0.057 (a), p = 0.0898 (b). Brain soluble: control vs. p62KO p = 0.0143 (a), p = 0.8557 (b); control vs. malinKO p = 0.0041 (a), p = 0.7614 (b); control vs. malinKO + p62KO p = 0.0041 (a), p = 0.7614 (b); and malinKO vs. malinKO + p62KO p = 0.9128 (a), p = 0.8737 (b). Brain insoluble: control vs. p62KO p = 0.9649 (a), p = 0.9179 (b); control vs. malinKO p = 0.0013 (a), p = 0.0001 (b); control vs. malinKO + p62KO p = 0.0001 (a), p = 0.0075 (b); and malinKO vs. malinKO + p62KO p = 0.5051 (a), p = 0.1591 (b). Muscle whole lysate: control vs. p62KO p = 0.8217 (a), p = 0.7297 (b); control vs. malinKO p = 0.8217 (a), p = 0.0919 (b); control vs. malinKO + p62KO p = 0.8217 (a). p = 0.7297 (b); and malinKO vs. malinKO + p62KO p = 0.9765 (a), p = 0.1987 (b). Muscle soluble: control vs. p62KO p = 0.9597 (a), p = 0.0573 (b); control vs. malinKO p = 0.1964 (a), p = 0.0135 (b); control vs. malinKO + p62KO p = 0.1543 (a), p = 0.9727 (b); and malinKO vs. malinKO + p62KO p = 0.9597 (a), p = 0.0135 (b). Muscle insoluble: control vs. p62KO p = 0.9966 (a), p = 0.6862 (b); control vs. malinKO p = 0.0003 (a), p < 0.0001 (b); control vs. malinKO + p62KO p = 0.7838 (a), p = 0.6862 (b); and malinKO vs. malinKO + p62KO p = 0.0013 (a) p < 0.0001 (b)
Fig. 4
Fig. 4
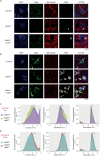
p62 deletion disrupts nLB but not CAL morphology. A-B. Representative examples of reconstructed super-resolution images of neuronal LBs (A) and astrocytic CAL (B) are shown. PFA-fixed tissue sections were incubated with anti-glycogen synthase (MGS), anti-GFAP and βIII-tubulin antibodies, nuclei were stained with Hoechst 33,342. Scale bar: 10 μ m. C-D. Quantifications of circularity (left panels), eccentricity (middle panels) and max caliper (right panels) in neuronal LBs (C) and astrocytic CAL (D). Linear mixed model analysis was performed for statistical analysis. N = 6 animals per genotype. Adjusted p-values Circularity: astrocytic p = 0.075; neuronal p < 0.0001. Eccentricity: astrocytic p = 0.726; neuronal p < 0.0001. Max caliper: astrocytic p = 0.516; neuronal p = 0.017
Fig. 5
Fig. 5
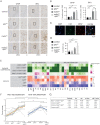
Neuroinflammation in malinKO and malinKO + p62KO mice. A. Representative immunostaining of GFAP and IBA1 in the hippocampus of the indicated experimental groups. B. Densitometry analysis of GFAP and IBA1 areas normalized to the hippocampal area. For comparisons between groups, one-way ANOVA followed by Holm's Multiple Comparisons Test was performed using Prism7 software (GraphPad). Results are presented as the group mean ± SEM. n = 5–6 animals per group. * P < 0.05, ∗  ∗ P < 0.01, ∗  ∗  ∗ P < 0.001. Adjusted p-values. GFAP in hippocampus: control vs. p62KO p = 0.9562; control vs. malinKO p = 0.0055; control vs. malinKO + p62KO p < 0.0028; and malinKO vs. malinKO + p62KO p = 0.7931. GFAP in cortex: control vs. p62KO p = 0.5388; control vs. malinKO p = 0.5388; control vs. malinKO + p62KO p = 0.1823; and malinKO vs. malinKO + p62KO p = 0.5388. IBA1 in hippocampus: control vs. p62KO p = 0.9719; control vs. malinKO p = 0.0175; control vs. malinKO + p62KO p = 0.0175; and malinKO vs. malinKO + p62KO p = 0.9705. IBA1 in cortex: control vs. p62KO p = 0.9620; control vs. malinKO p = 0.8390; control vs. malinKO + p62KO p = 0. 8390; and malinKO vs. malinKO + p62KO p = 0.9620 C. Representative super-resolution images of the immunofluorescence staining against C3d and GFAP in the hippocampus of a MalinKO mouse. One A1 reactive astrocyte is indicated in the arrohead. D. Quantification of the percentage of GFAP-positive cells that are C3-positive in the hippocampus. N = 7–9 mice per group. * P < 0.05, ∗  ∗ P < 0.01, ∗  ∗  ∗ P < 0.001. Adjusted p-values. control vs. p62KO p > 0.9999; control vs. malinKO p = 0.2539; control vs. malinKO + p62KO p = 0.0053; and malinKO vs. malinKO + p62KO p = 0.3513. E. Heat map of pro- and anti-inflammatory transcripts quantified by qPCR normalized to the housekeeper gene GAPDH. N = 6 animals per group. Linear mixed-effects models were fitted using ΔCt as response variable, the genotype as covariate of interest, the mouse experimental group replicate as adjusting factor and the mouse Id as random effect to account for variability in technical replicates. Comparisons were done independently for each gene measured. * P < 0.05, ∗  ∗ P < 0.01, ∗  ∗  ∗ P < 0.001. Raw and adjusted p-values are summarized in Supplementary file 3. F. dot plots of the average Z-score of the genes shown in panel A in the indicated experimental groups. Gray lines are indicative of one gene. Colored lines are the average of gray lines. The table shows the linear mixed effect model that quantified consistency in ΔCts between genes of the same inflammatory group, across the 4 genotypes. * P < 0.05, ∗  ∗ P < 0.01, ∗  ∗  ∗ P < 0.001.
Fig. 6
Fig. 6
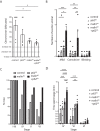
p62 deletion increases seizure susceptibility in malinKO mice. A. Onset of epileptic activity in minutes. Data are expressed as average ± SEM. N = 6 mice/group (*p < 0.05) indicate significant difference (One-way ANOVA followed by Bonferroni test; p = 0.0.0173). B. Number of seizures (mild, convulsive, or blinking) experienced per animal. Data are expressed as average ± SEM. N = 6 mice/group. Two-way ANOVA (Seizure type factor: p = 0.0003; Genotype factor: p = 0.0012; interaction: p = 0.0022). (*p < 0.05, **p < 0.01, ***p < 0.005) indicate significant difference (Kruskal–Wallis for each seizure type followed by Dunn’s test); (#p < 0.05) indicate pairwise differences between control and malinKO by Mann–Whitney U-test. C. Percentage of mice reaching seizure stages I to VI. D. Time spent in each stage (expressed in minutes) during the course of the experiment. Data are expressed as average ± SEM. N = 6 mice/group. Two-way ANOVA (Stage factor (P < 0.0001), the Genotype factor (P < 0.0001), Interaction (P < 0.0001)). (**p < 0.01, ***p < 0.005, ****p < 0.001) indicate significant pairwise differences (post-hoc Bonferroni)
Fig. 7
Fig. 7
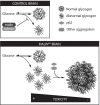
Graphical summary of the study. Abnormal glycogen is produced as a side-product of glycogen metabolism. The malin/laforin complex prevents the formation of this abnormal polysaccharide. In the absence of laforin or malin, abnormal glycogen accumulates. In this context, p62 promotes its aggregation into LBs, to minimize the toxic consequences of its accumulation. p62 deletion correlates with an exacerbation of the inflammation and epilepsy supporting the notion that LBs are neuroprotective

Similar articles

  • Lithium exacerbates Lafora body formation in the Epm2a-/- Lafora disease mouse model.
    Wu J, Lynn TC, Nitschke S, Mitra S, Minassian BA. Wu J, et al. Neurosci Lett. 2025 May 29;856-858:138250. doi: 10.1016/j.neulet.2025.138250. Epub 2025 Apr 19. Neurosci Lett. 2025. PMID: 40258565
  • An inducible glycogen synthase-1 knockout halts but does not reverse Lafora disease progression in mice.
    Nitschke S, Chown EE, Zhao X, Gabrielian S, Petković S, Guisso DR, Perri AM, Wang P, Ahonen S, Nitschke F, Minassian BA. Nitschke S, et al. J Biol Chem. 2021 Jan-Jun;296:100150. doi: 10.1074/jbc.RA120.015773. Epub 2020 Dec 10. J Biol Chem. 2021. PMID: 33277363 Free PMC article.
  • Glycogen accumulation underlies neurodegeneration and autophagy impairment in Lafora disease.
    Duran J, Gruart A, García-Rocha M, Delgado-García JM, Guinovart JJ. Duran J, et al. Hum Mol Genet. 2014 Jun 15;23(12):3147-56. doi: 10.1093/hmg/ddu024. Epub 2014 Jan 22. Hum Mol Genet. 2014. PMID: 24452334
  • Therapeutic Window for the Treatment of Lafora Disease.
    Varea O, Guinovart JJ, Duran J. Varea O, et al. In: Noebels JL, Avoli M, Rogawski MA, Vezzani A, Delgado-Escueta AV, editors. Jasper's Basic Mechanisms of the Epilepsies. 5th edition. New York: Oxford University Press; 2024. Chapter 53. In: Noebels JL, Avoli M, Rogawski MA, Vezzani A, Delgado-Escueta AV, editors. Jasper's Basic Mechanisms of the Epilepsies. 5th edition. New York: Oxford University Press; 2024. Chapter 53. PMID: 39637182 Free Books & Documents. Review.
  • Treating Lafora Disease with an Antibody-Enzyme Fusion.
    Gentry MS, Markussen KH, Sun RC, Vander Kooi CW. Gentry MS, et al. In: Noebels JL, Avoli M, Rogawski MA, Vezzani A, Delgado-Escueta AV, editors. Jasper's Basic Mechanisms of the Epilepsies. 5th edition. New York: Oxford University Press; 2024. Chapter 55. In: Noebels JL, Avoli M, Rogawski MA, Vezzani A, Delgado-Escueta AV, editors. Jasper's Basic Mechanisms of the Epilepsies. 5th edition. New York: Oxford University Press; 2024. Chapter 55. PMID: 39637175 Free Books & Documents. Review.

Cited by

References

    1. Kanungo S, Wells K, Tribett T, El-Gharbawy A. Glycogen metabolism and glycogen storage disorders. Annals of translational medicine. 2018;6(24):474. - PMC - PubMed
    1. Cataldo AM, Broadwell RD. Cytochemical identification of cerebral glycogen and glucose-6-phosphatase activity under normal and experimental conditions. II. Choroid plexus and ependymal epithelia, endothelia and pericytes. J Neurocytol. 1986;15(4):511–24. - PubMed
    1. Duran J, Guinovart JJ. Brain glycogen in health and disease. Mol Aspects Med. 2015;46:70–77. - PubMed
    1. Duran J, Gruart A, López-Ramos JC, Delgado-García JM, Guinovart JJ. Glycogen in Astrocytes and Neurons: Physiological and Pathological Aspects. Adv Neurobiol. 2019;23:311–329. - PMC - PubMed
    1. Saez I, Duran J, Sinadinos C, Beltran A, Yanes O, Tevy MF, et al. Neurons have an active glycogen metabolism that contributes to tolerance to hypoxia. Journal of cerebral blood flow and metabolism : official journal of the International Society of Cerebral Blood Flow and Metabolism. 2014;34(6):945–955. - PMC - PubMed