

Autophagy Inhibition Reduces Irradiation-Induced Subcortical White Matter Injury Not by Reducing Inflammation, but by Increasing Mitochondrial Fusion and Inhibiting Mitochondrial Fission
- PMID: 34962635
- PMCID: PMC8857090
- DOI: 10.1007/s12035-021-02653-x
Autophagy Inhibition Reduces Irradiation-Induced Subcortical White Matter Injury Not by Reducing Inflammation, but by Increasing Mitochondrial Fusion and Inhibiting Mitochondrial Fission
Abstract
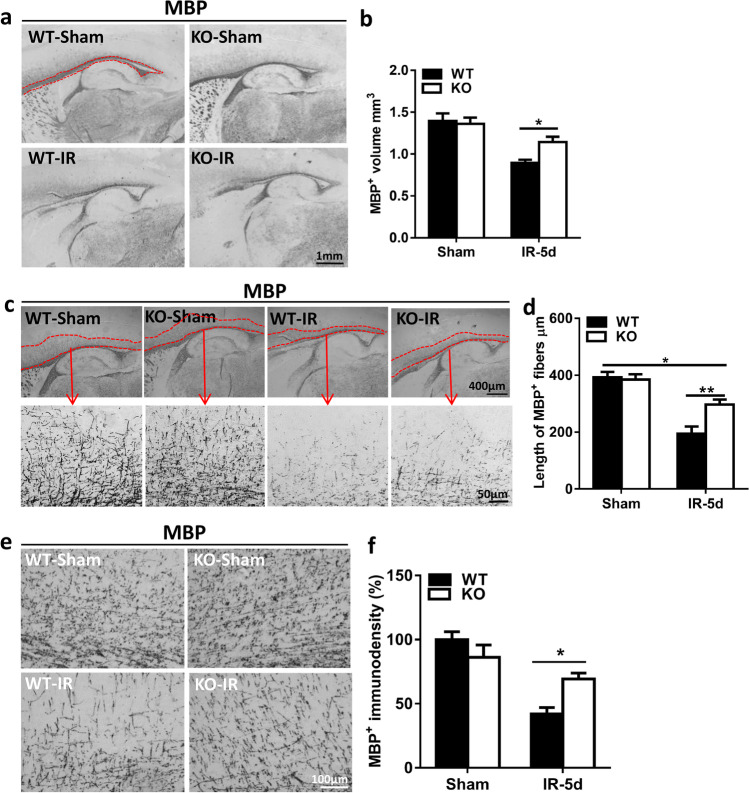
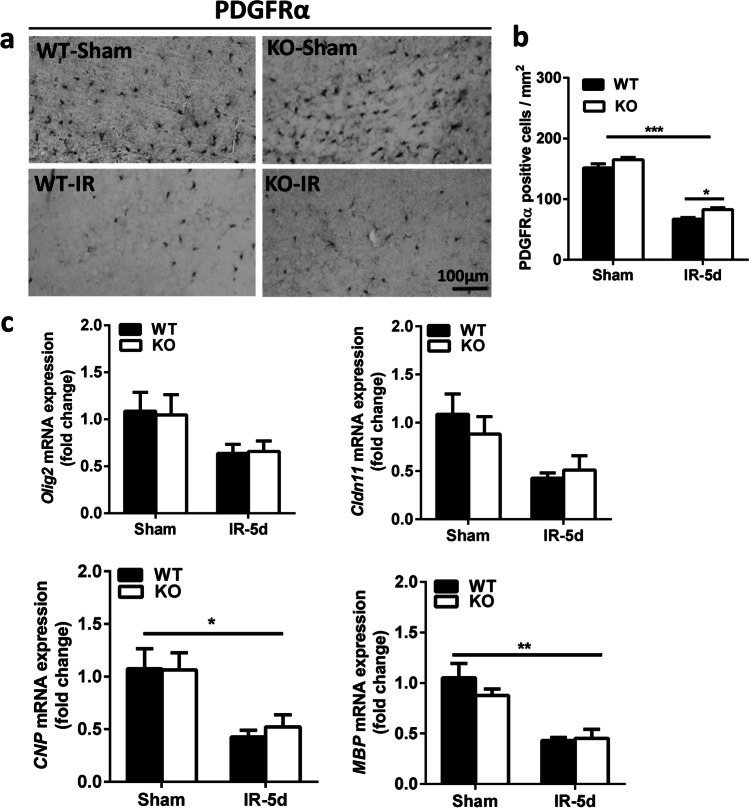
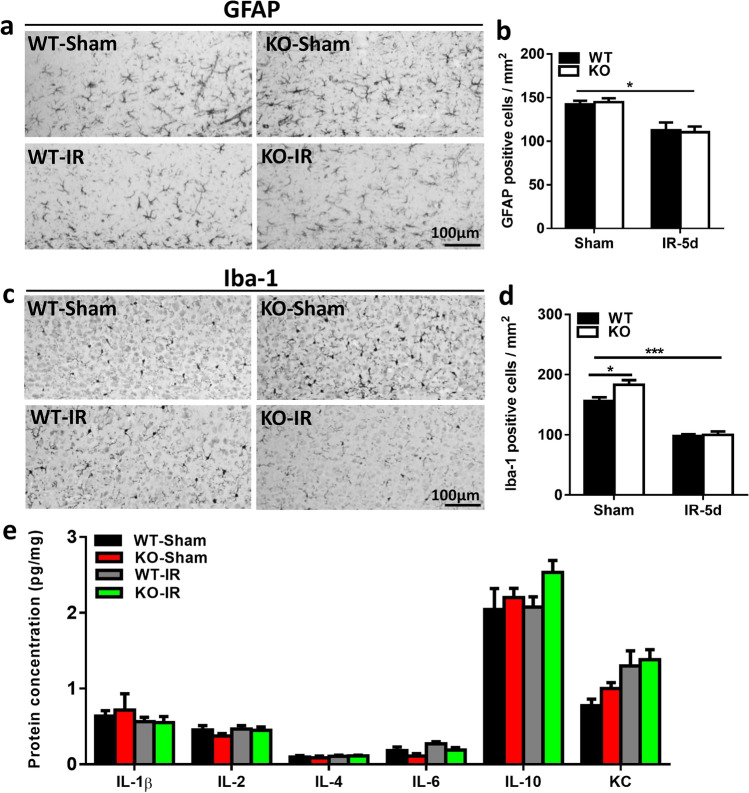
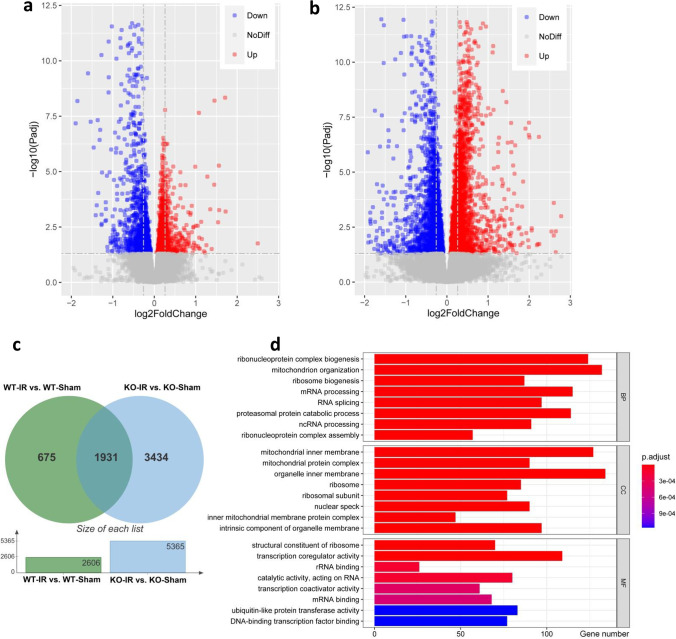
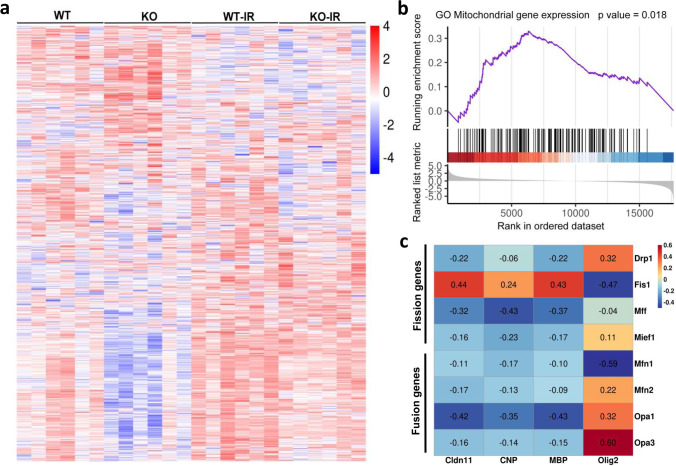
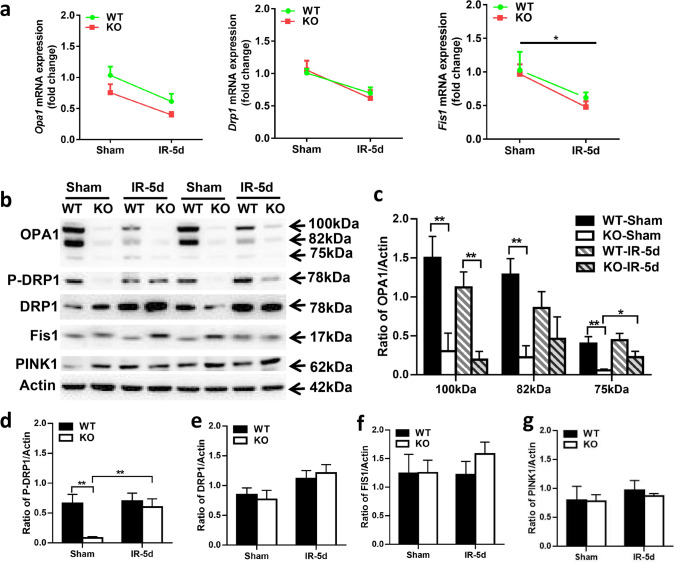
Radiotherapy is an effective tool in the treatment of malignant brain tumors, but irradiation-induced late-onset toxicity remains a major problem. The purpose of this study was to investigate if genetic inhibition of autophagy has an impact on subcortical white matter development in the juvenile mouse brain after irradiation. Ten-day-old selective neural Atg7 knockout (KO) mice and wild-type (WT) littermates were subjected to a single 6-Gy dose of whole-brain irradiation and evaluated at 5 days after irradiation. Neural Atg7 deficiency partially prevented myelin disruption compared to the WT mice after irradiation, as indicated by myelin basic protein staining. Irradiation induced oligodendrocyte progenitor cell loss in the subcortical white matter, and Atg7 deficiency partly prevented this. There was no significant change between the KO and WT mice in the number of microglia and astrocytes in the subcortical white matter after irradiation. Transcriptome analysis showed that the GO mitochondrial gene expression pathway was significantly enriched in the differentially expressed genes between the KO and WT group after irradiation. Compared with WT mice, expression of the mitochondrial fusion protein OPA1 and phosphorylation of the mitochondrial fission protein DRP1 (P-DRP1) were dramatically decreased in KO mice under physiological conditions. The protein levels of OPA1and P-DRP1 showed no differences in WT mice between the non-irradiated group and the irradiated group but had remarkably increased levels in the KO mice after irradiation. These results indicate that inhibition of autophagy reduces irradiation-induced subcortical white matter injury not by reducing inflammation, but by increasing mitochondrial fusion and inhibiting mitochondrial fission.
Keywords: Astrocyte; Autophagy; Fusion and fission; Microglia; Mitochondria; White matter injury.
© 2021. The Author(s).
Conflict of interest statement
The authors declare no competing interests.
Figures
Similar articles
-
Selective Neural Deletion of the Atg7 Gene Reduces Irradiation-Induced Cerebellar White Matter Injury in the Juvenile Mouse Brain by Ameliorating Oligodendrocyte Progenitor Cell Loss.Front Cell Neurosci. 2019 May 31;13:241. doi: 10.3389/fncel.2019.00241. eCollection 2019. Front Cell Neurosci. 2019. PMID: 31213984 Free PMC article.
-
Inhibition of autophagy prevents irradiation-induced neural stem and progenitor cell death in the juvenile mouse brain.Cell Death Dis. 2017 Mar 23;8(3):e2694. doi: 10.1038/cddis.2017.120. Cell Death Dis. 2017. PMID: 28333139 Free PMC article.
-
Inflammation-induced alteration of astrocyte mitochondrial dynamics requires autophagy for mitochondrial network maintenance.Cell Metab. 2013 Dec 3;18(6):844-59. doi: 10.1016/j.cmet.2013.11.005. Cell Metab. 2013. PMID: 24315370
-
A partial Drp1 knockout improves autophagy flux independent of mitochondrial function.Mol Neurodegener. 2024 Mar 19;19(1):26. doi: 10.1186/s13024-024-00708-w. Mol Neurodegener. 2024. PMID: 38504290 Free PMC article.
-
Physiological roles of mitochondrial fission in cultured cells and mouse development.Ann N Y Acad Sci. 2015 Sep;1350:77-81. doi: 10.1111/nyas.12848. Ann N Y Acad Sci. 2015. PMID: 26375863 Review.
Cited by
-
GPX4 Inhibition Contributes to NLRP3-Mediated Pyroptosis and Cognitive Impairment in Ketamine-Exposed Neonatal Rats.Mol Neurobiol. 2025 Sep;62(9):12360-12370. doi: 10.1007/s12035-025-05042-w. Epub 2025 May 23. Mol Neurobiol. 2025. PMID: 40404947
-
N-Acetylcysteine Mitigates Ketamine Neurotoxicity in Young Rats by Modulating ROS-Mediated Pyroptosis and Ferroptosis.Mol Neurobiol. 2025 Jul;62(7):9416-9429. doi: 10.1007/s12035-025-04860-2. Epub 2025 Mar 20. Mol Neurobiol. 2025. PMID: 40111652
-
Hydrogen Sulfide Attenuates High-Fat Diet-Induced Obesity: Involvement of mTOR/IKK/NF-κB Signaling Pathway.Mol Neurobiol. 2022 Nov;59(11):6903-6917. doi: 10.1007/s12035-022-03004-0. Epub 2022 Sep 2. Mol Neurobiol. 2022. PMID: 36053437
-
Circvrk1 downregulation attenuates brain microvascular endothelial cell damage induced by oxygen-glucose deprivation through modulating the miR-150-5p/MLLT1 axis.Exp Brain Res. 2023 Mar;241(3):781-791. doi: 10.1007/s00221-023-06555-3. Epub 2023 Feb 3. Exp Brain Res. 2023. PMID: 36735043
-
Dual Roles of Autophagy in Radiation-Induced Brain Injury: Mechanistic Insights and Therapeutic Implications.CNS Neurosci Ther. 2025 Jun;31(6):e70464. doi: 10.1111/cns.70464. CNS Neurosci Ther. 2025. PMID: 40491058 Free PMC article. Review.
References
-
- Zajac-Spychala O, Pawlak MA, Karmelita-Katulska K, Pilarczyk J, Derwich K, Wachowiak J. Long-term brain structural magnetic resonance imaging and cognitive functioning in children treated for acute lymphoblastic leukemia with high-dose methotrexate chemotherapy alone or combined with CNS radiotherapy at reduced total dose to 12 Gy. Neuroradiology. 2017;59(2):147–156. doi: 10.1007/s00234-016-1777-8. - DOI - PMC - PubMed
MeSH terms
Substances
LinkOut - more resources
Full Text Sources
Research Materials
Miscellaneous
