. 2022 Mar;100(3):205-217.
doi: 10.1111/imcb.12520. Epub 2022 Jan 23.

The ICOS-ICOSL pathway tunes thymic selection

Affiliations

The ICOS-ICOSL pathway tunes thymic selection

Mengqi Dong et al. Immunol Cell Biol. 2022 Mar.

Abstract

Negative selection of developing T cells plays a significant role in T-cell tolerance to self-antigen. This process relies on thymic antigen-presenting cells which express both self-antigens and cosignaling molecules. Inducible T-cell costimulator (ICOS) belongs to the CD28 family of cosignaling molecules and binds to ICOS ligand (ICOSL). The ICOS signaling pathway plays important roles in shaping the immune response to infections, but its role in central tolerance is less well understood. Here we show that ICOSL is expressed by subsets of thymic dendritic cells and medullary thymic epithelial cells as well as thymic B cells. ICOS expression is upregulated as T cells mature in the thymus and correlates with T-cell receptor signal strength during thymic selection. We also provide evidence of a role for ICOS signaling in mediating negative selection. Our findings suggest that ICOS may fine-tune T-cell receptor signals during thymic selection contributing to the generation of a tolerant T-cell population.

Keywords: ICOS; ICOSL; negative selection; thymic antigen-presenting cells; thymocytes.


Conflict of interest statement

All authors declare not conflicts of interest.

Figures
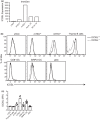
Figure 1
Figure 1
Inducible T‐cell costimulator ligand (ICOSL) is expressed on subsets of medullary thymic epithelial cells (mTEC) and thymic dendritic cells (DCs) as well as thymic B cells. (a) Relative levels of ICOSL expression extracted from the ImmGen database on the Ep.8wk.CEChi. Th.v2 [cortical thymic epithelial cells (cTECs)], Ep.8wk.MEClo. Th.v2 [mTEC low (mTEClo)] and Ep.8wk.MEChi. Th.v2 [mTEC high (mTEChi)] as well as DC.8. Th and DC.8+. Th (thymic CD8 and CD8+ DC) subsets. (b) Representative histograms and (c) relative expression of ICOSL from cTEC, mTEClo, mTEChi, thymic B cells, CD8+ DC, SIRPα+ DC and plasmacytoid DC (pDC) analyzed by flow cytometry. The gating strategies are depicted in Supplementary figure 1. The relative fluorescence intensity for ICOSL expression is normalized to the median fluorescence intensity of each subset from ICOSL−/− mice. Dots indicate individual mice; n = 4 or 6 mice from a minimum of two independent experiments.
Figure 2
Figure 2
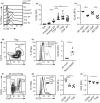
Differential expression of inducible T‐cell costimulator (ICOS) on thymocyte subsets. (a) Representative histograms and (b) relative expression of ICOS on thymic developmental subsets in wild‐type (WT) adult mice analyzed by flow cytometry: CD4CD8TCRβ double‐negative (DN), CD4+CD8+CD69 preselection double‐positive (Presel DP), CD4+CD8+CD69+ postselection DP (Postsel DP), TCRβhiCD25Foxp3CD4+ single‐positive (SP), TCRβhiCD4+CD25+Foxp3+ regulatory T (Treg), TCRβhi CD8+ SP. Dots in b indicate individual mice (n = 22) from a minimum of three independent experiments. Relative fluorescence intensity (RFI) is calculated after normalization to ICOS median fluorescence intensity (MFI) of the DN subset in each experiment. (c) Relative expression of ICOS on distinct maturation stages of CD4+ SP and CD8+ SP thymocytes (CD69+MHC‐I+ M1 and the more mature CD69MHC‐I+ M2). Dots in c indicate individual mice (n = 6) from two independent experiments. The RFI for ICOS is normalized to the MFI of the M1 CD4+ SP subset in each experiment. (d) Representative flow plots of recirculated (CD73+CD44+) and de novo (CD73lo) thymic Tregs. (e) Representative histograms and quantification of ICOS expression on recirculated and de novo thymic Tregs. The RFI is normalized to the MFI of de novo thymic Tregs in each experiment. (f) Representative flow plots for two thymic Treg precursors (CD25+ and Foxp3lo) gated on de novo, nonrecirculated thymocytes. (g) Representative histograms and quantification of ICOS expression on thymic Treg precursors and Foxp3+CD25+ Tregs. (h) Quantification of CD5 expression on thymic Treg precursors and mature Foxp3+CD25+ Tregs. (g) and (h) The RFI for ICOS or CD5 is normalized to the MFI of the CD4+ SP subset in each experiment. Dots in e, g and h indicate individual mice (n = 8) from three independent experiments. *P < 0.05, ***P < 0.001, Welch’s t‐test (e) or Brown–Forsythe and Welch ANOVA followed by Dunnett’s T3 multiple comparisons test (b, c, g, h). FMO, fluorescence minus one control; MHC, major histocompatibility complex; TCR, T‐cell receptor.
Figure 3
Figure 3
Inducible T‐cell costimulator (ICOS) expression correlates with the strength of T‐cell receptor (TCR) signaling. (a) Representative histograms and (b) relative ICOS expression on CD4+ or CD8+ single‐positive (SP) thymocytes gated on the top (CD5hi), intermediate (CD5int) and bottom (CD5lo) 15% of CD5 expression. The relative fluorescence intensity (RFI) of ICOS is nbormalized to the median fluorescence intensity (MFI) of ICOS on CD5lo CD4+ SP thymocytes in each experiment. (c) Representative histograms and (d) relative expression of CD5 (left) and ICOS (right) on CD4+ SP thymocytes from nontransgenic wild‐type (WT) mice as compared with those from MHC‐II‐restricted TCR transgenic SMARTA mice. (e) Representative histograms and (f) relative expression of CD5 (left) and ICOS (right) on CD8+ SP thymocytes from WT mice as compared with those from MHC‐I‐restricted TCR transgenic OT‐I mice. (g) Quantification of CD5 expression on CD4+ SP and CD8+ SP thymocytes from WT, ICOS ligand (ICOSL)‐ and ICOS‐deficient mice. The RFI for CD5 is normalized to the MFI of CD4+ SP in each experiment. Dots indicate individual mice (n = 6) from a minimum of two independent experiments. **P < 0.01, ***P < 0.001, two‐tailed unpaired Student’s t‐test.
Figure 4
Figure 4
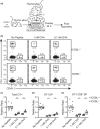
Negative selection of OT‐I T‐cell receptor (TCR) transgenic thymocytes is less efficient in the absence of inducible T‐cell costimulator ligand (ICOSL). (a) Schematic representation of experimental setup. CellTrace Violet (CTV)‐labeled total OT‐I thymocytes were mixed at a 1:1 ratio with congenic CD45.1+ wild‐type (WT) thymocytes and were overlaid atop thymic slices generated from either ICOSL+/+ or ICOSL−/− mice in the presence or absence of OVA peptide (SIINFEKL) at the indicated concentrations. The slices were analyzed by flow cytometry 24 h later. (b) Representative flow plots and (c) compilation of the relative proportion of total live OT‐I thymocytes normalized to the proportion of congenic CD45.1+ thymocytes from each slice; a decrease in the proportion of OT‐I thymocytes indicates negative selection. The relative ratio of (d) CD4+CD8+ double‐positive (DP) OT‐I thymocytes or (e) CD8+ single‐positive (SP) OT‐I thymocytes. n = 9 thymic slices for each condition from three independent experiments, *P < 0.05, **P < 0.01, ***P < 0.001, two‐tailed unpaired Student’s t‐test within each peptide concentration condition.

References

    1. Xing Y, Hogquist KA. T‐cell tolerance: central and peripheral. Cold Spring Harb Perspect Biol 2012; 4: a006957. - PMC - PubMed
    1. Klein L, Kyewski B, Allen PM, Hogquist KA. Positive and negative selection of the T cell repertoire: what thymocytes see (and don't see). Nat Rev Immunol 2014; 14: 377–391. - PMC - PubMed
    1. Hogquist KA, Jameson SC. The self‐obsession of T cells: how TCR signaling thresholds affect fate 'decisions' and effector function. Nat Immunol 2014; 15: 815–823. - PMC - PubMed
    1. Klein L, Robey EA, Hsieh CS. Central CD4+ T cell tolerance: deletion versus regulatory T cell differentiation. Nat Rev Immunol 2019; 19: 7–18. - PubMed
    1. Stritesky GL, Xing Y, Erickson JR, et al. Murine thymic selection quantified using a unique method to capture deleted T cells. Proc Natl Acad Sci USA 2013; 110: 4679–4684. - PMC - PubMed

Publication types

MeSH terms

Substances