. 2021 Dec 28;17(12):e1009689.
doi: 10.1371/journal.pcbi.1009689. eCollection 2021 Dec.

Combination treatment optimization using a pan-cancer pathway model

Affiliations

Combination treatment optimization using a pan-cancer pathway model

Robin Schmucker et al. PLoS Comput Biol. .

Abstract

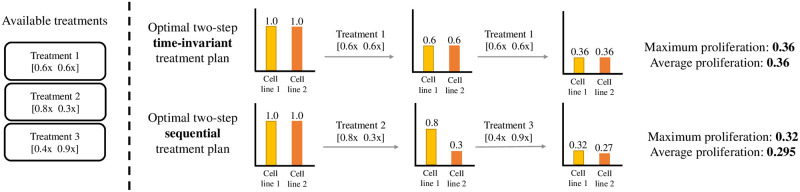
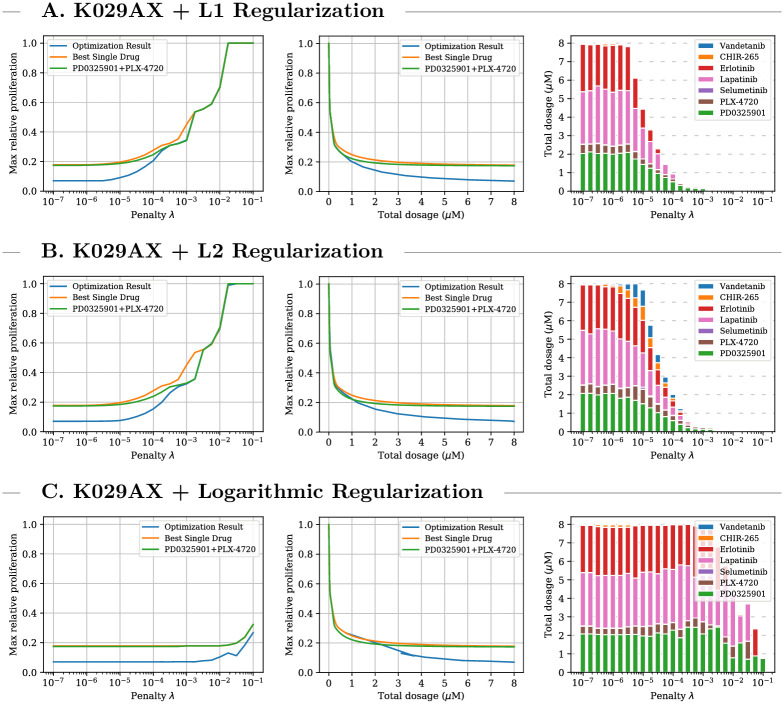
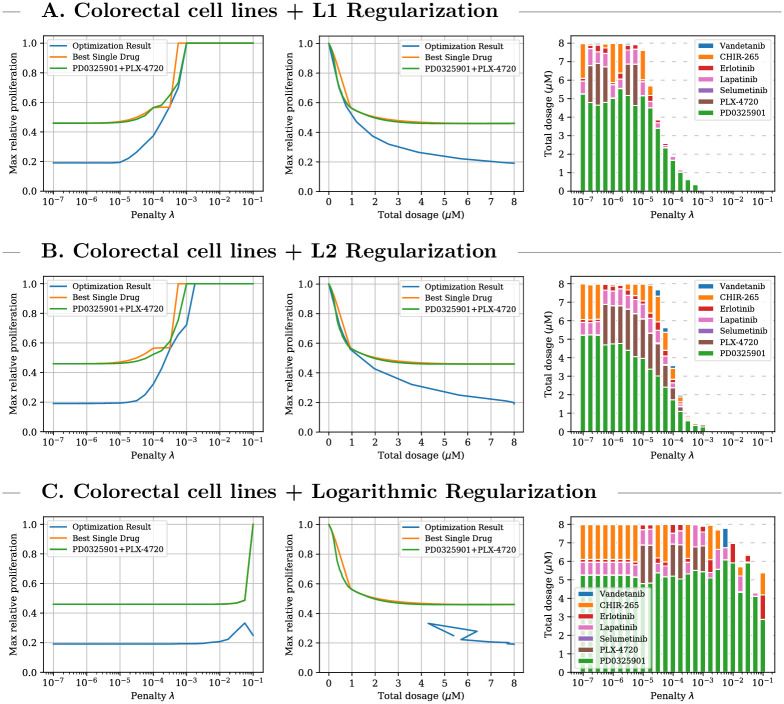
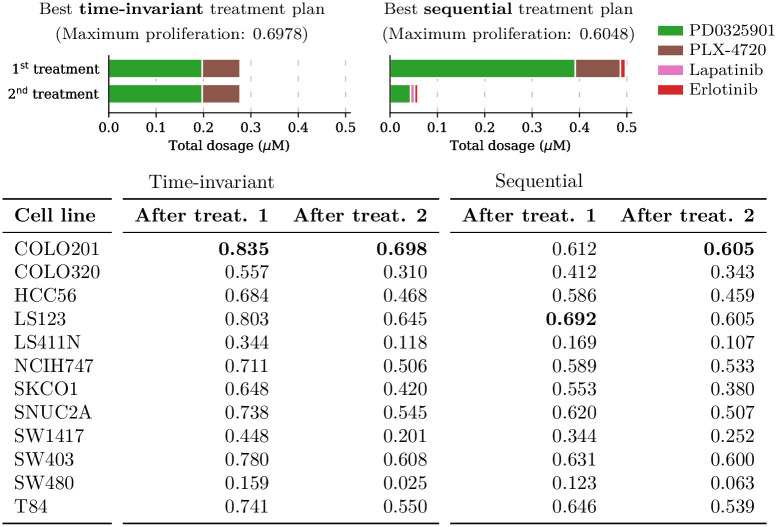
The design of efficient combination therapies is a difficult key challenge in the treatment of complex diseases such as cancers. The large heterogeneity of cancers and the large number of available drugs renders exhaustive in vivo or even in vitro investigation of possible treatments impractical. In recent years, sophisticated mechanistic, ordinary differential equation-based pathways models that can predict treatment responses at a molecular level have been developed. However, surprisingly little effort has been put into leveraging these models to find novel therapies. In this paper we use for the first time, to our knowledge, a large-scale state-of-the-art pan-cancer signaling pathway model to identify candidates for novel combination therapies to treat individual cancer cell lines from various tissues (e.g., minimizing proliferation while keeping dosage low to avoid adverse side effects) and populations of heterogeneous cancer cell lines (e.g., minimizing the maximum or average proliferation across the cell lines while keeping dosage low). We also show how our method can be used to optimize the drug combinations used in sequential treatment plans-that is, optimized sequences of potentially different drug combinations-providing additional benefits. In order to solve the treatment optimization problems, we combine the Covariance Matrix Adaptation Evolution Strategy (CMA-ES) algorithm with a significantly more scalable sampling scheme for truncated Gaussian distributions, based on a Hamiltonian Monte-Carlo method. These optimization techniques are independent of the signaling pathway model, and can thus be adapted to find treatment candidates for other complex diseases than cancers as well, as long as a suitable predictive model is available.


Conflict of interest statement

I have read the journal’s policy and the authors of this manuscript have the following competing interests: TS is Founder, President, and CEO of Sandholm Enterprises, Ltd., Strategic Machine, Inc., Strategy Robot, Inc., and Optimized Markets, Inc.; these affiliations did not affect the conclusions of this paper.

Figures

Fig 1
Fig 1. Comparison of a sequential treatment plan with a time-invariant treatment plan.
The use of different specialized drug-combinations (targeting fewer cell lines at once) at different points in time can enable more effective therapies. In the illustrative example above with two cell lines and three available treatments, the optimal two-step time-invariant treatment leads to a relative proliferation score of 0.36 for both cell lines. Meanwhile, the optimal two-step sequential treatment plan achieves relative proliferation scores of 0.32 and 0.27 for cell lines 1 and 2, respectively.
Fig 2
Fig 2. Single-step treatment for K029AX.
Comparison between optimized single-cell multi-drug treatment, optimal single-drug treatment, and optimal PD0325901/PLX-4720 combination treatment for K029AX—a melanoma cell line with BRAF V600E mutation—for three different types of regularization. Left plots: optimal treatment as identified by the objective function for different penalty parameters. The middle plots: relationship between administered total dosage and achieved proliferation value regardless of penalty and objective value. Right plots: composition of the multi-drug treatments. For all three types of regularization the optimization process leads to combination treatments which achieve significantly lower predicted proliferation values at lower concentrations than single and two-drug treatment. The treatment composition varies with the type of regularization.
Fig 3
Fig 3. Single-step treatment for colorectal cell lines.
Comparison between optimized multi-cell multi-drug treatment, optimal single-drug treatment, and optimal PD0325901/PLX-4720 combination treatment for colorectal cell lines for three different types of regularization. Left plot: optimal treatment as identified by the objective function for different penalty parameters. Middle plot: relationship between administered total dosage and achieved proliferation value regardless of objective values. Right plot: composition of the multi-drug treatments. For all three types of regularization the optimization process leads to combination treatments which achieve significantly lower predicted proliferation values at lower concentrations than single and two-drug treatment. When using the logarithmic regularization low objective values did not always indicate favorable proliferation values.
Fig 4
Fig 4. Two-step treatment plan composition for colorectal cell lines.
A visualization of the drug cocktails administered by the optimized two-step treatment plan and the optimized two-step time-invariant treatment plan for colorectal cell lines under L1 regularization at the same total drug dosage (550 nM). The 2-step plan uses a high-dose treatment followed by a low-dose treatment. This achieves maximum proliferation 0.6048, which is more effective than the time-invariant treatment plan which only achieves 0.6978.
Fig 5
Fig 5. Output variance for K029AX.
Visualization of the first two principal components of 20 single-cell combination treatments for K029AX under three different types of regularization using warm starts. The treatment variance varies with changing penalty parameter.
Fig 6
Fig 6. Output variance for colorectal cells.
Visualization of the first two principal components of 20 multi-cell combination treatments for colorectal cells under three different types of regularization using warm starts. The treatment variance varies with changing penalty parameter.

References

    1. Fitzgerald JB, Schoeberl B, Nielsen UB, Sorger PK. Systems biology and combination therapy in the quest for clinical efficacy. Nature chemical biology. 2006;2(9):458–466. doi: 10.1038/nchembio817 - DOI - PubMed
    1. Lehár J, Krueger AS, Avery W, Heilbut AM, Johansen LM, Price ER, et al.. Synergistic drug combinations tend to improve therapeutically relevant selectivity. Nature biotechnology. 2009;27(7):659–666. doi: 10.1038/nbt.1549 - DOI - PMC - PubMed
    1. Meng J, Dai B, Fang B, Bekele BN, Bornmann WG, Sun D, et al.. Combination treatment with MEK and AKT inhibitors is more effective than each drug alone in human non-small cell lung cancer in vitro and in vivo. PloS one. 2010;5(11). doi: 10.1371/journal.pone.0014124 - DOI - PMC - PubMed
    1. Al-Lazikani B, Banerji U, Workman P. Combinatorial drug therapy for cancer in the post-genomic era. Nature biotechnology. 2012;30(7):679. doi: 10.1038/nbt.2284 - DOI - PubMed
    1. Larkin J, Ascierto PA, Dréno B, Atkinson V, Liszkay G, Maio M, et al.. Combined vemurafenib and cobimetinib in BRAF-mutated melanoma. New England Journal of Medicine. 2014;371(20):1867–1876. doi: 10.1056/NEJMoa1408868 - DOI - PubMed

Publication types

MeSH terms

Substances