. 2022 Jan 6;185(1):169-183.e19.
doi: 10.1016/j.cell.2021.12.005. Epub 2021 Dec 27.

EMSY inhibits homologous recombination repair and the interferon response, promoting lung cancer immune evasion

Affiliations

EMSY inhibits homologous recombination repair and the interferon response, promoting lung cancer immune evasion

Antonio Marzio et al. Cell. .

Abstract

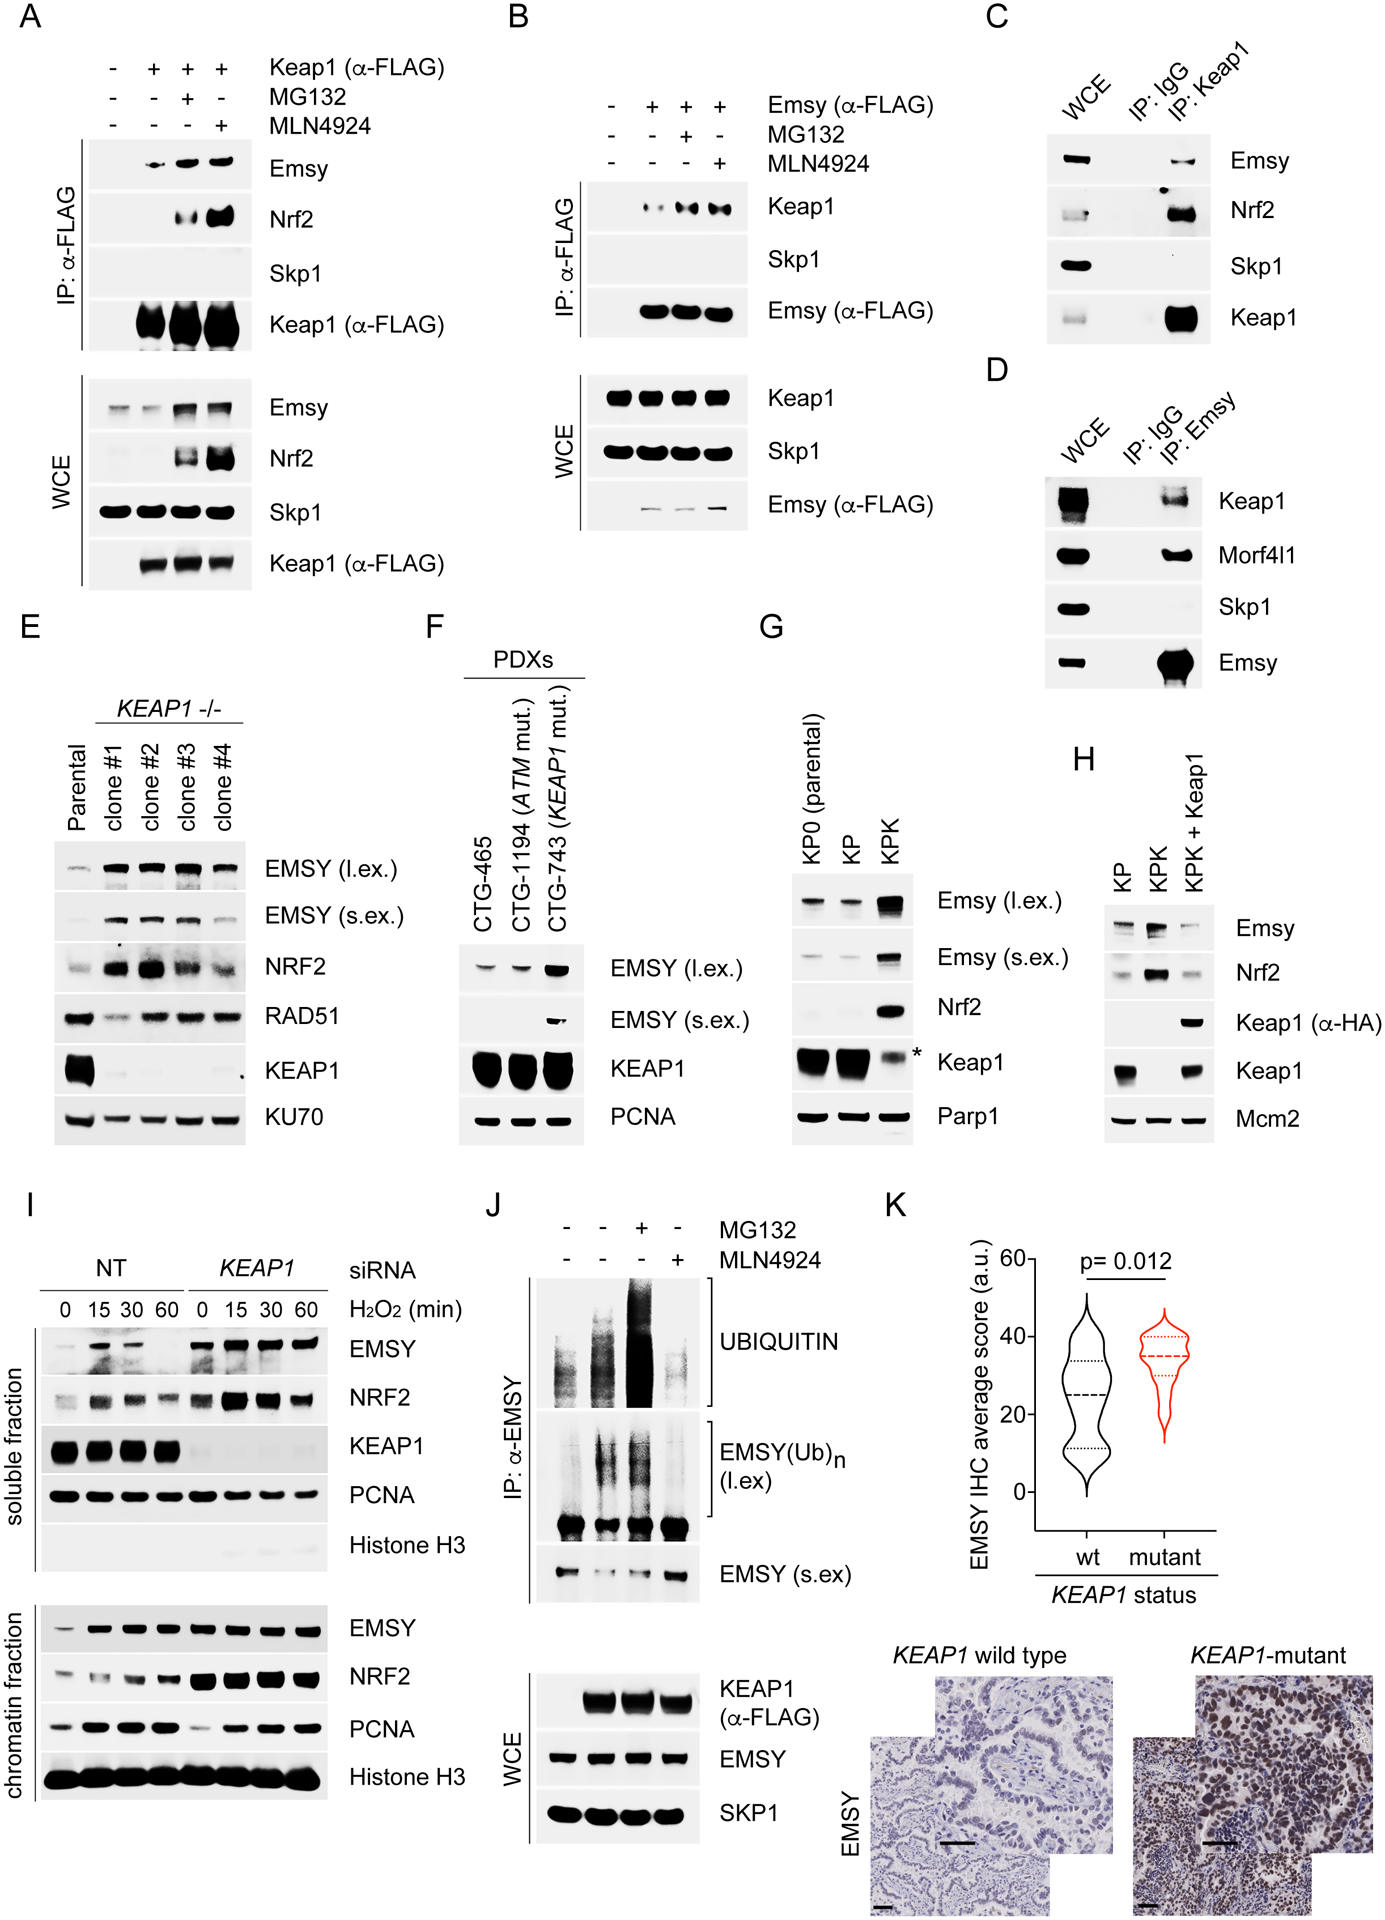
Non-small cell lung cancers (NSCLCs) harboring KEAP1 mutations are often resistant to immunotherapy. Here, we show that KEAP1 targets EMSY for ubiquitin-mediated degradation to regulate homologous recombination repair (HRR) and anti-tumor immunity. Loss of KEAP1 in NSCLC induces stabilization of EMSY, producing a BRCAness phenotype, i.e., HRR defects and sensitivity to PARP inhibitors. Defective HRR contributes to a high tumor mutational burden that, in turn, is expected to prompt an innate immune response. Notably, EMSY accumulation suppresses the type I interferon response and impairs innate immune signaling, fostering cancer immune evasion. Activation of the type I interferon response in the tumor microenvironment using a STING agonist results in the engagement of innate and adaptive immune signaling and impairs the growth of KEAP1-mutant tumors. Our results suggest that targeting PARP and STING pathways, individually or in combination, represents a therapeutic strategy in NSCLC patients harboring alterations in KEAP1.

Keywords: BRCAness; EMSY; KEAP1; NSCLC; PARP inhibitors; STING agonsts; immune evasion; interferon; lung cancer; ubiquitination.


Conflict of interest statement

Declaration of interests T.P. has received Honoraria/Consulting fees from Calithera Biosciences and Vividion Therapeutics and research support from Bristol Myers Squibb, Dracen Pharmaceuticals, and Agios Pharmaceuticals. M.P. is a cofounder of Coho Therapeutics. He is also a consultant for, a member of the scientific advisory board of, and has financial interests in Coho Therapeutics, CullGen, Kymera Therapeutics, Santi Therapeutics, and SEED Therapeutics. The other authors declare no competing interests.

Figures

Figure 1.
Figure 1.. Increased TMB in KEAP1-mutant NSCLCs
(A) TMB in LUAD and LUSC according to their KEAP1 status. (B) TMB in NSCLCs according to their KEAP1 or NFE2L2 status. (C) TMB in KEAP1 wild type and mutant tumors according to their TP53 status. (D) TMB in Keap1 wild type (KP) and knockout (KPK) clones using whole exome sequencing (WES). The TMB of each cell line was normalized to the TMB of KP parental cell line (KP0). (E)Comparison of TMB between KP and KPK cells using RNA-seq data previously reported (Lignitto et al., 2019). (F) GSEA of DSB repair and HRR of KPK (n=6) and KP (n=6) cells using RNA-seq data previously reported (Lignitto et al., 2019). (G) HRD score in KEAP1 wild type and mutant tumors from TCGA (Thorsson et al., 2019).
Figure 2.
Figure 2.. KEAP1-mutant tumors display a BRCAness phenotype
(A) DR-GFP U2OS cells were transfected with either a non-targeting (NT) siRNA or the indicated siRNAs. Data are presented as fold change in frequency of repair of DR-GFP, relative to the samples transfected with NT siRNA. Each experiment was performed at least three times, each with triplicate measurements (±SEM). (B) KP and KPK cells were treated with NCS for three hours, fixed, and stained with DAPI and an antibody to Rad51. UT, untreated cells. A minimum of 300 cells were counted for each condition in 3 independent experiments. Data are presented as mean ±SEM. Slides were co-stained with an anti-pH2ax antibody (see Fig. S2A). (C) The indicated cell lines were treated with the indicated concentrations of talazoparib (PARPi) for 72 hours. Cell viability was measured using alamarBlue and was set as 100% for cells not treated with PARPi. Each experiment was performed at least three times, each with triplicate measurements (±SEM). Where indicated, the selective inhibitor of the KEAP1/NRF2 interaction KI696 was added 96 hours prior addition of PARPi. (D) The indicated cell lines (5×10⁵ cells) were implanted subcutaneously into the flanks of 6- to 8-week-old C57BL/6J mice. Once tumors were measurable, the mice were divided into two groups, one treated with vehicle and the other with talazoparib (PARPi) for the indicated days. Tumor size was monitored twice a week. Mice were sacrificed by the end of the treatment. Data represent mean ±SEM; n = 10. (E) Quantification of tumor weight from tumors described in (D). (F) The indicated PDXs were treated either with vehicle (CTG-465 n=9; CTG-1194 n=9; CTG-743 n=8) or talazoparib (PARPi) (CTG-465 n=8; CTG-1194 n=7; CTG-743 n=10) for the indicated days. Individual groups and full experiments are represented in Fig. S2M. Data represent mean ±SEM. (G) Quantification of tumor weight from tumors described in (F). (H) Waterfall plot showing the percentage of tumor growth in C57BL/6J mice orthotopically implanted with KP and KPK lung tumors and treated 5 days post implantation with vehicle or talazoparib (PARPi). Tumor size was determined 8 days post-implantation (initial measurement) and 15 days of drug treatment (final measurement). Each column represents one tumor (KP vehicle n=11; KP PARPi n=15; KPK vehicle n=12; KPK PARPi n=11). (I) Kaplan–Meier curve showing survival of mice bearing orthotopically implanted KPK lung tumors treated with vehicle or talazoparib (PARPi). (J) The experiment was performed as described in (D), except that 2.5×10⁵ cells were implanted subcutaneously. Data represent mean ±SEM; n=10. (K) Quantification of tumor weight from tumors described in (J).
Figure 3.
Figure 3.. KEAP1 targets EMSY for ubiquitin- and proteasome-mediated degradation
(A) KP cells were transfected for 24 hours with an empty vector (EV) or FLAG-tagged Keap1. Cells were treated with MG132 or MLN4924 for 3 hours and collected for immunoprecipitation (IP) and immunoblotting. WCE, whole-cell extract. (B) KP cells were transfected with an EV or FLAG-tagged Emsy. The experiment was performed as described in (A). (C) Lysates of KP cells were immunoprecipitated with an antibody against Keap1 or a rabbit IgG and immunoblotted. (D) Lysates of KP cells were immunoprecipitated with an antibody against Emsy or a rabbit IgG and immunoblotted. (E) The indicated U2OS clones were collected, lysed, and immunoblotted. (F) WB analysis of cell lysates from the previously analyzed PDXs (Fig. 2F–G and Fig. S2M). (G)-(H) The indicated cell lines were collected, lysed, and immunoblotted. (I) U2OS cells were transfected for 48 hours with a non-targeting (NT) siRNA or an siRNA to KEAP1. Cells were treated with H2O2, collected at the indicated times, fractionated into soluble and chromatin fractions, and immunoblotted. (J) HEK293T cells were transfected for 24 hours with an EV or FLAG-tagged KEAP1 wild-type. Cells were treated with MG132 or MLN4924 for 3 hours before collection for IP under denaturing condition with an anti-EMSY antibody followed by immunoblotting. The bracket indicates a ladder of bands with a relative molecular mass of >170,000 corresponding to polyubiquitylated EMSY. (K) IHC analysis of EMSY protein levels in human NSCLCs either KEAP1-mutant (n=12) or wild type KEAP1 (n=20). KEAP1 status was confirmed in all tumor samples by targeted exome sequencing. Bottom panel, representative IHC images. Scale bars, 50 μM.
Figure 4.
Figure 4.. EMSY is responsible for the BRCAness phenotype of KEAP1-mutant tumors
(A) KP cells were transfected for 24 hours with an EV or the indicated FLAG-tagged constructs. Cells were collected for immunoprecipitation (IP) and immunoblotting. WCE, whole-cell extract. (B) KP cells infected with lentiviruses expressing wild-type Emsy or Emsy(EEGE/AAAA) were treated with H2O2, collected at the indicated times, and immunoblotted. (C) The experiment was performed as in (B), except that cells were treated with NCS for 3 hours, fixed, and stained with DAPI and an anti-Rad51 antibody. A minimum of 300 cells were counted for each condition in 3 independent experiments (each with 3 technical repeats). Data are presented as mean ±SEM. (D) The experiment was performed as described in Fig. 2D. Data represent mean ±SEM; n=10. (E) Quantification of tumor weight from tumors described in (D). (F) The indicated cell lines (5 × 10⁵ cells) were implanted subcutaneously into the flanks of 6- to 8-week-old C57BL/6J mice. Once tumors were measurable, the mice were divided into two groups, one treated with vehicle (shCTRL n=10; shEmsy n=10) and the other with talazoparib (PARPi) (shCTRL n=6; shEmsy n=8) for the indicated days. Tumor size was monitored twice a week. Mice were sacrificed by the end of the treatment. Data represent mean ±SEM. (G) Quantification of tumor weight from tumors described in (F). (H) DR-GFP U2OS cells were transfected with a non-targeting (NT) siRNA or the indicated siRNAs. Data are presented as fold change in frequency of repair of DR-GFP relative to the samples transfected with a NT siRNA. Each experiment was performed at least three times, each with triplicate measurements (±SEM).
Figure 5.
Figure 5.. The KEAP1-dependent degradation of EMSY promotes type I interferon signaling
(A) Top 50 most significant biological process up-regulated or downregulated in KPK tumors stably infected with shEmsy vs. shCTRL. (B) Top transcription factor targets gene sets up-regulated in KPK tumors stably infected with shEmsy vs. shCTRL. (C) Volcano plot comparing the expression of ISGs between KPK shEmsy and KPK shCTRL cells. Plotted for each transcript are the negative log10 of the p-value and the log2 of the fold change of gene expression. The blue dots represent genes with an FDR threshold of 5%. The red dots represent ISGs. (D) GSEA of the indicated gene signatures between KEAP1 wild type and mutant tumors using RNA-seq data from TCGA. (E) KP and KPK cells were treated with either poly(ISD) or poly(G:C), collected at the indicated times and immunoblotted. (F) KP cells were treated with poly(G:C) before collection for IP under denaturing condition with an anti-Emsy antibody followed by immunoblotting. The bracket indicates a ladder of bands with a relative molecular mass of >170,000 corresponding to polyubiquitylated Emsy. WCE, whole-cell extract. (G) KP and KPK cells were co-transfected with ISRE-Firefly luciferase reporter and Renilla luciferase. Eight hours post-transfection cells were treated with poly(G:C) for 16 hours prior luciferase activity quantification. ISRE-Firefly luciferase signal is expressed as fold change relative to Renilla luciferase. Data represent mean ±SEM. n=3. (H) Experiment was performed as in (G), except that cells were treated with interferon alpha for 16 hours prior luciferase activity quantification. (I) The indicated cell lines were treated with poly(G:C) for 16 hours. Relative expression levels of Ifnα gene was determined by qRT-PCR. Data are presented as means ±SEM. n=3. (J) Experiment was performed as in (I). Interferon alpha was measured by ELISA. Data are presented as means ±SEM. n=3.
Figure 6.
Figure 6.. Emsy stabilization in Keap1-mutant tumors promotes lung cancer immune evasion
(A) KP cells infected with lentiviruses expressing an EV or Emsy(EEGE/AAAA) were treated with poly(G:C) for 16 hours. Relative expression of Ifnα gene was determined by qRT-PCR. Data are presented as means ±SEM. n= 3. (B) KP and KPK cells were infected with lentiviruses expressing shCTRL or shEmsy under the control of a doxycycline-inducible promoter, and treated with 0.2 μg/μL doxycycline for 72 hours. Cells were then treated with poly(G:C) for 16 hours. Relative expression levels of Ifnα gene was determined by qRT-PCR. Data are presented as means ±SEM. n= 3. (C) The indicated cell lines (5 × 10⁵ cells) were implanted subcutaneously into the flanks of 6- to 8-week-old Prkdcscid; Il2rgtm1Wjl mice (NSG mice). Once tumors were measurable, the mice were treated with doxycycline-containing food (KP shCTRL n=10; KP shEmsy n=8; KPK shCTRL n=10; KPK shEmsy n=10) to induce shCTRL or shEmsy for the indicated days. Tumor size was monitored twice a week. Mice were sacrificed by the end of the treatment. Data represent mean ±SEM. (D) Quantification of tumor weight from tumors described in (C). (E) The indicated cell lines (5 × 10⁵ cells) were implanted subcutaneously into the flanks of 6- to 8-week-old mice with the indicated genetic background. Once tumors were measurable, the mice were treated with doxycycline-containing food (n=9–10/group) to induce shCTRL or shEmsy for the indicated days. Tumor size was monitored twice a week. Mice were sacrificed by the end of the treatment. Data represent mean ±SEM. (F) Quantification of tumor weight from tumors described in (E). (G) Waterfall plot showing percentage of tumor growth in C57BL/6J mice orthotopically implanted with KP and KPK lung tumors and treated with doxycycline 5 days post implantation to induce shCTRL or shEmsy expression. Tumor size was determined 5 days post-implantation (initial measurement) and 15 days of doxycycline treatment (final measurement). Each column represents one tumor (KP shCTRL n=12; KP shEmsy n=15; KPK shCTRL n=12; KPK shEmsy n=12). (H) FACS analysis of Cd206 levels within the Cd11b+, Gr1- cells (M2-like TAMs) among the total tumor infiltrating Cd45+ cells in the tumors described in (G). (I) FACS analysis of Cd8+ (as fraction of Cd3+ T-cells) cells among the total tumor infiltrating Cd45+ cells in the tumors described in (G).
Figure 7.
Figure 7.. STING agonist, alone or in combination with PARPi, as a therapeutic strategy for KEAP1 mutant tumors
(A) Waterfall plot showing the percentage of tumor growth in C57BL/6J mice orthotopically implanted with KP and KPK lung tumors and treated 5 days post implantation with vehicle or DMXAA (STINGa). Tumor size was determined 8 days post-implantation (initial measurement) and 15 days of drug treatment (final measurement). Each column represents one tumor (KP vehicle n=13; KP STINGa n=12; KPK vehicle n=15; KPK STINGa n=12). (B) KNetL plot showing cluster separation of 21 live leukocyte subsets isolated from orthotopically implanted KP and KPK lung tumors treated with STINGa or vehicle, and analyzed by 10x single cell RNA sequencing (scRNA-seq) (n=3 mice/group). (C) Relative proportional analysis of Clusters 6, 8, 10, 15, 17 and 19 as a fraction of total tumor immune infiltrate in each treatment group from the tumors described in (B) based on sc-RNA seq. (D) FACS analysis of phospho-Tbk1 (pTbk1) levels within the Cd11b+, Gr1+ (MDSCs) cells among the total tumor infiltrating Cd45+ cells in the tumors described in (A). (E) FACS analysis of Cd3+ (T-cells) cells among the total tumor infiltrating Cd45+ cells in the tumors described in (A). (F) KPK cell lines (5 × 10⁵ cells) were implanted subcutaneously into the flanks of 6–8-week-old C57BL/6J mice. Once tumors were measurable, mice were randomized and treated with the indicated drugs. Tumor size was monitored twice a week. Mice were sacrificed by the end of the treatment. Data represent mean ±SEM. n=10. (G) Quantification of tumor weight from tumors described in (F). (H) Model of KEAP1-dependent regulation of EMSY levels in NSCLC.

References

    1. Alexandrov LB, Nik-Zainal S, Wedge DC, Aparicio SA, Behjati S, Biankin AV, Bignell GR, Bolli N, Borg A, Borresen-Dale AL, et al. (2013). Signatures of mutational processes in human cancer. Nature 500, 415–421. - PMC - PubMed
    1. Bagaev A, Kotlov N, Nomie K, Svekolkin V, Gafurov A, Isaeva O, Osokin N, Kozlov I, Frenkel F, Gancharova O, et al. (2021). Conserved pan-cancer microenvironment subtypes predict response to immunotherapy. Cancer Cell 39, 845–865 e847. - PubMed
    1. Bar J, Herbst RS, and Onn A (2008). Multitargeted inhibitors in lung cancer: new clinical data. Clin Lung Cancer 9 Suppl 3, S92–99. - PubMed
    1. Berland L, Heeke S, Humbert O, Macocco A, Long-Mira E, Lassalle S, Lespinet-Fabre V, Lalvee S, Bordone O, Cohen C, et al. (2019). Current views on tumor mutational burden in patients with non-small cell lung cancer treated by immune checkpoint inhibitors. J Thorac Dis 11, S71–S80. - PMC - PubMed
    1. Buttner R, Longshore JW, Lopez-Rios F, Merkelbach-Bruse S, Normanno N, Rouleau E, and Penault-Llorca F (2019). Implementing TMB measurement in clinical practice: considerations on assay requirements. ESMO Open 4, e000442. - PMC - PubMed

Publication types

MeSH terms