. 2022 Jan 6;185(1):184-203.e19.
doi: 10.1016/j.cell.2021.12.004. Epub 2021 Dec 27.

Discovering dominant tumor immune archetypes in a pan-cancer census

Collaborators, Affiliations

Discovering dominant tumor immune archetypes in a pan-cancer census

Alexis J Combes et al. Cell. .

Abstract

Cancers display significant heterogeneity with respect to tissue of origin, driver mutations, and other features of the surrounding tissue. It is likely that individual tumors engage common patterns of the immune system-here "archetypes"-creating prototypical non-destructive tumor immune microenvironments (TMEs) and modulating tumor-targeting. To discover the dominant immune system archetypes, the University of California, San Francisco (UCSF) Immunoprofiler Initiative (IPI) processed 364 individual tumors across 12 cancer types using standardized protocols. Computational clustering of flow cytometry and transcriptomic data obtained from cell sub-compartments uncovered dominant patterns of immune composition across cancers. These archetypes were profound insofar as they also differentiated tumors based upon unique immune and tumor gene-expression patterns. They also partitioned well-established classifications of tumor biology. The IPI resource provides a template for understanding cancer immunity as a collection of dominant patterns of immune organization and provides a rational path forward to learn how to modulate these to improve therapy.

Keywords: Pan Cancer analysis; immune profiling; solid tumor microenvironement; system immunology; tumor immunology; unsupervised clustering.


Conflict of interest statement

Declaration of interests M.F.K. is a founder and shareholder of PIONYR immunotherapeutic and FOUNDERY innovations. A.I.D. is a shareholder of Trex and Neuvogen, and he is also a member of the scientific advisory board of Neuvogen, Bristol-Myers and Squibb, Merck, Roche, Pfizer, Genentech, Incyte, Amgen, and Novartis. E.A.C. is a consultant at IHR Therapeutics, Valar, and Pear Diagnostics, reports receiving commercial research grants from Astra Zeneca, Ferro Therapeutics, Senti Biosciences, Merck KgA, and Bayer, and has stock ownership in Tatara Therapeutics, Clara Health, BloodQ, and Guardant Health.

Figures

Figure 1:
Figure 1:. Generation and validation steps of T cells, Myeloid cells and Stromal cells features from solid tumors using flow cytometry and bulk RNA-sequencing.
A. Details of the Immunoprofiler initiative (IPI) cohort tumor samples collection, color-coded by anatomical region and annotated with case numbers of bulk-RNA sequencing of viable cells sorted from fresh surgical tumor specimens and total number of samples with flow cytometry data. B. Description of the processing pipeline for digesting fresh tumor specimens into single cell suspension, submitting to multi-parametric flow cytometry for immune phenotyping and cell sorting into six different cell population compartments (live (viable cells), tcell (conventional T cells), treg (T regulatory cells), myeloid (myeloid cells, stroma (CD90+ CD44+ stromal cells), and tumor (tumor cells). C. Box and whisker plots of flow score for T cells (n=200), Mononuclear phagocytes (n=159), and Stromal cells (n=121) based on population percent in tumor specimens measured by flow cytometry (see Supplementary table S2 for details by cancer type). D.-Left-Gene score calculation method (see STAR methods).-Right-Correlation plots of Tcell, Myeloid and CD90+ CD44+ Stroma gene signature scores, for each tumor specimens, against their corresponding flow score (See Fig Supp 1 and STAR protocol) color-coded according to the tumor types shown in 1C. E. Cross-whisker plots comparing median Tcell, Myeloid and CD90+ CD44+ Stroma gene signature scores by tumor type to the median flow score, color-coded according to the tumor types shown in 1C, with the interquartile range on both axes.
Figure 2:
Figure 2:. Identification of coarse immune archetypes in solid tumors using Louvain clustering on two independent datasets.
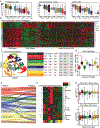
A,E. UMAP display using KNN and Louvain clustering of tumor immune archetypes using Tcell, Myeloid and CD90+ CD44+ Stroma features to cluster patients in the IPI (A) and TCGA (E) cohorts. Each dot represents a single patient. B,F. UMAP overlays of the Tcell, Myeloid and CD90+ CD44+ Stroma features in the IPI (B) and TCGA (F) cohorts. C. Violin plots of Tcell, Myeloid and CD90+ CD44+ Stroma features for each cluster/archetype in IPI cohort. D. Table summarizing the six cluster/archetypes with descriptions based on the level of the Tcell, Myeloid and CD90+ CD44+ Stroma features. G,H. Representative Immunofluorescence of tumor specimens using CD45 (red) and DAPI (blue) staining for each cluster/archetype (G) and respective quantification of immune cell frequency (H). I,J. Box and whisker plot (I) and UMAP overlay (J) of immune cell frequency using flow cytometry. K,L. Box and whisker plot (K) and UMAP overlay (L) of a pan chemokine phenotype gene signature score. M. Heatmap and hierarchical clustering of median chemokine gene expression per cluster/archetype identified in IPI cohort. N. (top) Bubble plot of median chemokine gene expression by cluster/archetype identified in the IPI (green) and TCGA (violet) cohorts. (bottom) Bar plots of median Log TPM gene expression of each chemokine in the IPI (green) and TCGA (violet) cohorts. The colors used correspond to the archetypes presented in in Fig. 2D.
Figure 3:
Figure 3:. Coarse immune archetypes are independent of tissue origin and associated to overall survival.
A. Left-UMAP display, and graph-based clustering of 3-feature tumor immune archetypes color-coded by tumor type-Right stacked bar plot of the tumor type distribution for 3-feature archetypes. B. Kaplan-Meier overall survival curves for each immune tumor archetype identified in the TCGA cohort. C. (Left) Pie charts representing distributions of each archetype by cancer type in the IPI (top) and TCGA (bottom) cohorts. (Right) Kaplan-Meier overall survival curve for each immune tumor archetype identified in the TCGA cohort for Kidney renal clear cell carcinoma (KIRC), Skin cutaneous melanoma (SKCM), Sarcoma (SARC) and Colon adenocarcinoma (COAD). D. Box and whisker plot of CD4+ regulatory T cells frequency in tumor measured by flow cytometry for each cluster/archetype identified in 3-feature archetypes. E. Box and whisker plot of log2 CD4+ to CD8+ conventional T cell frequency ratio in tumor measured by flow cytometry for each cluster/archetype in 3-feature archetypes.
Figure 4:
Figure 4:. Inclusion of T cell subset features subdivide immune archetypes by CD4 to CD8 ratio.
A. Box and whisker plots of feature gene signature scores for CD4+ regulatory T cells (Treg feature) out of the live compartment, CD4+ and CD8+ conventional T cells (CD4 and CD8 features) out of the tcell compartment of patients in the IPI cohort. B. Heatmap and hierarchical clustering of CD4 (yellow) and CD8 (blue) feature genes’ normalized expression, for patients in the tcell compartment. C. (Left) UMAP display and graph-based clustering of tumor immune archetypes using Tcell, Myeloid, CD90+ CD44+ Stroma, CD4, CD8 and Treg features to cluster patients in the IPI cohort. Each dot represents a single patient. (Right) Table summarizing the eight cluster/archetypes with descriptions based on the abundance of the Tcell, Myeloid CD90+ CD44+ Stroma, CD4, CD8 and Treg features. D. Box and whisker plot of log2 CD4+ to CD8+ conventional T cell feature gene signature score ratio in tumor for each of the clusters/archetypes identified with 6-feature clustering. E. Alluvial plot depicting how cluster/archetype membership perpetuates or subdivides from 3 to 6-feature clustering. F. Heatmap and hierarchical clustering of the median chemokine gene expression for each cluster/archetype identified in the 6-feature clustering. G. Box and whisker plot of log2 cDC2 to cDC1 ratio (top) and Mono to Macs ratio (bottom) measured by flow cytometry for each cluster/archetype identified.
Figure 5:
Figure 5:. Single-cell RNA sequencing-derived myeloid signatures refines immune archetypes.
A. (Left)Box and whisker plots for the Macrophages, Monocytes, cDC1 and cDC2 features, calculated in the myeloid compartment, from the IPI cohort. (Right) UMAP display and graph-based clustering of tumor immune archetypes using Tcell, Myeloid, CD90+ CD44+ Stroma, Treg, CD4, CD8, Macrophages, Monocytes, cDC1 and cDC2 features to cluster patients in the IPI cohort. B. Alluvial plot depicting how cluster/archetype membership perpetuates or subdivides from 6 to 10-feature clustering. C. (Left) Schematic of a “phylogeny” of the cluster/archetypes as they progressed from 3-feature to 6-feature to 10-feature clustering. D-N. Scatter plots of different features defining the twelve clusters/archetypes identified in the IPI cohort. O, R. UMAP overlay of Macrophages (Macs) and Monocytes (Mono) (O) and classical dendritic cell type 1 (cDC1) and 2 (cDC2) feature scores (R) for each cluster/archetype identified by 10-feature clustering. P, Q, S, T. Box and whisker plot of Ln Mono to Macs ratio (P), Treg feature gene score (Q) Ln cDC2 to cDC1 ratio (S) Ln CD4 to CD8 conventional T cells ratio (T) for each cluster/archetype identified.
Figure 6:
Figure 6:. Each tumor archetype is defined by a unique combination of immune gene expression pattern
A. Bubble plot of NK cells (natural killer cells), B cells, plasma cells and Mast cells associated gene expression in the live compartment grouped by clusters/archetypes identified in the IPI cohort using 10-feature clustering. B. Heatmap and hierarchical clustering of the median chemokine gene expression of all chemokines in the Chemokine phenotype signature, grouped by cluster/archetype. C. Bubble plot of gene expression in Macrophages (M1, M2) and Dendritic cells (Co-Stim, DC) function in the myeloid compartment, grouped by cluster/archetypes in the IPI cohort. D. Heatmap and hierarchical clustering of the median gene expression of B cells (all viable RNAseq compartment), NK cells (all viable RNAseq compartment), plasma cells (all viable RNAseq compartment) T cells phenotypes (Tconv RNAseq compartment, T regs(Treg RNAseq compartment), macrophages and dendritic cells function (Myeloid RN Aseq compartment) grouped by cluster/archetype in IPI cohort.
Figure 7:
Figure 7:. Immune archetypes tie closely to tumor biology and disease outcome.
A. A. Left-UMAP display and graph-based clustering of tumor immune archetypes using 10-feature clustering color-coded by tumor type. Each dot represents a single patient. Right-stacked bar plot of the tumor type distribution for 10-feature immune archetypes. B. UMAP overlay (Left) and box and whisker plot (Right) of tumor proliferation measured by frequency of Ki67+ CD45− cells by flow cytometry in the IPI cohort. C. Bubble plot of the median gene expression, in the tumor compartment, of gene sets associated with previously identified tumor transcriptional programs grouped by cluster/archetypes in the IPI cohort. D,E. Heatmap and hierarchical clustering of immune archetype gene signatures median expression in the tumor compartment (D) and the live compartment (E) in the IPI cohort. F. Multivariate survival regression of overall survival in the TCGA cohort for each immune archetype after multivariate analysis using gene signatures in (E), split by T conventional subset enrichment). Median survival (MS) and p-value associated with each survival curve are noted.

References

    1. Angelo M, Bendall SC, Finck R, Hale MB, Hitzman C, Borowsky AD, Levenson RM, Lowe JB, Liu SD, Zhao S, et al. (2014). Multiplexed ion beam imaging of human breast tumors. Nat Med 20, 436–442. - PMC - PubMed
    1. Aran D, Hu Z, and Butte AJ (2017). xCell: digitally portraying the tissue cellular heterogeneity landscape. Genome Biol 18, 220. - PMC - PubMed
    1. Arce Vargas F, Furness AJS, Litchfield K, Joshi K, Rosenthal R, Ghorani E, Solomon I, Lesko MH, Ruef N, Roddie C, et al. (2018). Fc Effector Function Contributes to the Activity of Human Anti-CTLA-4 Antibodies. Cancer Cell 33, 649–663.e4. - PMC - PubMed
    1. Asp M, Giacomello S, Larsson L, Wu C, Fürth D, Qian X, Wärdell E, Custodio J, Reimegård J, Salmén F, et al. (2019). A Spatiotemporal Organ-Wide Gene Expression and Cell Atlas of the Developing Human Heart. Cell 179, 1647–1660.e19. - PubMed
    1. Azizi E, Carr AJ, Plitas G, Cornish AE, Konopacki C, Prabhakaran S, Nainys J, Wu K, Kiseliovas V, Setty M, et al. (2018). Single-Cell Map of Diverse Immune Phenotypes in the Breast Tumor Microenvironment. Cell 174, 1293–1308.e36. - PMC - PubMed

Publication types

Substances