. 2022 Jan 10;57(1):63-79.e8.
doi: 10.1016/j.devcel.2021.12.005. Epub 2021 Dec 27.

The imprinted Igf2-Igf2r axis is critical for matching placental microvasculature expansion to fetal growth

Affiliations

The imprinted Igf2-Igf2r axis is critical for matching placental microvasculature expansion to fetal growth

Ionel Sandovici et al. Dev Cell. .

Abstract

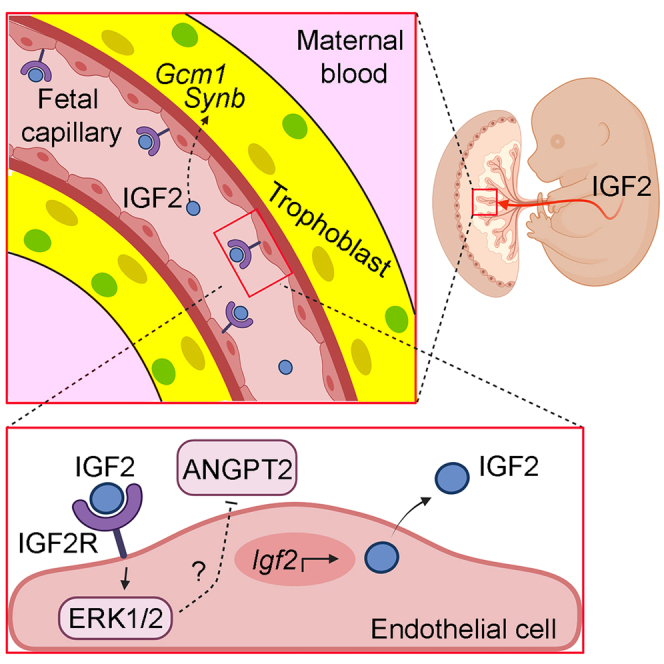
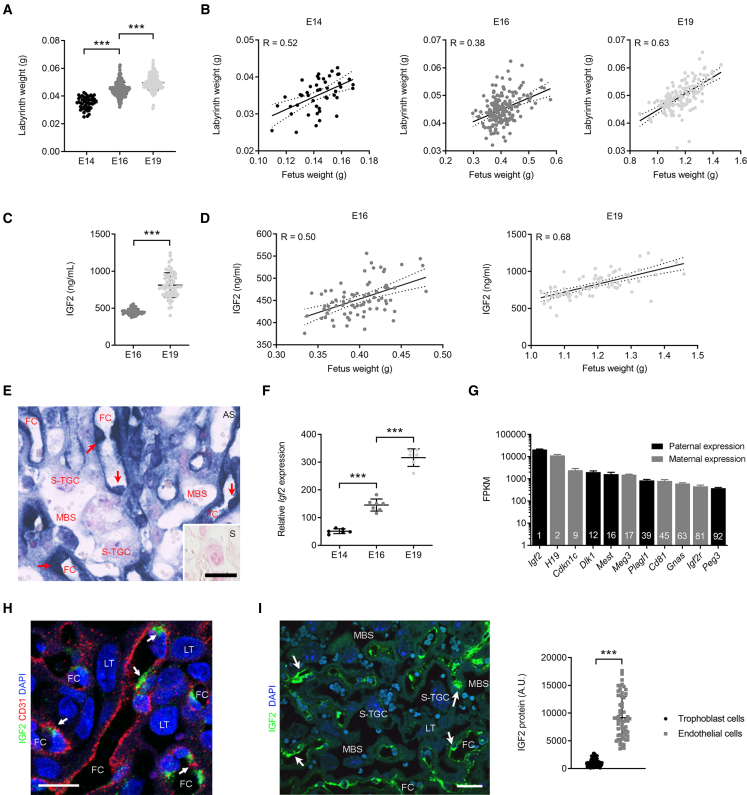
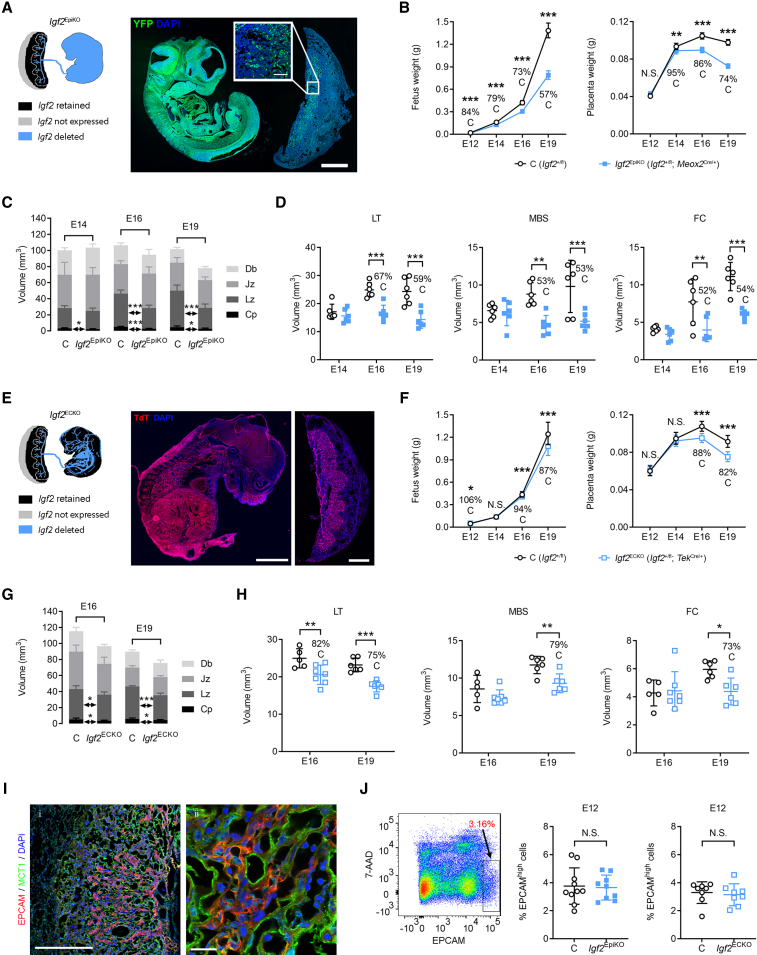
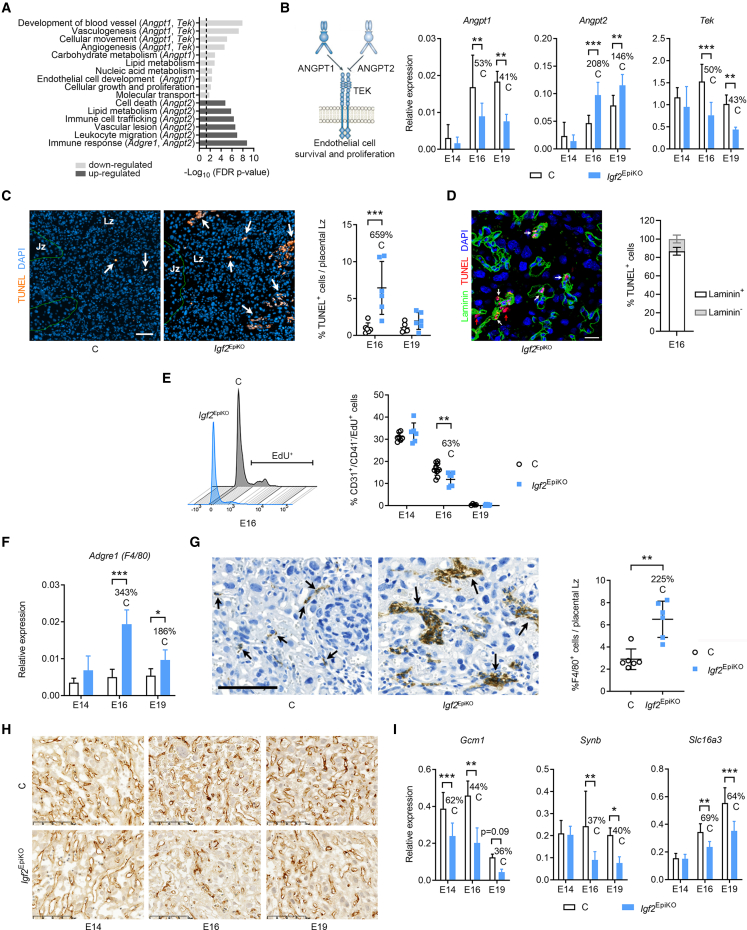
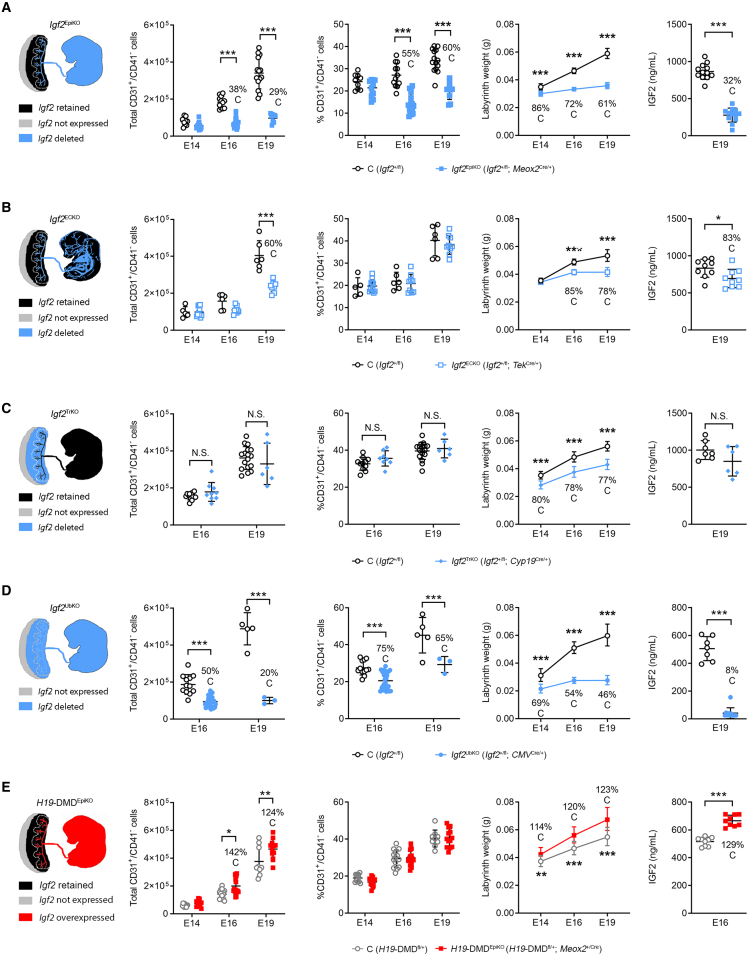
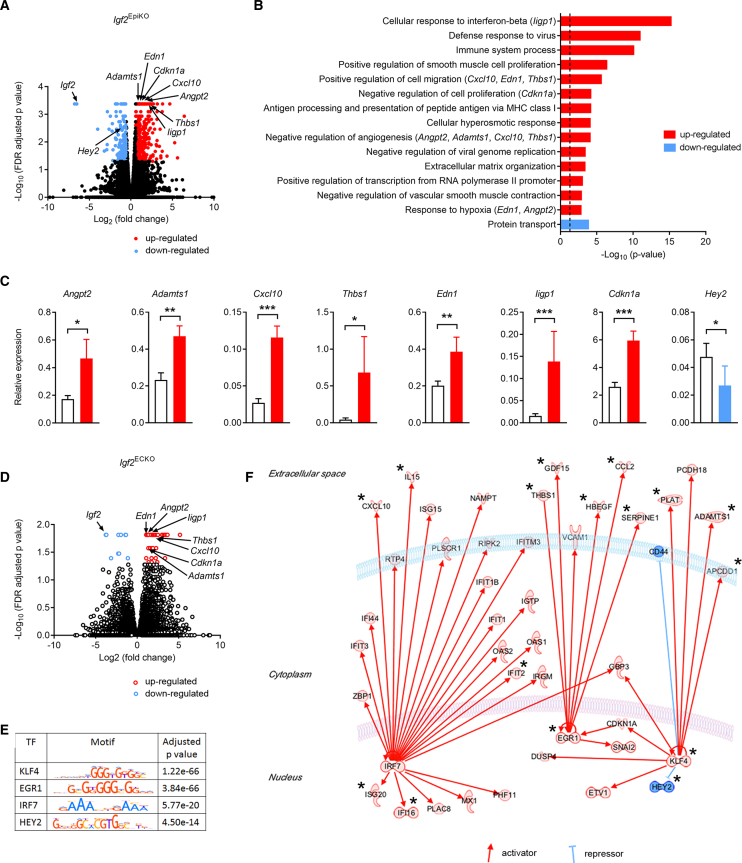
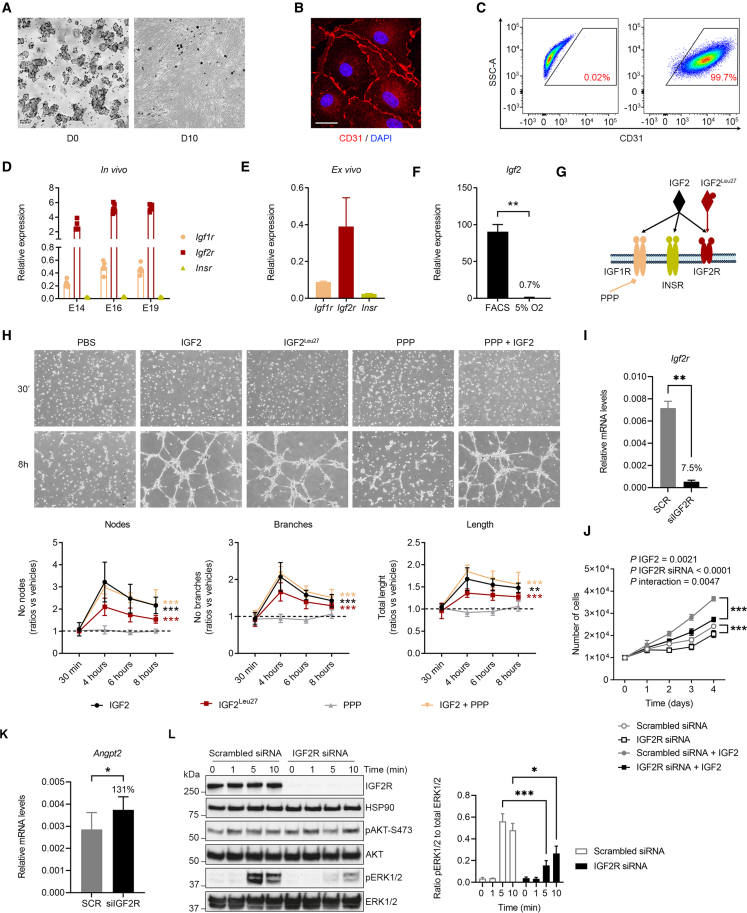
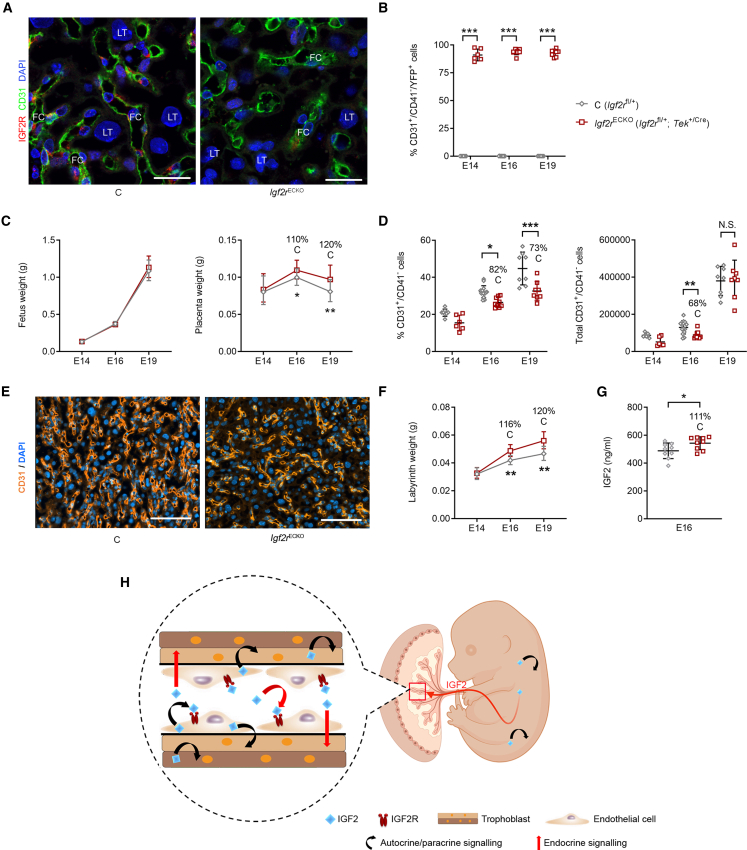
In all eutherian mammals, growth of the fetus is dependent upon a functional placenta, but whether and how the latter adapts to putative fetal signals is currently unknown. Here, we demonstrate, through fetal, endothelial, hematopoietic, and trophoblast-specific genetic manipulations in the mouse, that endothelial and fetus-derived IGF2 is required for the continuous expansion of the feto-placental microvasculature in late pregnancy. The angiocrine effects of IGF2 on placental microvasculature expansion are mediated, in part, through IGF2R and angiopoietin-Tie2/TEK signaling. Additionally, IGF2 exerts IGF2R-ERK1/2-dependent pro-proliferative and angiogenic effects on primary feto-placental endothelial cells ex vivo. Endothelial and fetus-derived IGF2 also plays an important role in trophoblast morphogenesis, acting through Gcm1 and Synb. Thus, our study reveals a direct role for the imprinted Igf2-Igf2r axis on matching placental development to fetal growth and establishes the principle that hormone-like signals from the fetus play important roles in controlling placental microvasculature and trophoblast morphogenesis.

Keywords: IGF2; IGF2R; angiogenesis; angiopoietins; development; endothelial cells; fetal growth; genomic imprinting; placenta; trophoblast morphogenesis.


Conflict of interest statement

Declaration of interests The authors declare no competing interests.

Figures

None
Graphical abstract
Figure 1
Figure 1
Lz expansion is associated with increasing levels of circulating and endothelial IGF2 (A) Weights of micro-dissected Lz. (B) Linear correlation analyses between fetal and Lz weights: p = 0.002 (E14), p < 0.0001 (E16), and p < 0.0001 (E19) (n = 46–189 placentae from n > 10 L per group in [A] and [B]). (C) Levels of IGF2 (ng/mL) in plasma of wild-type fetuses. (D) Linear correlation analyses between fetal weights and circulating IGF2: p < 0.0001 (E16 and E19) (n = 70–79 per group in [C] and [D]). (E) Igf2 mRNA in situ hybridization (blue) in E14 wild-type Lz (red arrows—FPEC, feto-placental endothelial cells; AS, antisense probe; inset with S, sense probe; scale bars, 20 μm). (F) Relative Igf2 mRNA expression levels measured by qRT-PCR in FPEC from wild-type Lz (n = 6–7 per group). (G) Imprinted genes that rank within top 100 expressed genes in E16 wild-type FPEC (FPKM, fragments per kilobase million; n = 4). (H) Double immunostaining for IGF2 and CD31 in E19 wild-type placenta. Endothelial cells are very thin and hard to detect except where the cytoplasm is more voluminous around the nucleus, with intense IGF2 stain (white arrows). Transmembrane glycoprotein CD31 immunostaining is in the membrane and largely marks endothelial intercellular junctions (scale bars, 20 μm). (I) Semi-quantitative measurement of IGF2 protein in FPEC versus trophoblast cells (E19 wild-type Lz, n = 60 cells per group from two placentae). White arrows—endothelial cells; scale bars, 50 μm. For (E), (H), and (I): FC, fetal capillaries; MBS, maternal blood spaces; LT, labyrinthine trophoblast cells; S-TGC, sinusoidal trophoblast giant cells. Data in (A), (C), (F), (G), and (I) are presented as averages ± standard deviation (SD); ∗∗∗p < 0.001 calculated by one-way ANOVA plus Tukey’s multiple comparisons test in (A) and (F) or by unpaired t test with Welch’s correction in (C) and (I). See also Table S1.
Figure 2
Figure 2
Deletion of Igf2 in the epiblast or endothelium impairs Lz expansion (A) Left: schematic of Igf2 expression in conceptuses with conditional deletion driven by Meox2Cre. Right: immunostaining for YFP (green) in a representative fetus and placenta paraffin section at E12 of gestation, double transgenic for Meox2Cre and Rosa26flSTOPflYFP10 reporter. YFP expression in the placenta is localized to the Lz and Cp (high magnification, inset). Blue—DAPI stain for nuclei; scale bars: 1 mm (low magnification) and 100 μm (high magnification). (B) Fetal and placental growth kinetics, measured as average wet-weights for each genotype per litter (E12: n = 10 L [n = 41 controls {C} and n = 32 Igf2EpiKO]; E14: n = 25 L [n = 114 C and n = 88 Igf2EpiKO]; E16: n = 37 L [n = 154 C and n = 127 Igf2EpiKO]; E19: n = 37 L [n = 164 C and n = 121 Igf2EpiKO]). (C) Absolute volumes of the placental layers (Db, decidua basalis; Jz, junctional zone; Lz, labyrinthine zone; Cp, chorionic plate), measured by stereology (n = 6 per group). (D) Absolute volumes of Lz components, measured by stereology (LT, labyrinthine trophoblast; MBSs, maternal blood spaces; FCs, fetal capillaries) (n = 6 per group). (E) Left: schematic representation of Igf2 expression in conceptuses with conditional deletion driven by TekCre. Right: representative confocal microscopy of frozen sections from a fetus and its corresponding placenta, double transgenic for TeKCre and Ai9(RCL-tdT) reporter at E16 of gestation. Scale bars: 2 mm (fetus) and 1 mm (placenta). (F) Fetal and placental growth kinetics (E12: n = 5 L [n = 17 C and n = 16 Igf2ECKO]; E14: n = 8 L [n = 26 C and n = 34 Igf2ECKO]; E16: n = 13 L [n = 60 C and n = 46 Igf2ECKO]; E19: n = 7 L [n = 31 C and n = 27 Igf2ECKO]). (G) Absolute volumes of the placental layers measured by stereology (n = 5–7 per group). (H) Absolute volumes of Lz components, measured by stereology (n = 5–7 per group). (I) Double immunostaining for EPCAM (epithelial cell adhesion molecule) (red) and MCT1 (monocarboxylate transporter 1) (green) in a representative frozen placental section at E12 of gestation. EPCAM expression is observed as clusters of positive cells within the Lz placenta. Blue—DAPI (4′,6-diamidino-2-phenylindole) stain for nuclei; scale bars: 500 μm (left panel) and 20 μm (right panel). (J) Analysis of EPCAMhigh-positive cells by flow cytometry. Left panel: example of gating used to identify EPCAMhigh-positive cells (the viability dye 7-aminoactinomycin D [7-AAD] was used to exclude dead cells). Right: quantification of placental EPCAMhigh-positive cells at E12 in conceptuses with conditional Igf2 deletion driven by Meox2Cre (n = 10 C and n = 9 Igf2EpiKO from 2 L) or TekCre (n = 8 C and n = 8 Igf2ECKO from 2 L). For all graphs data are shown as averages; error bars represent SD in (C), (D), (G), (H), and (J) or 95% confidence intervals (95% CI) in (B) and (F); N.S.—statistically not significant; p < 0.05; ∗∗p < 0.01; ∗∗∗p < 0.001 calculated by a mixed effects model in (B) and (F) (see STAR Methods), two-way ANOVA plus Sidak’s multiple comparisons tests in (D) and (H) or unpaired t tests in (C), (G), and (J). See also Figures S1–S3.
Figure 3
Figure 3
Lack of fetus-derived IGF2 reduces the expansion of feto-placental microvasculature in late gestation (A) Functions enriched in DEGs at E19. (B) qRT-PCR analysis of angiopoietin-Tie2/TEK signaling components in Lz (n = 6–8 per group). (C) TUNEL (terminal deoxynucleotidyl transferase dUTP nick end labeling) staining in E16 Lz (arrows point to apoptotic cells) and data quantification (n = 6 samples per group); scale bars, 50 μm. (D) Left: representative double immunostaining for TUNEL (red) and laminin (green, marker of feto-placental capillaries) in the Lz of an E16 Igf2EpiKO mutant placenta (DAPI, blue marks the nuclei; white and red arrows indicate TUNEL+ FPECs and LT, respectively; scale bars, 25 μm). Right: quantification of TUNEL+ cells that are positive or negative for laminin (n = 6 Igf2EpiKO mutant placentae). (E) Feto-placental endothelial cell (FPEC) proliferation measured by flow cytometry (left—representative histograms at E16; right—data quantification; n = 4–11 per group). (F) qRT-PCR analysis of Adgre1 in Lz. (G) Representative F4/80 immunostainings in E16 Lz (arrows indicate macrophages). Scale bars, 100 μm. Right: percentage of macrophages/Lz at E16 (n = 6–8 samples per group). (H) Representative CD31 immunostaining in Lz (scale bars, 100 μm). (I) qRT-PCR analysis for SynT-II (syncytiotrophoblast layer II) marker genes. For all graphs, data are presented as averages or individual values; error bars are SD; p < 0.05, ∗∗p < 0.01, ∗∗∗p < 0.001 by two-way ANOVA plus Sidak’s multiple comparisons tests in (B), (C), (E), (F), and (I) or Mann-Whitney tests in (G). See also Figure S4 and Table S2.
Figure 4
Figure 4
Genetic models of mismatched placental and fetal growth reveal circulating IGF2 as a major endocrine regulator of FPEC and Lz expansion (A–E) Column 1: schematic diagrams of the genetic models: Igf2EpiKO (A), Igf2ECKO (B), Igf2TrKO (C), Igf2UbKO (D), and H19-DMDEpiKO (E). Columns 2 and 3: total numbers (column 2) and proportion of FPEC/Lz (column 3), measured by flow cytometry (n conceptuses per group: Igf2EpiKO: n = 9–18; Igf2ECKO: n = 5–11; Igf2TrKO: n = 6–17; Igf2UbKO: n = 3–26; H19-DMDEpiKO: n = 9–15). Column 4: Lz growth kinetics (Igf2EpiKO: n = 9–20 L; Igf2ECKO: n = 3–9 L; Igf2TrKO: n = 4–9 L; Igf2UbKO: n = 3–8 L; H19-DMDEpiKO: n = 3–4 L). Column 5: IGF2 levels (ng/mL) in plasma (n per group: Igf2EpiKO: n = 12; Igf2ECKO: n = 9; Igf2TrKO: n = 6–7; Igf2UbKO: n = 7–11; H19-DMDEpiKO: n = 9). Data are shown as averages or individual values and error bars are SD (columns 2, 3, and 5) and 95% CI (column 4). N.S.—not significant; p < 0.05; ∗∗p < 0.01; ∗∗∗p < 0.001 calculated by two-way ANOVA plus Sidak’s multiple comparisons tests (second and third columns), mixed effects model (fourth column) or Mann-Whitney tests (fifth column). See also Figures S5A, S5B, and S6.
Figure 5
Figure 5
IGF2 signaling regulates angiogenic properties of endothelial cells (A) Volcano plot representation of DEGs identified by RNA-seq in E16 FPEC (Igf2EpiKO versus controls). Significant upregulated and downregulated DEGs (false discovery rate [FDR] < 0.05) are shown with red and blue, respectively. (B) Top scoring biological processes enriched in DEGs. Biologically validated DEGS are listed in parentheses. The dotted line corresponds to FDR-corrected p value of 0.05. (C) Biological validation. Data are shown as averages (n = 11–12 samples per group); error bars are SEM; p < 0.05, ∗∗ p < 0.01, ∗∗∗ p < 0.001 calculated by Mann-Whitney tests. (D) Volcano plot representation of DEGs identified by RNA-seq in E16 FPEC (Igf2ECKO versus controls). Significant upregulated and downregulated DEGs (FDR < 0.05) are shown with red and blue, respectively. (E) Transcription factors (TFs) identified by analysis of motif enrichment (AME). (F) IPA regulatory network built with the four TFs identified using AME analysis. Proteins labeled with a star are known regulators of angiogenesis (angiostatic or pro-angiogenic factors) and key references are listed in Table S4. See also Figures S5C and S5D and Tables S3 and S4.
Figure 6
Figure 6
IGF2 Acts on FPECs via IGF2R-ERK signaling ex vivo (A) Primary FPEC isolated from E16 Lz: D0—freshly isolated cells; D10—FPEC at passage one (P1, 10 days of culture). (B) Confocal imaging of passage one FPEC, stained for CD31 (scale bars, 20 μm). (C) Flow cytometry analysis of P1 FPEC stained for CD31, demonstrating that these are almost exclusively CD31+. (D) qRT-PCR analysis for Igf1r, Igf2r, and Insr in FPECs isolated by FACS (n = 6–7 per group). (E) Relative expression of the three IGF receptors in P1 FPEC. (F) qRT-PCR analysis of Igf2 mRNA levels in P1 FPEC cultured in 5% O2 versus primary FPEC isolated from E16 Lz by FACS. (G) Schematic representation of IGF2 and IGF receptors. IGF2Leu27 analog acts specifically on IGF2R and picropodophyllin (PPP) inhibits phosphorylation of IGF1R. (H) Representative images of capillary-like tube formation assay in primary FPEC seeded on matrigel and exposed to exogenous IGF2, IGF2Leu27, PPP, or PPP+IGF2 (equal seeding of cell numbers at 30 min and tube formation at 8 h), and quantification of number of nodes, branches, and total length (n = 5–6 independent experiments). (I) qRT-PCR analysis of Igf2r mRNA levels in primary FPECs upon knockdown by siRNA (n = 8 samples/group). (J) Proliferation assay of primary FPEC with or without IGF2R siRNA knockdown, in presence or absence of IGF2, on 4 consecutive days after plating. Cells with IGF2R siRNA knockdown exhibit significant proliferation defects that are further accentuated upon IGF2 treatment (n = 5 biological replicates per group). (K) qRT-PCR analysis of Angpt2 mRNA levels in primary FPECs transfected with scrambled siRNA or IGF2R siRNA, upon 4 days of treatment with 50 ng/mL mouse recombinant IGF2 (n = 8 samples/group). (L) Left side: identification of delayed ERK1/2 phosphorylation in FPECs with IGF2R siRNA knockdown upon acute treatment with 50 ng/mL mouse recombinant IGF2. HSP90 was used as internal control for protein loading. Right side: quantification of ratios pERK1/2 to total ERK1/2 for n = 3 independent biological replicates. For all graphs, data are presented as averages or individual values and error bars represent SEM. p < 0.05, ∗∗p < 0.01, and ∗∗∗p < 0.001 calculated by a Mann-Whitney test in (F), two-way ANOVA tests with Sidak’s multiple comparisons test in (H), (J), and (L), Wilcoxon matched-pairs signed rank test in (I) and paired Student’s t test in (K).
Figure 7
Figure 7
IGF2 acts on FPECs via IGF2R in vivo (A) Representative double immunostaining for IGF2R (red) and CD31 (green) in Igf2rECKO mutant and control Lz at E16 (DAPI, blue; scale bars, 25 μm). (B) Flow cytometry analysis showing that the majority (>80%) of Igf2rECKO mutant feto-placental endothelial cells (FPECs) express YFP (n = 6–14 per genotype). (C) Fetal and placental growth kinetics in Igf2rECKO (Igf2rfl/+; Tek+/Cre) mutants compared with Igf2rfl/+ controls (n = 8–28 conceptuses from n = 3–8 L for each developmental stage). (D) Proportion and total numbers of FPEC/Lz measured by flow cytometry (n = 6–14 per group). (E) Representative CD31 staining in E16 Lz (scale bars, 100 μm). (F) Lz growth kinetics: Igf2rECKO (n = 8–16 conceptuses per group). (G) IGF2 levels (ng/mL) in plasma at E16 (n = 9 per group). (H) Model summarizing the proposed actions of fetus-, endothelial-, and trophoblast-derived IGF2. For all graphs, data are presented as averages or individual values and error bars represent SD in (B), (D), and (G), or 95% CI in (C) and (F). N.S.— not significant; p < 0.05; ∗∗p < 0.01; ∗∗∗p < 0.001 calculated by two-way ANOVA tests in (B) and (D), mixed effects model in (C) and (F) and Mann-Whitney tests in (G). See also Figure S7 and Video S1.

References

    1. Angiolillo A.L., Sgadari C., Taub D.D., Liao F., Farber J.M., Maheshwari S., Kleinman H.K., Reaman G.H., Tosato G. Human interferon-inducible protein 10 is a potent inhibitor of angiogenesis in vivo. J. Exp. Med. 1995;182:155–162. doi: 10.1084/jem.182.1.155. - DOI - PMC - PubMed
    1. Angiolini E., Coan P.M., Sandovici I., Iwajomo O.H., Peck G., Burton G.J., Sibley C.P., Reik W., Fowden A.L., Constância M. Developmental adaptations to increased fetal nutrient demand in mouse genetic models of Igf2-mediated overgrowth. FASEB J. 2011;25:1737–1745. doi: 10.1096/fj.10-175273. - DOI - PubMed
    1. Aoki A., Shiozaki A., Sameshima A., Higashimoto K., Soejima H., Saito S. Beckwith-Wiedemann syndrome with placental chorangioma due to H19-differentially methylated region hypermethylation: a case report. J. Obstet. Gynaecol. Res. 2011;37:1872–1876. doi: 10.1111/j.1447-0756.2011.01654.x. - DOI - PubMed
    1. Aplin J.D., Myers J.E., Timms K., Westwood M. Tracking placental development in health and disease. Nat. Rev. Endocrinol. 2020;16:479–494. doi: 10.1038/s41574-020-0372-6. - DOI - PubMed
    1. Armes J.E., McGown I., Williams M., Broomfield A., Gough K., Lehane F., Lourie R. The placenta in Beckwith-Wiedemann syndrome: genotype-phenotype associations, excessive extravillous trophoblast and placental mesenchymal dysplasia. Pathology. 2012;44:519–527. doi: 10.1097/PAT.0b013e3283559c94. - DOI - PubMed

Publication types

MeSH terms

LinkOut - more resources