. 2022 Mar:111:44-53.
doi: 10.1016/j.neurobiolaging.2021.11.004. Epub 2021 Nov 20.

Association of entorhinal cortical tau deposition and hippocampal synaptic density in older individuals with normal cognition and early Alzheimer's disease

Affiliations

Association of entorhinal cortical tau deposition and hippocampal synaptic density in older individuals with normal cognition and early Alzheimer's disease

Adam P Mecca et al. Neurobiol Aging. 2022 Mar.

Abstract

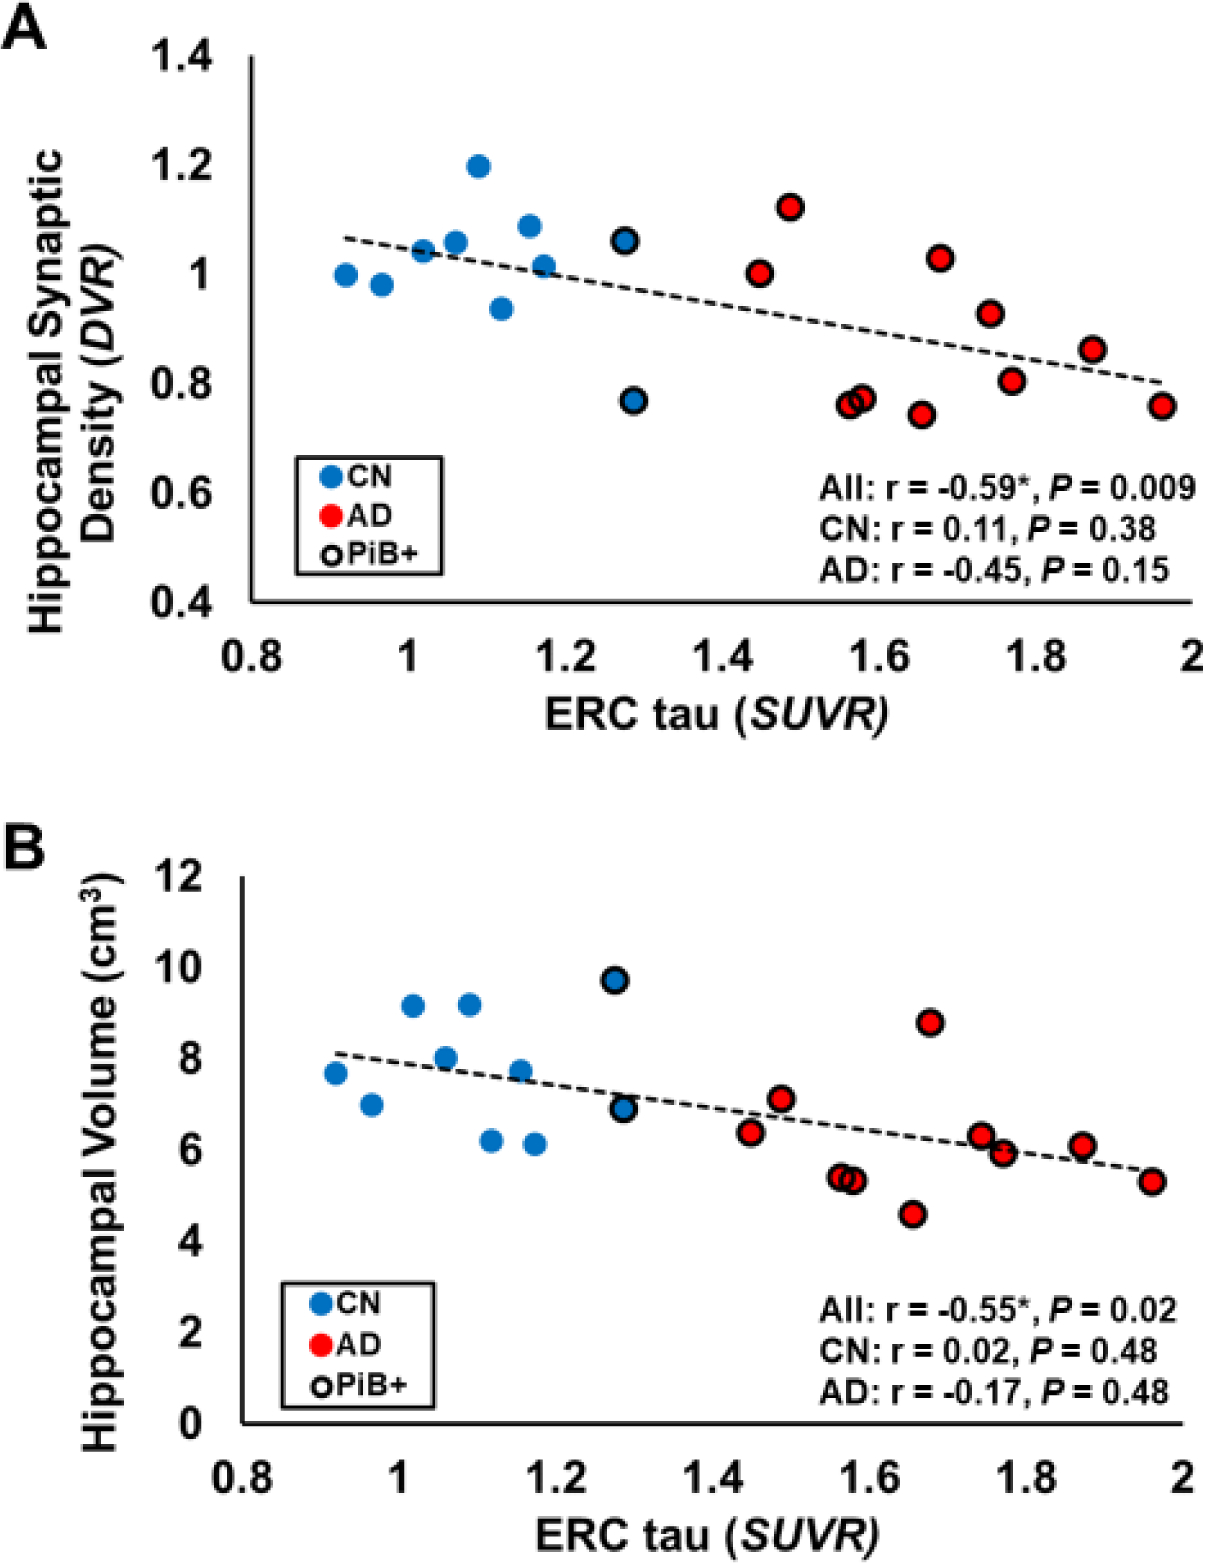
Sites of early neuropathologic change provide important clues regarding the initial clinical features of Alzheimer's disease (AD). We have shown significant reductions in hippocampal synaptic density in participants with AD, consistent with the early degeneration of entorhinal cortical (ERC) cells that project to hippocampus via the perforant path. In this study, [11C]UCB-J binding to synaptic vesicle glycoprotein 2A (SV2A) and [18F]flortaucipir binding to tau were measured via PET in 10 participants with AD (5 mild cognitive impairment, 5 mild dementia) and 10 cognitively normal participants. In the overall sample, ERC tau was inversely associated with hippocampal synaptic density (r = -0.59, p = 0.009). After correction for partial volume effects, the association of ERC tau with hippocampal synaptic density was stronger in the overall sample (r = -0.61, p = 0.007) and in the AD group where the effect size was large, but not statistically significant (r = -0.58, p = 0.06). This inverse association of ERC tau and hippocampal synaptic density may reflect synaptic failure due to tau pathology in ERC neurons projecting to the hippocampus.

Keywords: Alzheimer's disease; PET; SV2A; Synaptic density; Tau; [(11)C]UCB-J; [(18)F]Flortaucipir.


Figures

Figure 1.
Figure 1.. Association between ERC tau and hippocampal synaptic density or hippocampal volume.
Higher ERC tau [18F]flortaucipir (SUVR) was significantly associated with (A) lower hippocampal synaptic density ([11C]UCB-J DVR) and (B) hippocampal volume in the overall sample that included both cognitively normal (n = 10) and Alzheimer’s disease (n = 10) participants. The figure displays a linear regression line. Values of r and P are for Pearson’s correlations with false discovery rate correction for 3 comparisons and one-tailed hypothesis testing. Amyloid positive individuals (PiB+) are indicated by a black circle border. * P<0.05 for Pearson’s correlation. Abbreviations: ERC, entorhinal cortical; SUVR, standard uptake value ratio of [18F]flortaucipir calculated with an inferior cerebellum reference region; DVR, distribution volume ratio of [11C]UCB-J calculated with a whole cerebellum reference region; All, all participants; CN, cognitively normal; AD, Alzheimer’s disease; PiB, [11C]Pittsburg h Compound B.
Figure 2.
Figure 2.. Comparison of tau deposition and synaptic density in AD and CN groups.
(A) Tau deposition was measured using [18F]flortaucipir SUVR and (B) synaptic density with [11C]UCB-J DVR. * P<0.05, P<0.001, P<0.0001 for post hoc t-tests comparing AD (n=10) and CN (n=10) groups after false discovery rate correction for multiple comparisons. Dots represent the SUVR or DVR for each participant. Error bars represent standard deviations. (C) The effect sizes (Cohen’s d) to detect a group difference (AD < CN) in each brain region were plotted for tau deposition and synaptic density. * P<0.05 for Pearson’s correlation. Dots represent 70 brain regions that comprise the Braak stage regions form A and B. Colors represent Braak stages at which each brain region is typically first affected by tau pathology. Abbreviations: SUVR, standard uptake value ratio of [18F]flortaucipir calculated with an inferior cerebellum reference region; DVR, distribution volume ratio of [11C]UCB-J calculated with a whole cerebellum reference region; CN, cognitively normal, AD, Alzheimer’s disease; Inf/Mid Temporal, inferior and middle temporal gyri.
Figure 3.
Figure 3.. Average tau and synaptic density in AD and CN groups.
Coronal sections of average parametric images of tau deposition ([18F]flortaucipir SUVR) in 10 CN (A) and 10 AD (B) participants and of synaptic density ([11C]UCB-J DVR) in 10 CN (C) and 10 AD (D) participants. Average images were created after co-registration to a common MNI template. The average parametric PET scans are displayed in pseudocolor and overlaid on the MNI template T1 MRI. Higher tau deposition and lower synaptic density are apparent in AD compared to CN participants. Abbreviations: SUVR, standard uptake value ratio of [18F]flortaucipir calculated with an inferior cerebellum reference region; DVR, distribution volume ratio of [11C]UCB-J calculated with a whole cerebellum reference region.
Figure 4.
Figure 4.. Correlation maps of ERC tau deposition and synaptic density in all regions.
Pearson’s r was calculated for the correlation between ERC tau deposition ([18F]flortaucipir SUVR) and synaptic density ([11C]UCB-J DVR) in all FreeSurfer regions for (A) all participants (n = 20), (B) cognitively normal participants (n = 10), and (C) participants with Alzheimer’s disease (n = 10). Similar correlation maps were also produced with partial volume correction of both [18F]flortaucipir and [11C]UCB-J PET scans (D, E, and F). The color scale represents Pearson’s r, which is displayed only for regions that had an uncorrected P < 0.05. Abbreviations: PVC, partial volume correction.

References

    1. Albert MS, DeKosky ST, Dickson D, Dubois B, Feldman HH, Fox NC, Gamst A, Holtzman DM, Jagust WJ, Petersen RC, Snyder PJ, Carrillo MC, Thies B, Phelps CH 2011. The diagnosis of mild cognitive impairment due to Alzheimer’s disease: recommendations from the National Institute on Aging-Alzheimer’s Association workgroups on diagnostic guidelines for Alzheimer’s disease. Alzheimers Dement 7(3), 270–9. doi:10.1016/j.jalz.2011.03.008. - DOI - PMC - PubMed
    1. Bajjalieh SM, Frantz GD, Weimann JM, McConnell SK, Scheller RH 1994. Differential expression of synaptic vesicle protein 2 (SV2) isoforms. J Neurosci 14(9), 5223–35. - PMC - PubMed
    1. Bajjalieh SM, Peterson K, Linial M, Scheller RH 1993. Brain contains two forms of synaptic vesicle protein 2. Proc Natl Acad Sci U S A 90(6), 2150–4. - PMC - PubMed
    1. Baker SL, Maass A, Jagust WJ 2017. Considerations and code for partial volume correcting [(18)F]-AV-1451 tau PET data. Data Brief 15, 648–57. doi:10.1016/j.dib.2017.10.024. - DOI - PMC - PubMed
    1. Bastin C, Bahri MA, Meyer F, Manard M, Delhaye E, Plenevaux A, Becker G, Seret A, Mella C, Giacomelli F, Degueldre C, Balteau E, Luxen A, Salmon E 2019. In vivo imaging of synaptic loss in Alzheimer’s disease with [18F]UCB-H positron emission tomography. Eur J Nucl Med Mol Imaging. doi:10.1007/s00259-019-04461-x. - DOI - PubMed

Publication types