. 2022 Jan;15(1):e009101.
doi: 10.1161/CIRCHEARTFAILURE.121.009101. Epub 2021 Dec 29.

Invasive Right Ventricular Pressure-Volume Analysis: Basic Principles, Clinical Applications, and Practical Recommendations

Affiliations

Invasive Right Ventricular Pressure-Volume Analysis: Basic Principles, Clinical Applications, and Practical Recommendations

Michael I Brener et al. Circ Heart Fail. 2022 Jan.

Abstract

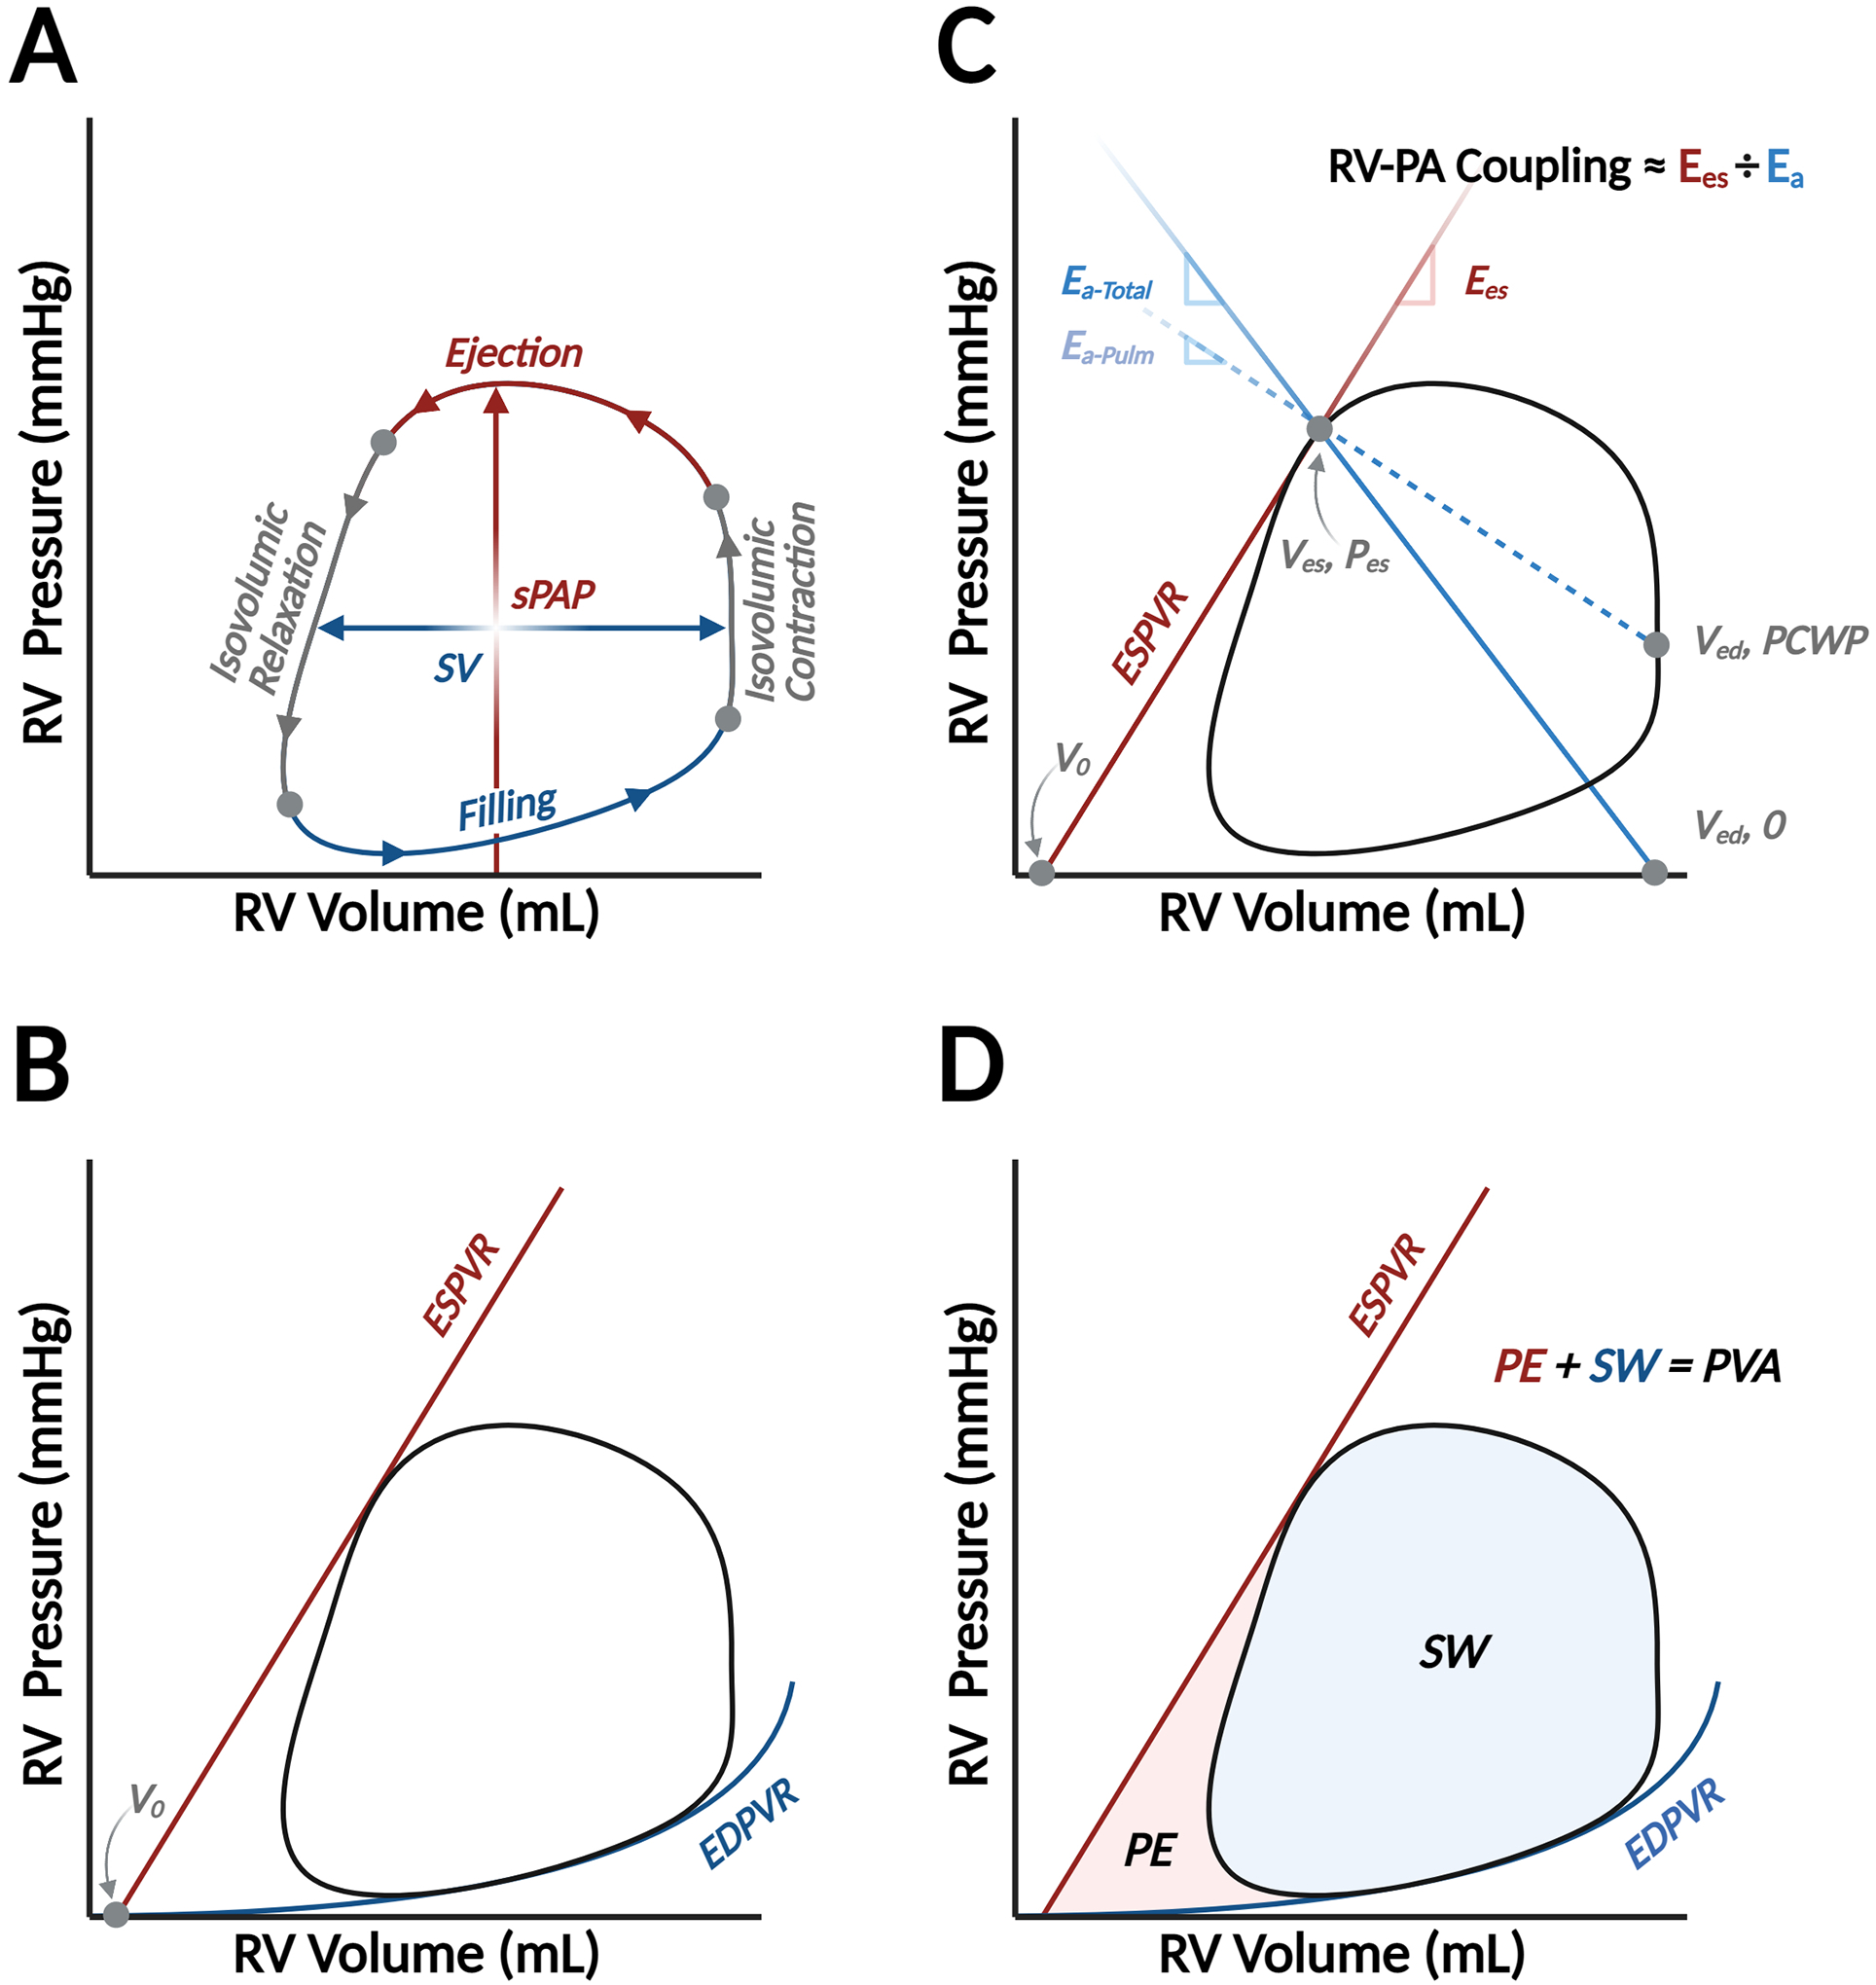
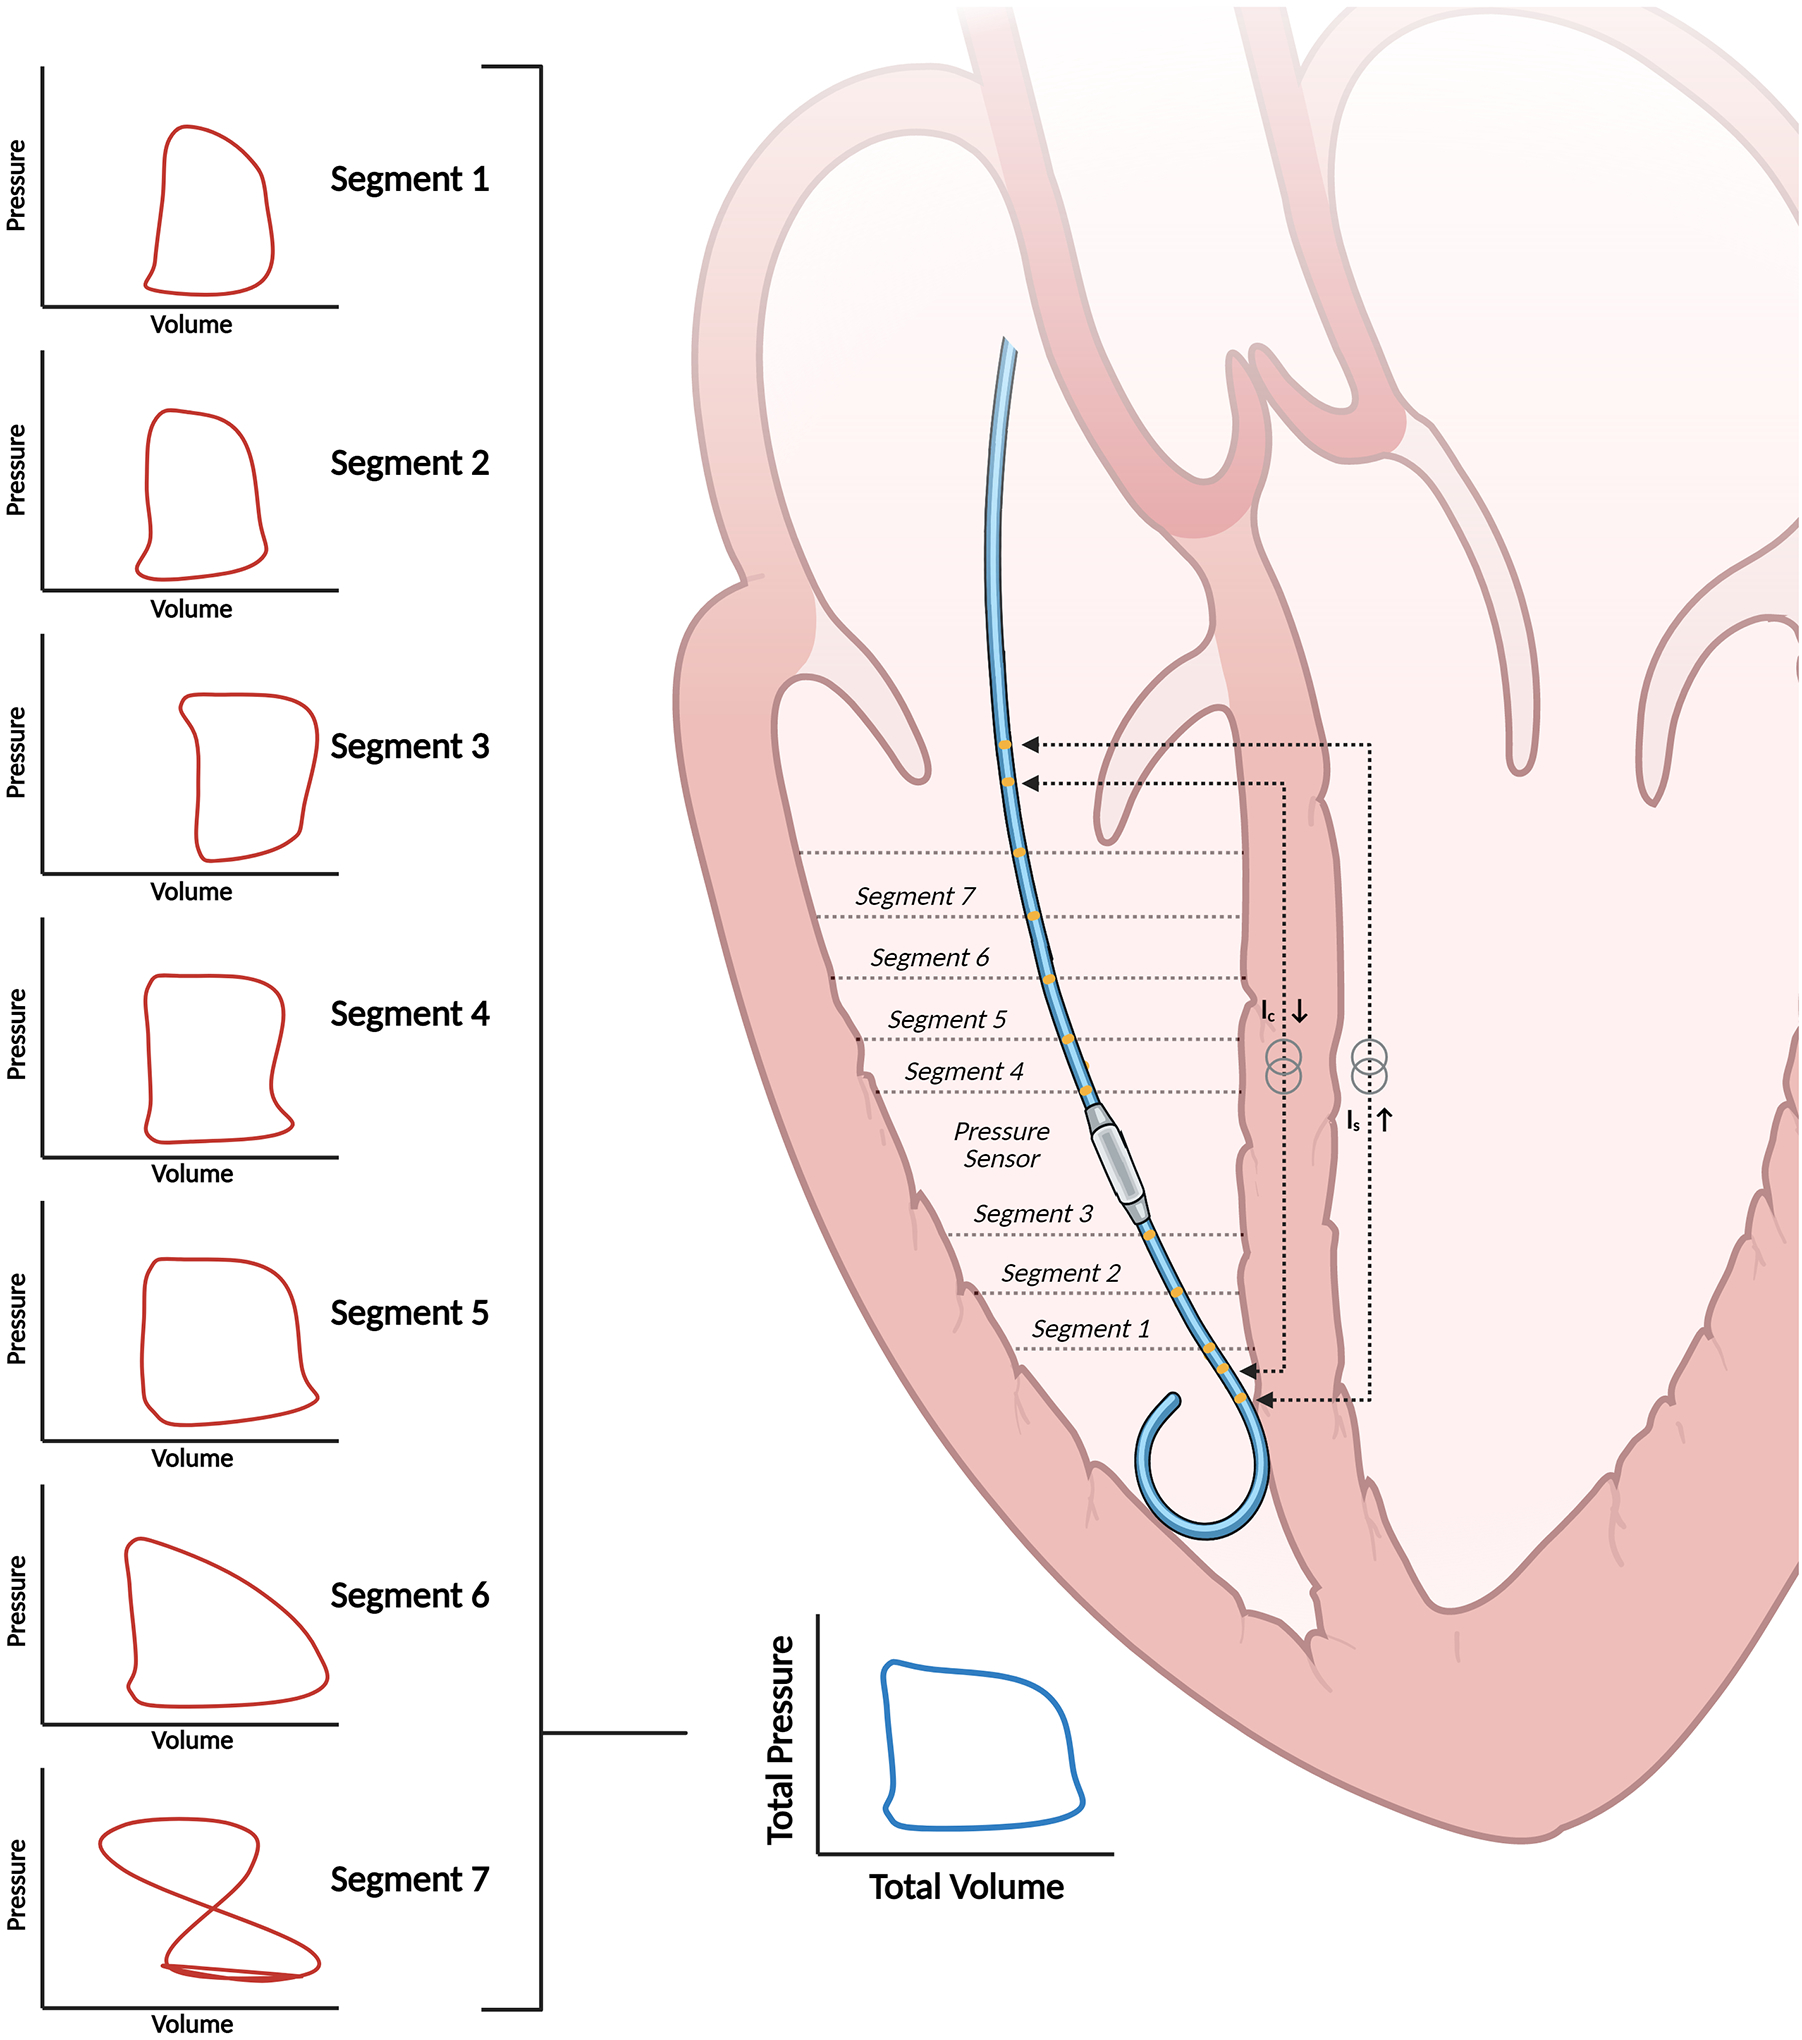
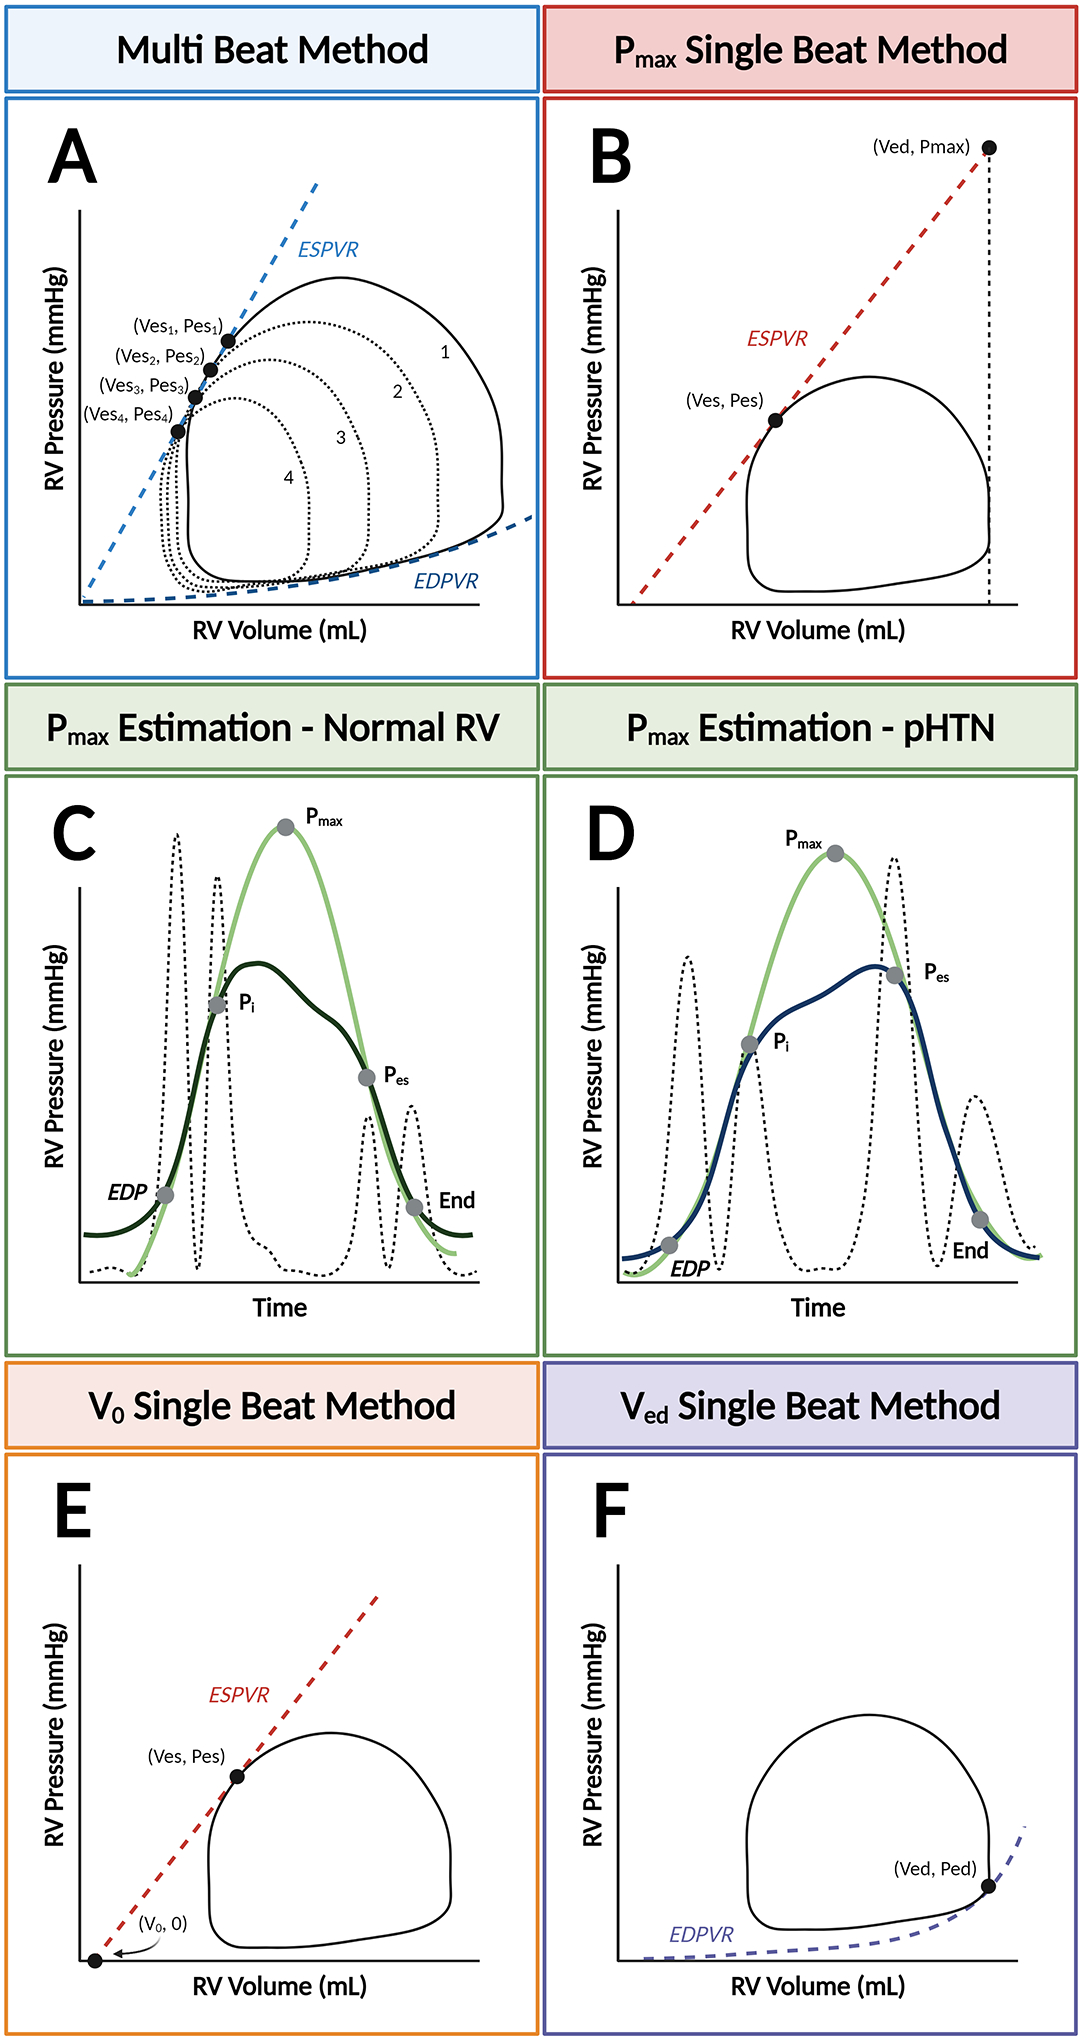
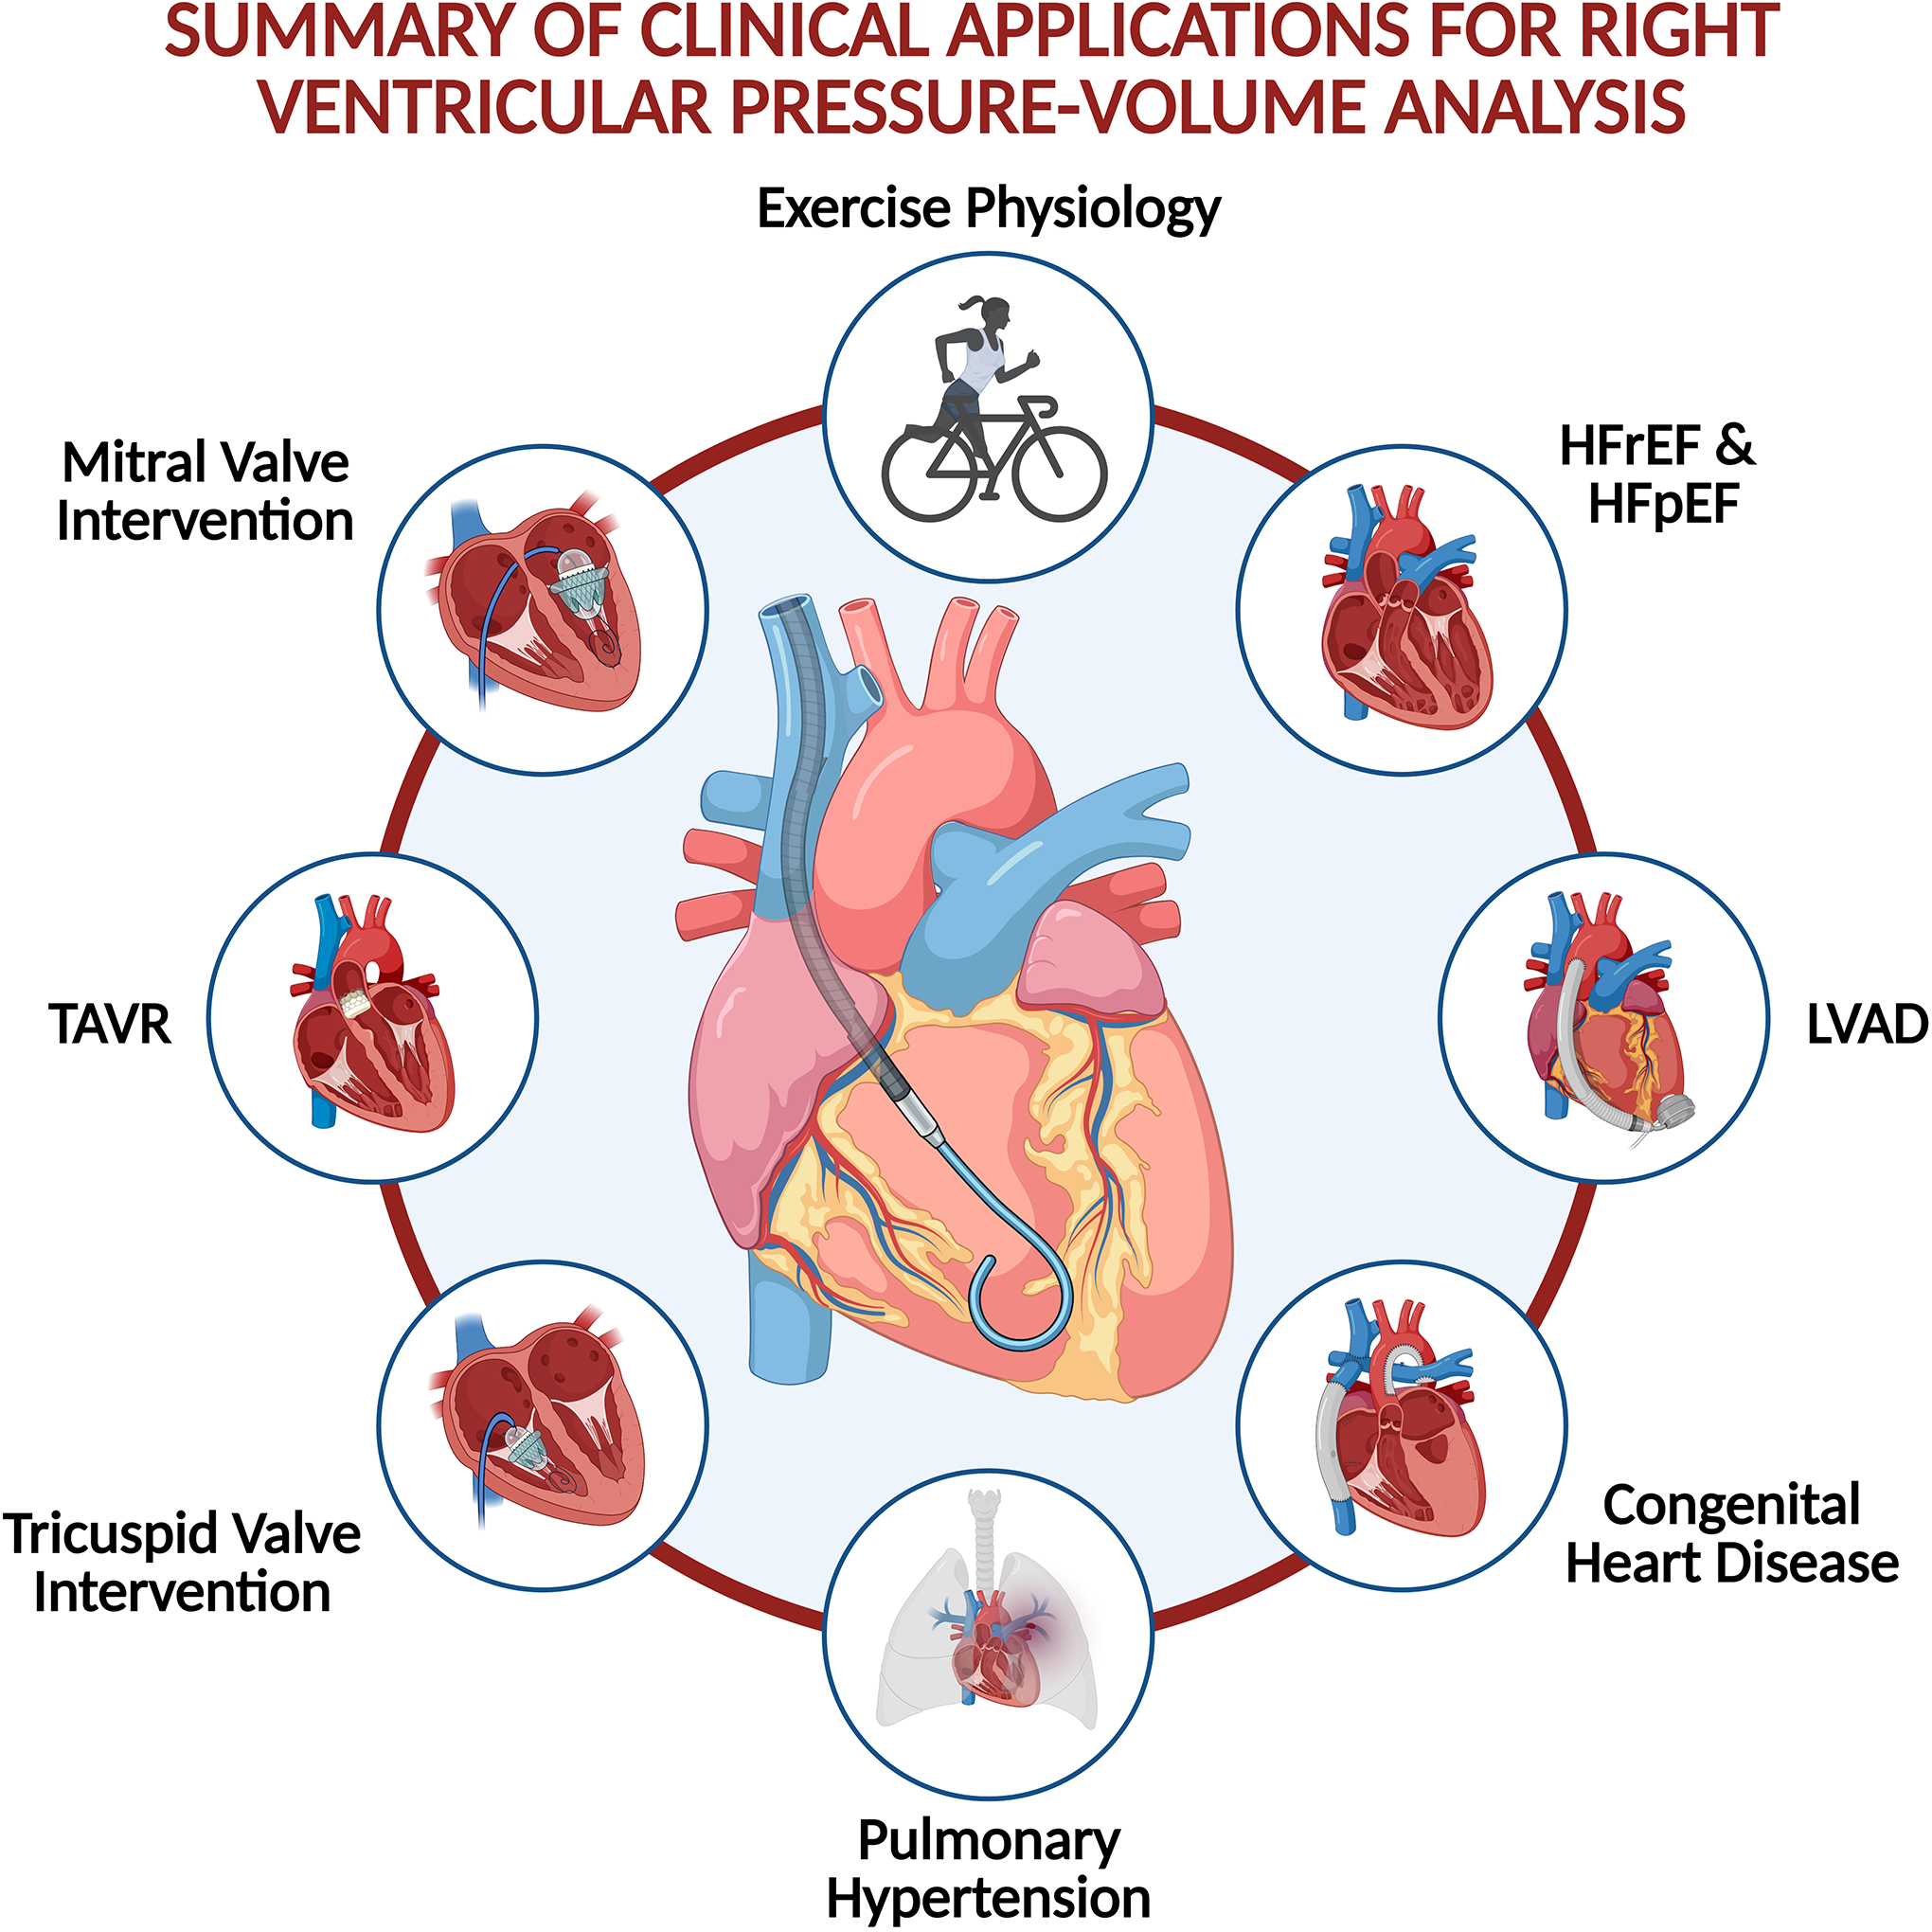
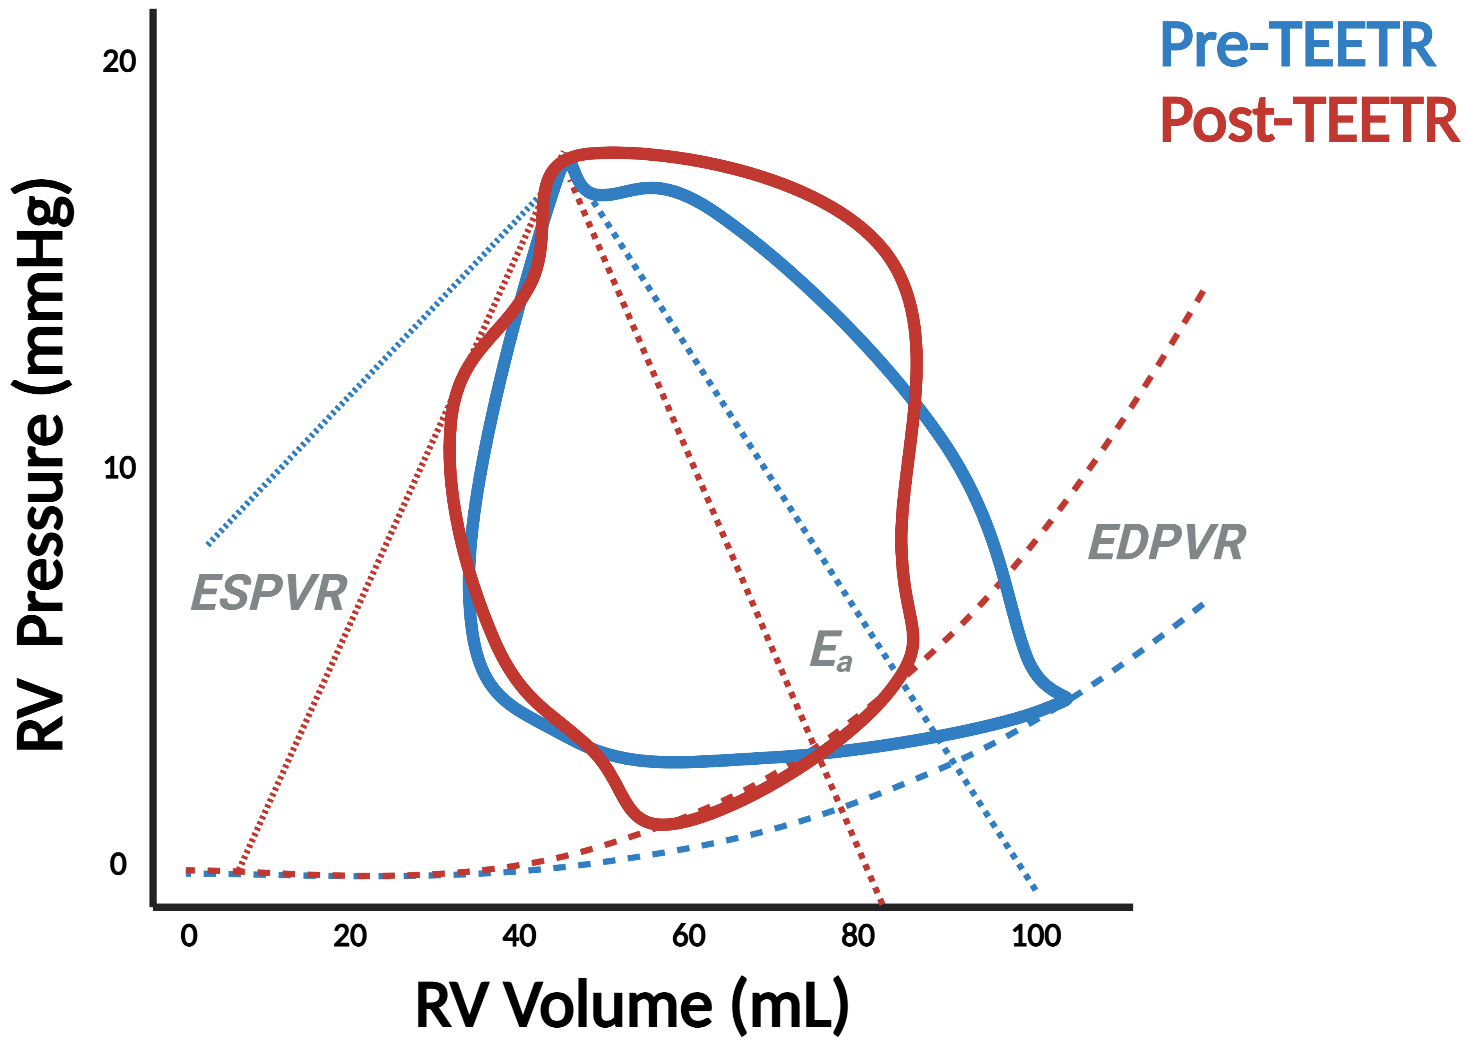
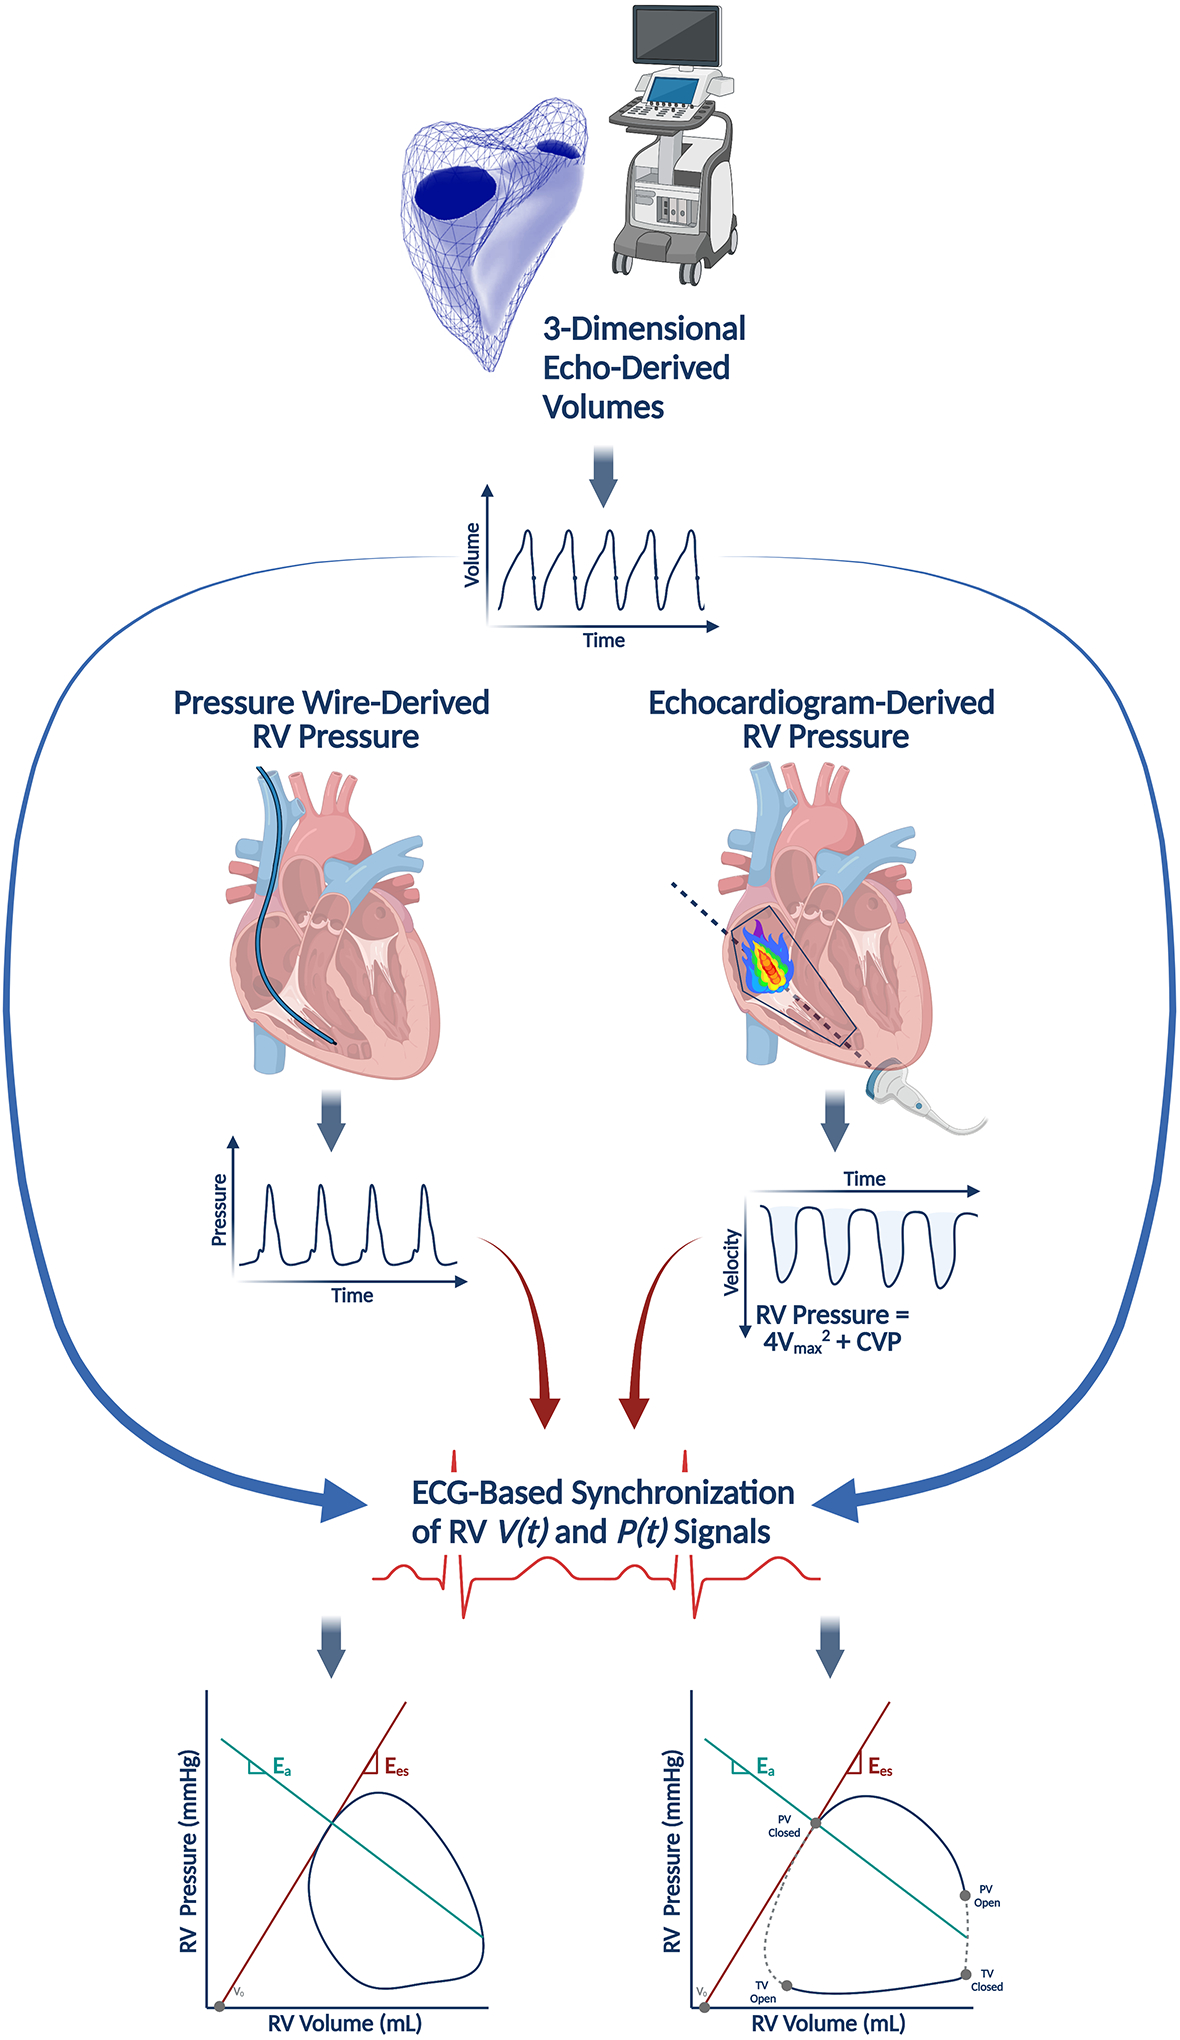
Right ventricular pressure-volume (PV) analysis characterizes ventricular systolic and diastolic properties independent of loading conditions like volume status and afterload. While long-considered the gold-standard method for quantifying myocardial chamber performance, it was traditionally only performed in highly specialized research settings. With recent advances in catheter technology and more sophisticated approaches to analyze PV data, it is now more commonly used in a variety of clinical and research settings. Herein, we review the basic techniques for PV loop measurement, analysis, and interpretation with the aim of providing readers with a deeper understanding of the strengths and limitations of PV analysis. In the second half of the review, we detail key scenarios in which right ventricular PV analysis has influenced our understanding of clinically relevant topics and where the technique can be applied to resolve additional areas of uncertainty. All told, PV analysis has an important role in advancing our understanding of right ventricular physiology and its contribution to cardiovascular function in health and disease.

Keywords: heart failure; hemodynamics; pulmonary circulation; ventricular function, right.


Figures

Figure 1.
Figure 1.. Basic elements of the right ventricular pressure-volume diagram.
The pressure-volume (PV) diagram summarizes hemodynamic changes during one cardiac cycle, which is divided into four phases: ventricular filling, isovolumic contraction, ejection, and isovolumic relaxation (Panel A). The width of the loop represents ventricular stroke volume (SV), and the peak pressure is right ventricular or pulmonary artery systolic pressure (sPAP). Two fundamental relationships create boundaries for the PV loop: the end-systolic PV relationship, which describes ventricular contractile properties, and the end-diastolic PV relationship (EDPVR), which describes ventricular diastolic function (Panel B). ESPVR is reasonably linear and connects the end-systolic PV coordinate with the volume-axis intercept (V0), or the unstressed blood volume of the ventricle. The PV loop is also a valuable platform to relate vascular properties. Afterload can be characterized by effective arterial elastance, which is a lumped parameter (Ea-Total) reflecting the influence of downstream pressure (i.e., pulmonary capillary wedge pressure, PCWP) and intrinsic properties of the pulmonary vasculature (Ea-Pulm). Ea-Pulm is reflected by the slope of the line connecting the end-systolic PV coordinate with (Ved, PCWP), while Ea-Total connects the end-systolic coordinates and the volume-axis intercept at end-diastolic volume (Ved, 0). Relating systolic function, summarized by the slope of ESPVR (also known as end-systolic elastance, Ees), to Ea is the foundation of a concept called right ventricular (RV)-pulmonary arterial (PA) coupling (Panel C). Finally, myocardial energetics can also be inferred from the PV diagram. The space within the loop is stroke work (SW) and the potential space bound within the ESPVR and EDPVR but outside the loop is the potential energy (PE). The sum of SW and PE is PV area (PVA), which is linearly related to myocardial oxygen consumption (Panel D).
Figure 2.
Figure 2.. Conductance volumetry for pressure-volume analysis in the right ventricle.
The catheter estimates ventricular volumes through the principle of conductance volumetry. Volumes from segments one through six in this case are used to calculate overall ventricular volume because the loop in segment seven is not counterclockwise, indicating that the electrode is extra-ventricular.
Figure 3.
Figure 3.. Multi- and single-beat methods and notable limitations for estimating end-systolic pressure-volume relationships.
The end-systolic pressure-volume relationship (ESPVR) can be modeled with two different methods: the multi-beat method (Panel A), which plots ESPVR by connecting serial end-systolic PV coordinates, or the single-beat method, which extrapolates either the maximal isovolumic pressure (Pmax) (Panel B) or the volume-axis intercept (V0). Pmax is represented by the peak of a curve fitted to discrete points during the cardiac cycle from the right ventricular (RV) pressure waveform. Determination of these timepoints can be standardized by taking the second derivative of RV pressure squared (hatched line). With this method, the “up interval” for Pmax prediction extends from end-diastolic pressure (EDP) to the first major inflection point (Pi), and the “down interval” from Pes to the estimated end of isovolumic relaxation. This method is validated in patients with normal RV pressures (Panel C) and pulmonary hypertension (Panel D). Alternatively, determination of Vo can be used with the single-beat method (Panel E). Finally, the single-beat method for determining the end-diastolic PV relationship (EDPVR) relies on of the end-diastolic coordinate (Ved, Ped) (Panel F).
Figure 4.
Figure 4.. Summary of clinical applications for right ventricular pressure-volume analysis.
Right ventricular (RV) pressure-volume analysis can help characterize RV physiology in a variety of conditions and clinical settings.
Figure 5.
Figure 5.. Changes in the right ventricular pressure-volume loop contour in patients with vs. without pulmonary hypertension.
Characteristic triangular (Panel A), quadratic (Panel B), trapezoid (Panel C), and notched (Panel D) RV PV loop morphologies, which are associated with varying differentials between pulmonary artery (PA) beginning systolic pressure (BSP) and end-systolic pressure (ESP). Adapted from Richter MJ, et al. Right ventricular pressure-volume loop shape and systolic pressure change in pulmonary hypertension. Am J Physiol Lung Cell Mol Physiol 2021;320(5):L715-l725.
Figure 6.
Figure 6.. Changes in right ventricular properties with increasing left ventricular assist device speed.
Changes in systolic and diastolic function result in decreased contractile function and increased ventricular compliance, respectively. These changes were not reproduced uniformly in a series of four patients during a left ventricular assist device speed optimization test. Adapted from Brener MI, et al. Right Ventricular Pressure-Volume Analysis During Left Ventricular Assist Device Speed Optimization Studies: Insights Into Interventricular Interactions and Right Ventricular Failure. J Card Fail. 2021;27:991–1001.
Figure 7.
Figure 7.. Right ventricular pressure-volume loops before and after transcatheter valvular intervention.
Pressure-volume (PV) analysis demonstrates significant changes in right ventricular physiology before and after transcatheter aortic valve replacement (TAVR) (Panel A) as well as transcatheter edge-to-edge repair (TEER) in the mitral (Panel B) and tricuspid (TEETR) (Panel C) positions. ESPVR = end-systolic PV relationship, EDPVR = end-diastolic PV relationship, Ees = end-systolic elastance, Ea = effective arterial elastance.
Figure 8.
Figure 8.. Non-invasive derivation of right ventricular pressure-volume loops.
Pressure-volume (PV) loops can be reconstructed without a conductance catheter by synchronizing a volume-time signal (V(t)) from three-dimensional echocardiography with a pressure-time signal (P(t)). The pressure-time signal can be obtained with a pressure wire in the right ventricle (RV) or non-invasively estimated from echocardiograms by measuring the RV systolic pressure from a tricuspid regurgitant jet. Adapted with permission from Richter MJ, et al Eur Heart J Cardiovasc Imaging. 2021 Feb 28. Online ahead of print.

References

    1. Sanz J, Sánchez-Quintana D, Bossone E, Bogaard HJ and Naeije R. Anatomy, Function, and Dysfunction of the Right Ventricle: JACC State-of-the-Art Review. Journal of the American College of Cardiology. 2019;73:1463–1482. - PubMed
    1. Brener MI, Burkhoff D and Sunagawa K. Effective Arterial Elastance in the Pulmonary Arterial Circulation: Derivation, Assumptions, and Clinical Applications. Circ Heart Fail. 2020;13:e006591. - PubMed
    1. Vonk-Noordegraaf A and Westerhof N. Describing right ventricular function. European Respiratory Journal. 2013;41:1419–1423. - PubMed
    1. Bastos MB, Burkhoff D, Maly J, Daemen J, den Uil CA, Ameloot K, Lenzen M, Mahfoud F, Zijlstra F, Schreuder JJ and Van Mieghem NM. Invasive left ventricle pressure-volume analysis: overview and practical clinical implications. Eur Heart J. 2020;41:1286–1297. - PMC - PubMed
    1. Sarraf M, Burkhoff D and Brener MI. First-in-Man 4-Chamber Pressure–Volume Analysis During Transcatheter Aortic Valve Replacement for Bicuspid Aortic Valve Disease. JACC: Case Reports. 2021;3:77–81. - PMC - PubMed

Publication types

MeSH terms