. 2021 Dec 29;18(1):31.
doi: 10.1186/s12014-021-09336-8.

Integration of transcriptome and proteome profiles in placenta accreta reveals trophoblast over-migration as the underlying pathogenesis

Affiliations

Integration of transcriptome and proteome profiles in placenta accreta reveals trophoblast over-migration as the underlying pathogenesis

Na Li et al. Clin Proteomics. .

Abstract

Background: Placenta accreta (PA) is a major cause of maternal morbidity and mortality in modern obstetrics, few studies have explored the underlying molecular mechanisms.

Methods: In our study, transcriptome and proteome profiling were performed in placental tissues from ten participants including five cases each in the PA and control groups to clarify the pathogenesis of PA.

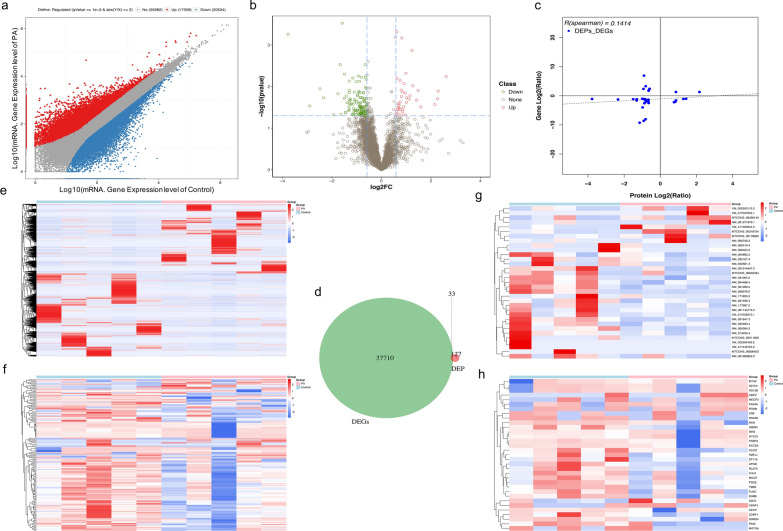
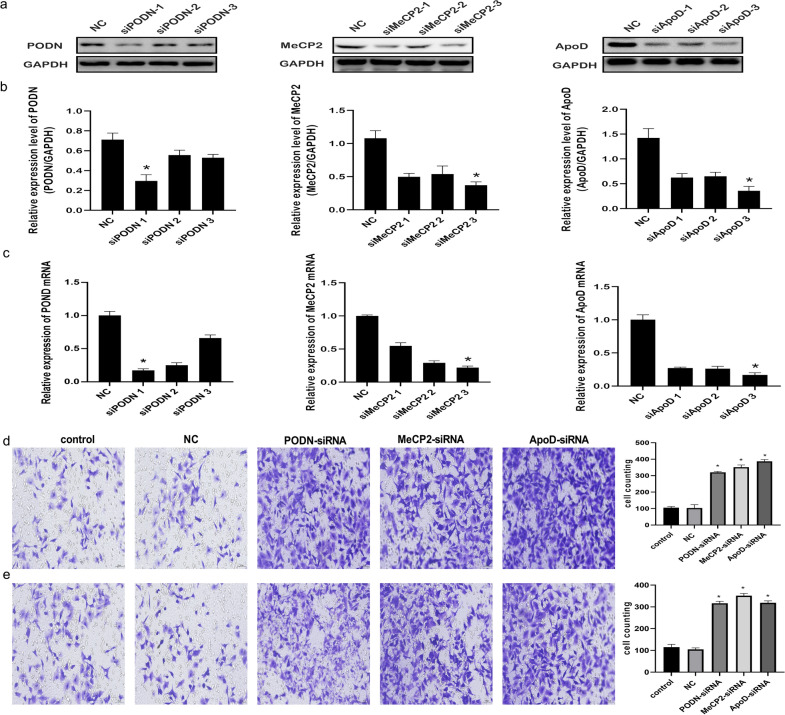
Results: We identified differential expression of 37,743 transcripts and 160 proteins between the PA and control groups with an overlap rate of 0.09%. The 33 most-significant transcripts and proteins were found and further screened and analyzed. Adhesion-related signature, chemotaxis related signatures and immune related signature were found in the PA group and played a certain role. Sum up two points, three significant indicators, methyl-CpG-binding domain protein 2 (MeCP2), podocin (PODN), and apolipoprotein D (ApoD), which participate in "negative regulation of cell migration", were downregulated at the mRNA and protein levels in PA group. Furthermore, transwell migration and invasion assay of HTR-8/SVneo cell indicated the all of them impaired the migration and invasion of trophoblast.

Conclusion: A poor correlation was observed between the transcriptome and proteome data and MeCP2, PODN, and ApoD decreased in transcriptome and proteome profiling, resulting in increased migration of trophoblasts in the PA group, which clarify the mechanism of PA and might be the biomarkers or therapy targets in the future.

Keywords: Migration; Placenta accreta; Proteome; Transcriptome; Trophoblast.


Conflict of interest statement

The authors have declared that no competing interest exists.

Figures

Fig. 1
Fig. 1
Basic profiling of the transcriptome and proteome. The PCA results showed the placenta accreta and control groups were generally distributed in different directions based on the transcriptome (a) and proteome (b), red dots denote PA group, green dots denote control group; c Venn diagram to reflect the 4.65% overlap degree of transcripts and proteins; d 2D plot of the correlation between the transcriptome and proteome which showed the correlation coefficient was 0.03, the x-axis is the protein expression level, and the y-axis is the gene expression level, black dots denote NDEPs_NDEGs, green dots denote NDEPs_DEGs, red dots denote DEPs_NDEGs, and bule dots denote DEPs_DEGs. PA: placenta accreta; NDEGs: not differentially expressed genes; NDEPs: not differentially expressed proteins; DEGs: differentially expressed genes; DEPs: differentially expressed proteins; PCA: principal components analysis
Fig. 2
Fig. 2
The most-significant proteins in the placenta accreta group. a Plot showing expression of transcripts, red triangles denote up-regulated genes, blue squares denote down-regulated genes, and grey dots denote non-regulated genes; b volcano plot of proteins, red dots denote up-regulated proteins, green dots denote down-regulated proteins, and grey dots denote non-regulated proteins, transverse dashed line denotes “−log10(0.05)”, vertical dashed line denotes “log2(0.67)” and “log2(1.5)” (from left to right); c 2D plot of the correlation between the DEGs and DEPs which showed the correlation coefficient was 0.14 (dashed line), the x-axis is the protein expression level, and the y-axis is the gene expression level; d Venn diagram to reflect the 0.09% overlap degree and 33 overlapping genes between the transcripts and proteins. Heatmaps of 37,743 transcripts (e) and 160 proteins (f), and heatmaps of 33 overlapping transcripts (g) and 33 proteins (h). FC: fold change; DEGs: differentially expressed genes; DEPs: differentially expressed proteins; PA: placenta accreta
Fig. 3
Fig. 3
The placenta accreta-mediated enhanced adhesion-related terms. GO analysis based on top 500 transcripts showing the top 20 GO terms which revealed that blood vessel development and cell adhesion-related terms were most enriched (a) and significant proteins which showed the cell cycle and differentiation, chemotaxis and immune-related terms were enriched (b). KEGG analysis based on the top 500 transcripts showing the top 20 KEGG pathway (c) and significant proteins (d) which revealed that the focal adhesion-related pathway was enhanced in the placenta accreta group. GO analysis based on the 33 most-significant proteins showing increased cell migration pathway (e). FC: fold change
Fig. 4
Fig. 4
Analysis of MeCP2, PODN, and ApoD expression in placental tissues. a mRNA expression showed that MeCP2, PODN, and ApoD were downregulated in the placenta accreta group by qRT-PCR; b, c protein levels showed that MeCP2, PODN, and ApoD were downregulated in the placenta accreta group based on western blot and the statistical results. All data are presented as mean ± standard deviation. PA: placenta accreta; MeCP2: Methyl-CpG-binding domain protein 2; ApoD: Apolipoprotein D; PODN: Podocan. *P < 0.05, **P < 0.01, ***P < 0.001
Fig. 5
Fig. 5
MeCP2, PODN and ApoD downregulation promotes the migration and invasion of HTR-8/SVneo cells. a, b Levels of MeCP2, PODN and ApoD proteins detected after transfection of HTR-8/SVneo cells with siRNA for MeCP2, PODN and ApoD, respectively. c MeCP2, PODN and ApoD mRNA expression examined after 48-h transfection. d, e Transwell migration and invasion assays showing higher numbers of migrated and invaded cells in the si-MeCP2, si-PODN and si-ApoD group than in the NC group (×200). All data are presented as the mean ± standard deviation. NC: negative control; MeCP2: Methyl-CpG-binding domain protein 2; ApoD: Apolipoprotein D; PODN: Podocan. *P < 0.05

Similar articles

Cited by

References

    1. Jauniaux E, Collins S, Burton GJ. Placenta accreta spectrum: pathophysiology and evidence-based anatomy for prenatal ultrasound imaging. Am J Obstet Gynecol. 2018;218(1):75–87. - PubMed
    1. Jauniaux E, Jurkovic D. Placenta accreta: pathogenesis of a 20th century iatrogenic uterine disease. Placenta. 2012;33(4):244–251. - PubMed
    1. Thurn L, Lindqvist PG, Jakobsson M, Colmorn LB, Klungsoyr K, Bjarnadóttir RI, et al. Abnormally invasive placenta-prevalence, risk factors and antenatal suspicion: results from a large population-based pregnancy cohort study in the Nordic countries. BJOG. 2016;123(8):1348–55. - PubMed
    1. Yang T, Li N, Qiao C, Liu C. Development of a novel nomogram for predicting placenta accreta in patients with scarred uterus: a retrospective cohort study. Front Med. 2019;6:289. - PMC - PubMed
    1. Qi WH, Zheng MY, Li C, Xu L, Xu JE. Screening of differential proteins of placenta tissues in patients with pre-eclampsia by iTRAQ proteomics techniques. Minerva Med. 2017;108(5):389–395. - PubMed

LinkOut - more resources