. 2022 Jul;62(7):905-917.
doi: 10.1002/jcph.2021. Epub 2022 Feb 9.

Population Pharmacokinetics and Exposure-Response Relationships of Astegolimab in Patients With Severe Asthma

Affiliations

Population Pharmacokinetics and Exposure-Response Relationships of Astegolimab in Patients With Severe Asthma

Naoki Kotani et al. J Clin Pharmacol. 2022 Jul.

Abstract

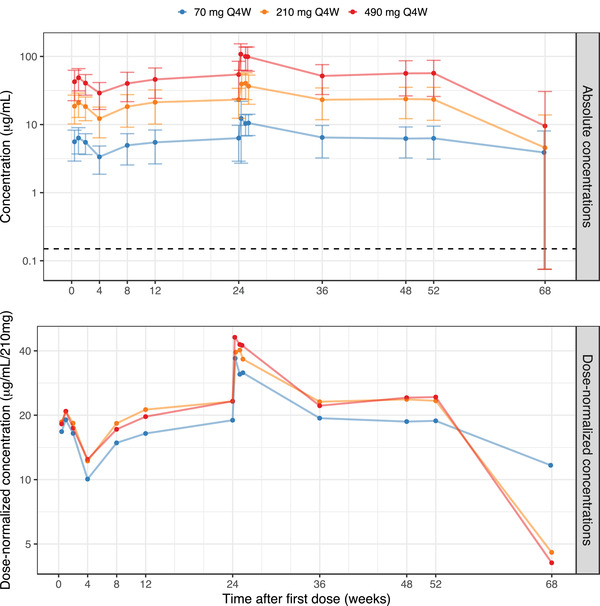
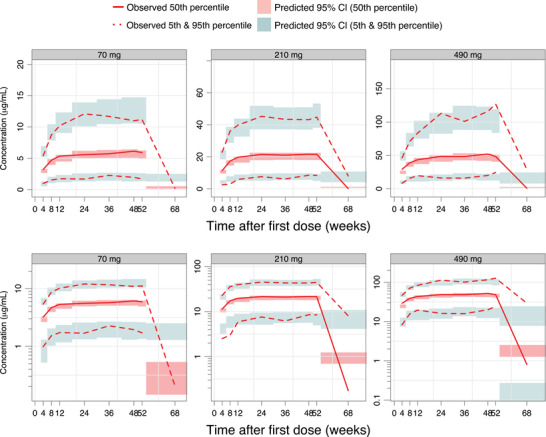
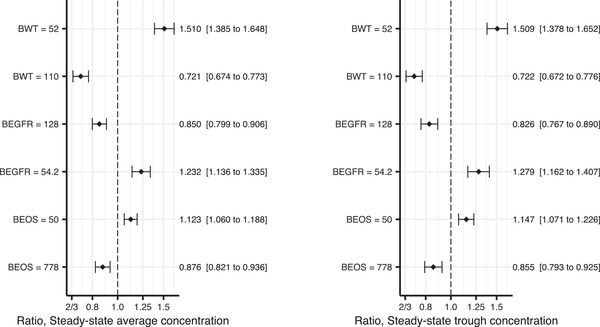
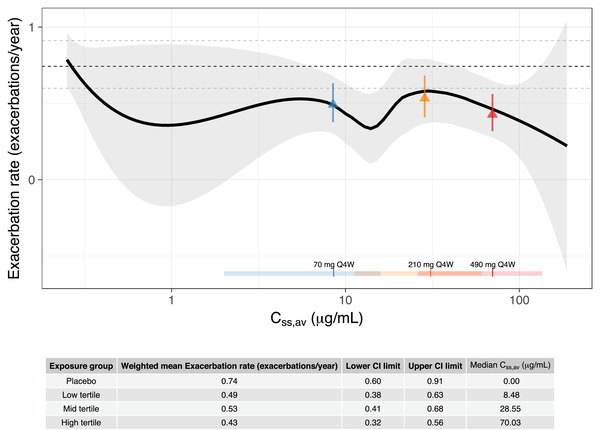
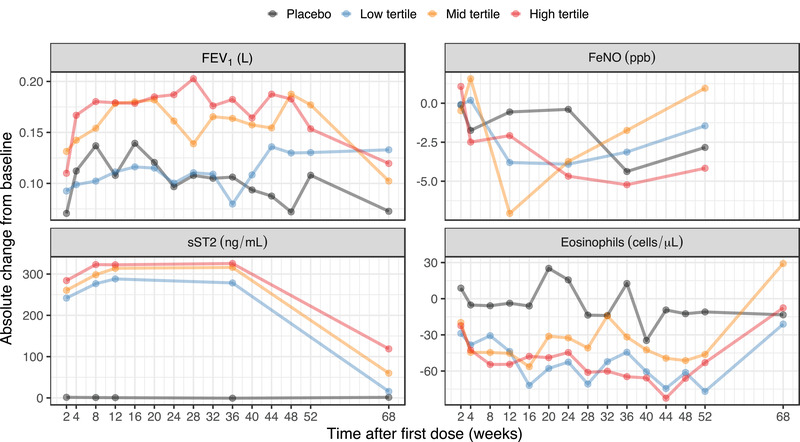
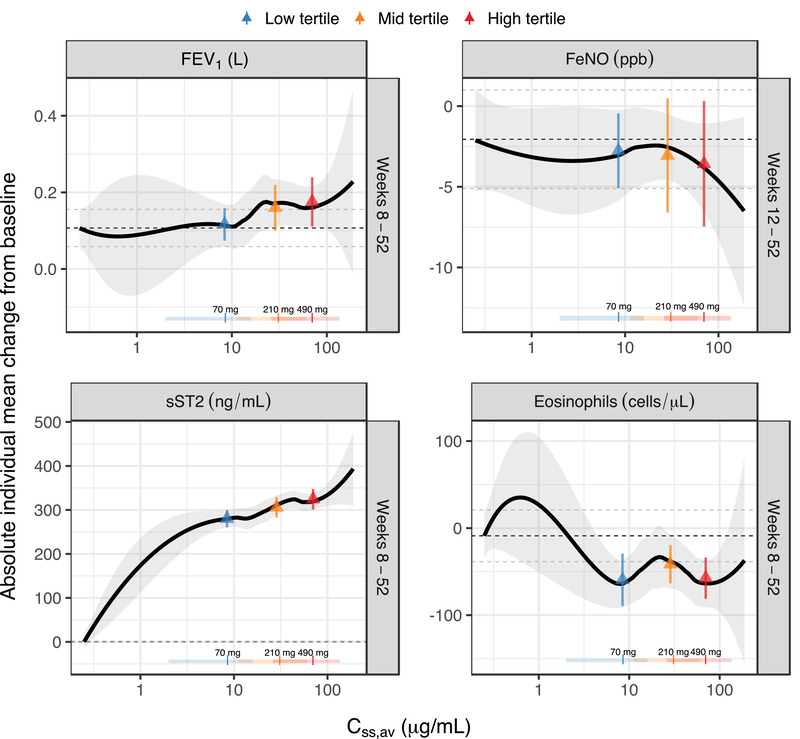
Astegolimab is a fully human immunoglobulin G2 monoclonal antibody that binds to the ST2 receptor and blocks the interleukin-33 signaling. It was evaluated in patients with uncontrolled severe asthma in the phase 2b study (Zenyatta) at doses of 70, 210, and 490 mg subcutaneously every 4 weeks for 52 weeks. This work aimed to characterize astegolimab pharmacokinetics, identify influential covariates contributing to its interindividual variability, and make a descriptive assessment of the exposure-response relationships. A population pharmacokinetic model was developed using data from 368 patients in the Zenyatta study. Predicted average steady-state concentration was used in the subsequent exposure-response analyses, which evaluated efficacy (asthma exacerbation rate) and biomarker end points including forced expiratory volume in 1 second, fraction exhaled nitric oxide, blood eosinophils, and soluble ST2. A 2-compartment disposition model with first-order elimination and first-order absorption best described the astegolimab pharmacokinetics. The relative bioavailability for the 70-mg dose was 15.3% lower. Baseline body weight, estimated glomerular filtration rate, and eosinophils were statistically correlated with pharmacokinetic parameters, but only body weight had a clinically meaningful influence on the steady-state exposure (ratios exceeding 0.8-1.25). The exposure-response of efficacy and biomarkers were generally flat with a weak trend in favor of the highest dose/exposure. This study characterized astegolimab pharmacokinetics in patients with asthma and showed typical pharmacokinetic behavior as a monoclonal antibody-based drug. The exposure-response analyses suggested the highest dose tested in the Zenyatta study (490 mg every 4 weeks) performed close to the maximum effect, and no additional response may be expected above it.

Keywords: IL-33; ST2; astegolimab; asthma; exposure-response; population pharmacokinetics.


Conflict of interest statement

N.K. is a current employee of Chugai Pharmaceutical Co., Ltd. and was working at Genentech Inc. at the time of this study. M.D. was an employee of Genentech at the time of the study and owned stock in Roche Holding Ltd. (current affiliation: Roche Products Australia, Millers Point, NSW Australia). R.J.S. was an employee of Pharmetheus at the time of the study (current affiliation: the Swedish Medical Products Agency). J.R. is a current employee of Pharmetheus. L.E.F. is a professor at Uppsala University and a paid consultant to Pharmetheus. J.R. and L.E.F. own stocks in Pharmetheus. S.V., D.C., T.S., G.S., and J.J. are current Genentech employees and Roche shareholders. W.S.P. was an employee of Genentech at the time of the study and owned stock in Roche Holding Ltd. (current affiliation: Clinical Pharmacology and DMPK, Ultragenyx Pharmaceutical, Novato, USA). A.Q. was an employee of Genentech at the time of the study and owned stock in Roche Holding Ltd. (current affiliation: Clinical Pharmacology and Quantitative Pharmacology, AstraZeneca, Gothenburg, Sweden).

Figures

Figure 1
Figure 1
Observed mean astegolimab serum concentrations versus time, based on the PK analysis data set, on a semilogarithmic scale. The upper panel shows absolute concentrations and the lower panel concentrations normalized to the 210‐mg dose. Filled circles represent the mean per dose and visit, with error bars as ± SD (upper panel). All sampling time points within a treatment arm have been connected by a line. Sampling time points are at trough except for the PK profiles after the first dose and after the week 24 dose, as well as the sample at week 68 (20 weeks after the most recent dose). For the week 68 visit the SD was larger than the mean, in all 3 arms, but the lower limits were depicted at LLOQ/2. The horizontal broken line marks the LLOQ (upper panel). LLOQ, lower limit of quantification; Q4W, every 4 weeks; SD, standard deviation.
Figure 2
Figure 2
Visual predictive check of astegolimab trough and washout concentrations, for the final PK model, stratified by dose arm. Astegolimab concentrations are displayed versus time after first dose, on a linear scale (upper panels) and on a semilogarithmic scale (bottom panels). The solid and dashed red lines represent the median, 5th and 95th percentiles of the observations; the shaded red and blue areas represent the 95%CI of the median, 5th and 95th percentiles predicted by the model. Observed concentrations below the LLOQ have been included in the calculation of percentiles, but for statistics where the observed percentile is below the LLOQ, the percentile for observed concentration has been excluded from the graph (occurs at follow‐up). LLOQ, lower limit of quantification; PK, pharmacokinetic.
Figure 3
Figure 3
Forest plot showing the final population PK model estimates of covariate effects on the steady‐state exposure for 490‐mg every‐4‐weeks dosing: average concentration in left panel and trough concentration in the right panel. The impact has been shown for the 2.5th and 97.5th percentiles of the covariate (across the subjects in the PK analysis data set), and in relation to the median covariate value. The vertical, dashed line is marking no change (a ratio of 1), compared to the reference patient. The x‐axis is on log scale, since ratios 2/3 and 1.5 are of corresponding impact, just as ratios 0.8 and 1.25 are. The closed symbols represent the point estimates and the whiskers represent the 95%CI, based on the NONMEM covariance matrix (10 000 bootstrap samples). The numbers on the right hand of the plot represent point estimates (95%CIs) of the change in the parameter compared to the reference patient (with baseline values: 79 kg body weight, 87.9 mL/min/1.73 m2 eGFR and 180 eosinophil cell count/μL). BEGFR, estimated glomerular filtration rate at baseline; BEOS, blood eosinophil level at baseline; BWT, body weight at baseline; CL, clearance; Q, intercompartmental clearance; Vc, central volume of distribution; Vp, peripheral volume of distribution. *The effect of body weight was implemented as a shared effect (coefficient) between CL and Q, and between Vc and Vp, respectively.
Figure 4
Figure 4
Exacerbation rate versus Css,av on a semilogarithmic scale. The solid line is a loess smooth where the shaded area represents the 95%CI of the smooth. The vertical lines and horizontal bars, at the bottom of the graph, are the median and range (2.5th and 97.5th percentiles) of the distribution of individual predicted Css,av in the 70‐mg every‐4‐weeks (blue), 210‐mg every‐4‐weeks (yellow), and 490‐mg every‐4‐weeks (red) dose groups, respectively. The dashed, black horizontal line shows weighted mean exacerbation rate for the placebo group and the dashed gray lines show the corresponding 95%CI (exact Poisson CI). The triangles show weighted mean exacerbation rate in Css,av low (blue), mid (yellow), and high (red) tertile groups with error bars showing the corresponding 95%CI (exact Poisson CI). Css,av, average concentration at steady state; Q4W, every 4 weeks.
Figure 5
Figure 5
The time course of the biomarkers presented as observed mean absolute change from baseline since first dose, grouped by placebo and tertile of Css,av. Measurements from unscheduled visits are not included in the plot. Css,av, average concentration at steady state; FeNO, fraction exhaled nitric oxide; FEV1, forced expiratory volume in 1 second; sST2, soluble ST2.
Figure 6
Figure 6
Individual mean absolute FEV1, FeNO, sST2, and eosinophils change from baseline for weeks 8 to 52 (weeks 12‐52 for FeNO, as there was no measurement for week 8), versus Css,av on a semilogarithmic scale. The solid line is a loess smooth where the shaded area represents the 95%CI of the smooth. The vertical lines and horizontal bars, at the bottom of the graph, are the median and range (2.5th and 97.5th percentiles), respectively, of the distribution of individual predicted Css,av for the 70‐ (blue), 210‐ (orange), and 490‐mg (red) every‐4‐weeks regimen. The dashed black horizontal line shows mean change from baseline for the placebo group and the dashed gray lines show the corresponding 95%CI. The triangles show mean change from baseline with error bars showing the corresponding 95%CI. Css,av, average concentration at steady state; FeNO, fraction exhaled nitric oxide; FEV1, forced expiratory volume in 1 second; Q4W, every 4 weeks; sST2, soluble ST2.

References

    1. Global strategy for asthma management and prevention, 2020 . Global Initiative for Asthma. www.ginasthma.org. Accessed November 19, 2021.
    1. To T, Stanojevic S, Moores G, et al. Global asthma prevalence in adults: findings from the cross‐sectional world health survey. BMC Public Health. 2012;12:204. - PMC - PubMed
    1. Peters SP, Ferguson G, Deniz Y, Reisner C. Uncontrolled asthma: a review of the prevalence, disease burden and options for treatment. Respir Med. 2006;100:1139‐1151. - PubMed
    1. Zeiger RS, Schatz M, Li Q, et al. High blood eosinophil count is a risk factor for future asthma exacerbations in adult persistent asthma. J Allergy Clin Immunol Pract. 2014;2:741‐50. - PubMed
    1. Hermosa JL, Sánchez CB, Rubio MC, Mínguez MM, Walther JL. Factors associated with the control of severe asthma. J Asthma. 2010;47:124‐130. - PubMed

Publication types

MeSH terms