. 2022 Jul 1;24(7):1074-1087.
doi: 10.1093/neuonc/noab302.

Surgical resection of glioblastomas induces pleiotrophin-mediated self-renewal of glioblastoma stem cells in recurrent tumors

Affiliations

Surgical resection of glioblastomas induces pleiotrophin-mediated self-renewal of glioblastoma stem cells in recurrent tumors

Arnon Møldrup Knudsen et al. Neuro Oncol. .

Abstract

Background: Glioblastomas are highly resistant to therapy, and virtually all patients experience tumor recurrence after standard-of-care treatment. Surgical tumor resection is a cornerstone in glioblastoma therapy, but its impact on cellular phenotypes in the local postsurgical microenvironment has yet to be fully elucidated.

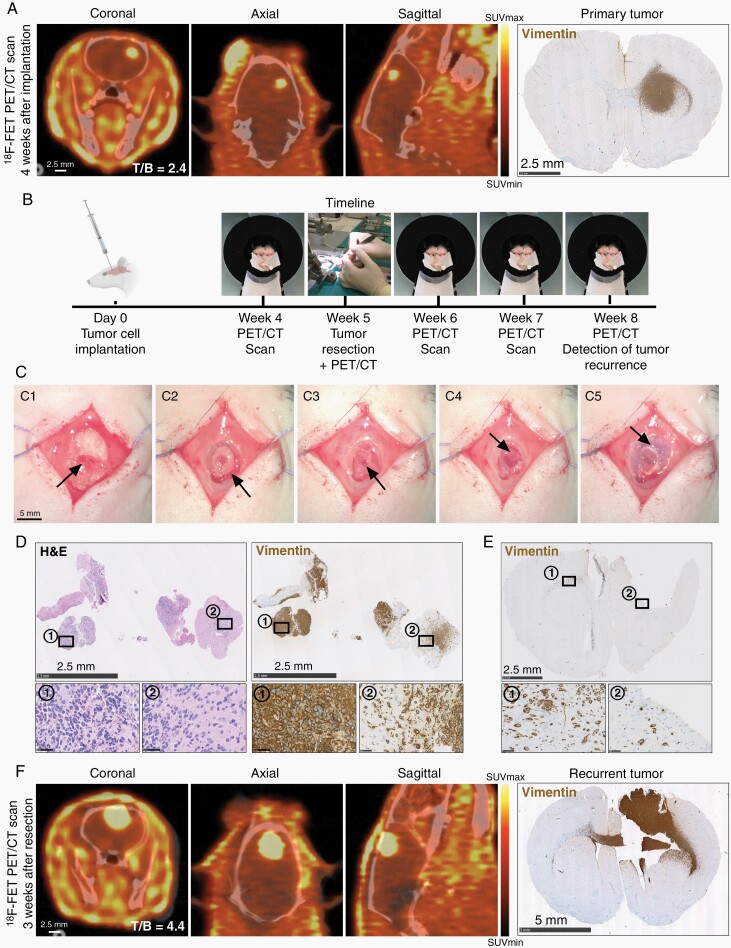
Methods: We developed a preclinical orthotopic xenograft tumor resection model in rats with integrated 18F-FET PET/CT imaging. Primary and recurrent tumors were subject to bulk and single-cell RNA sequencing. Differentially expressed genes and pathways were investigated and validated using tissue specimens from the xenograft model, 23 patients with matched primary/recurrent tumors, and a cohort including 190 glioblastoma patients. Functional investigations were performed in vitro with multiple patient-derived cell cultures.

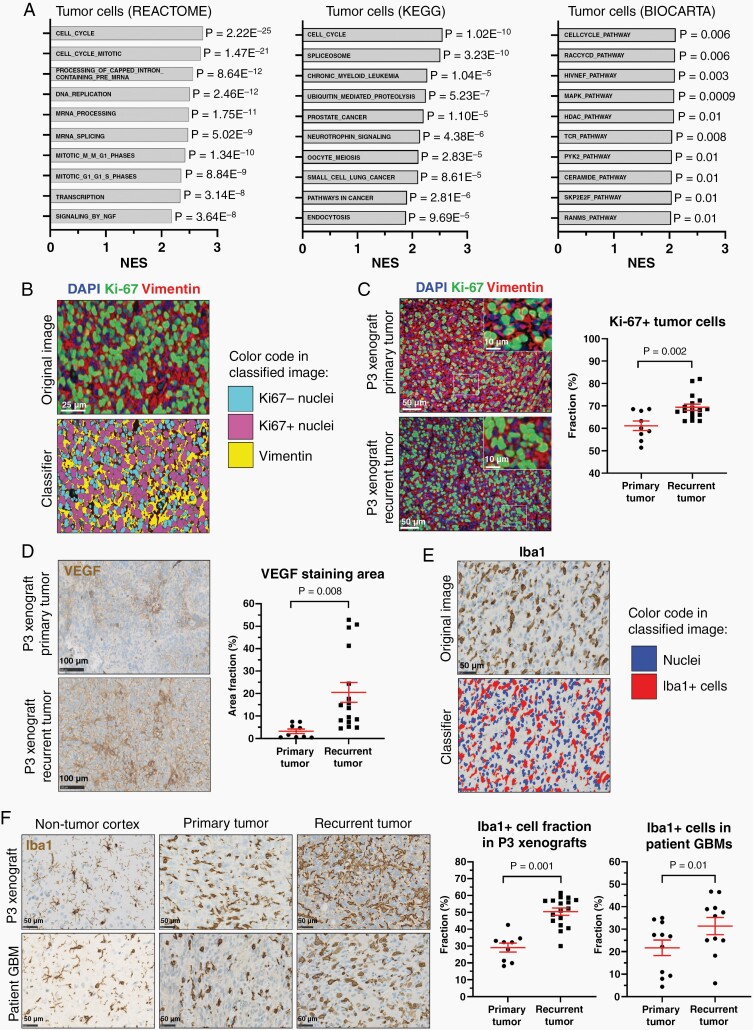
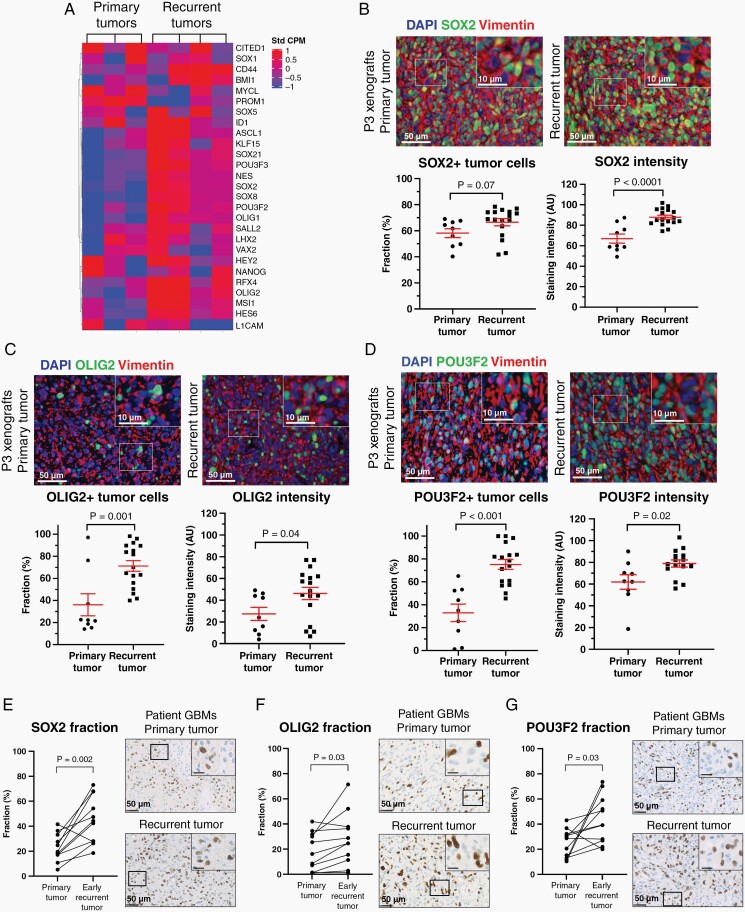
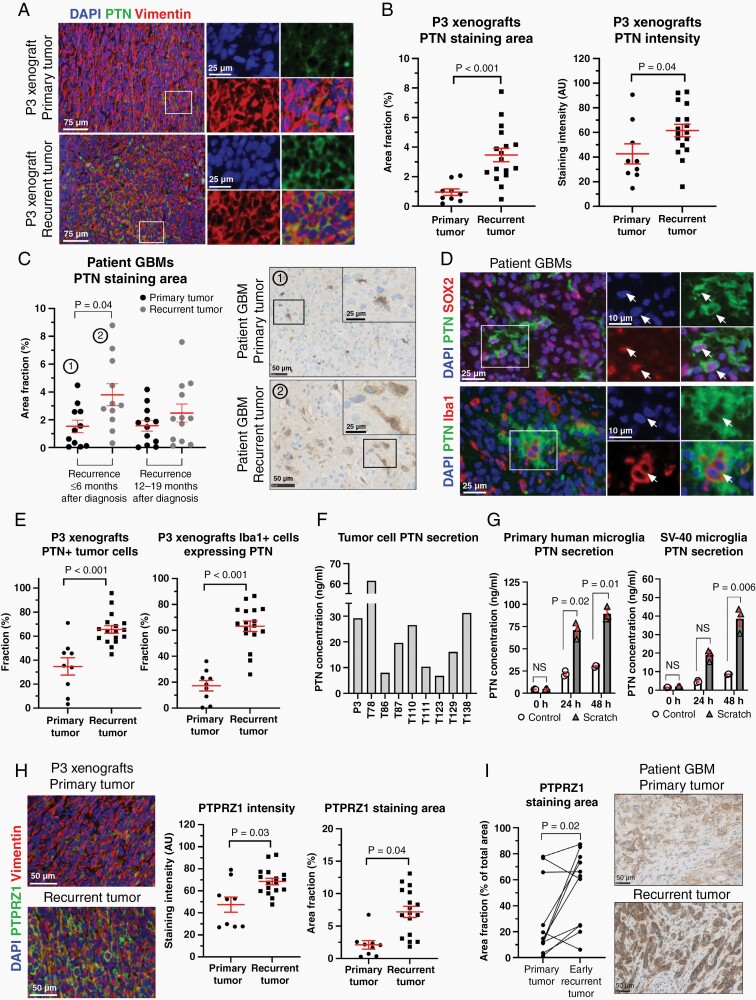
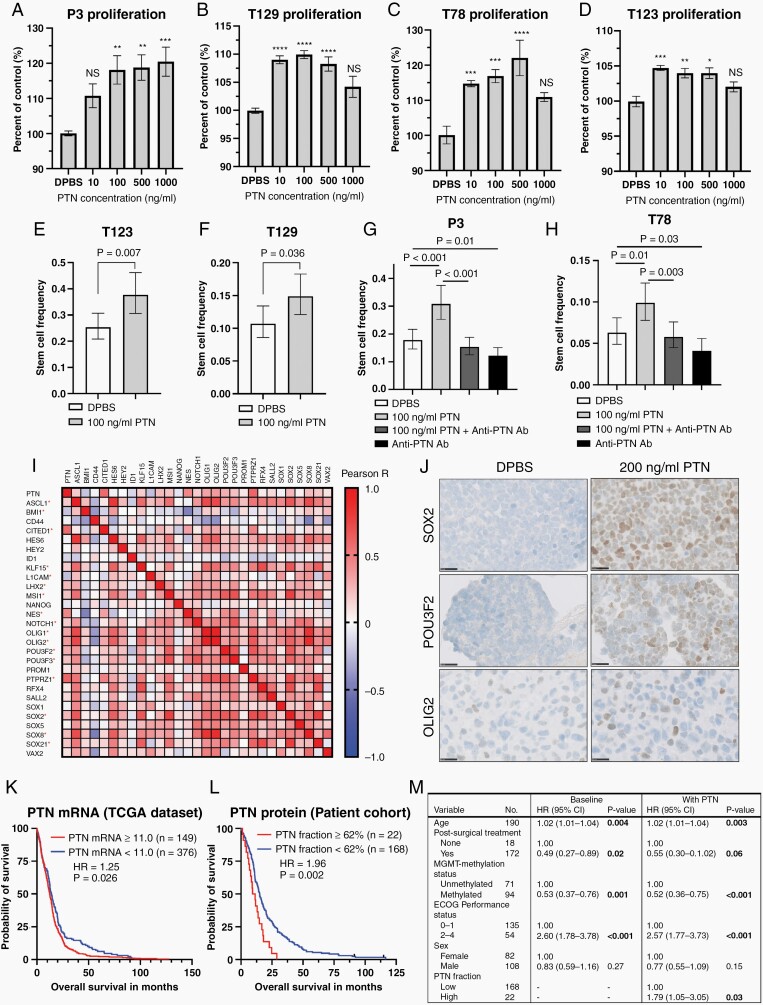
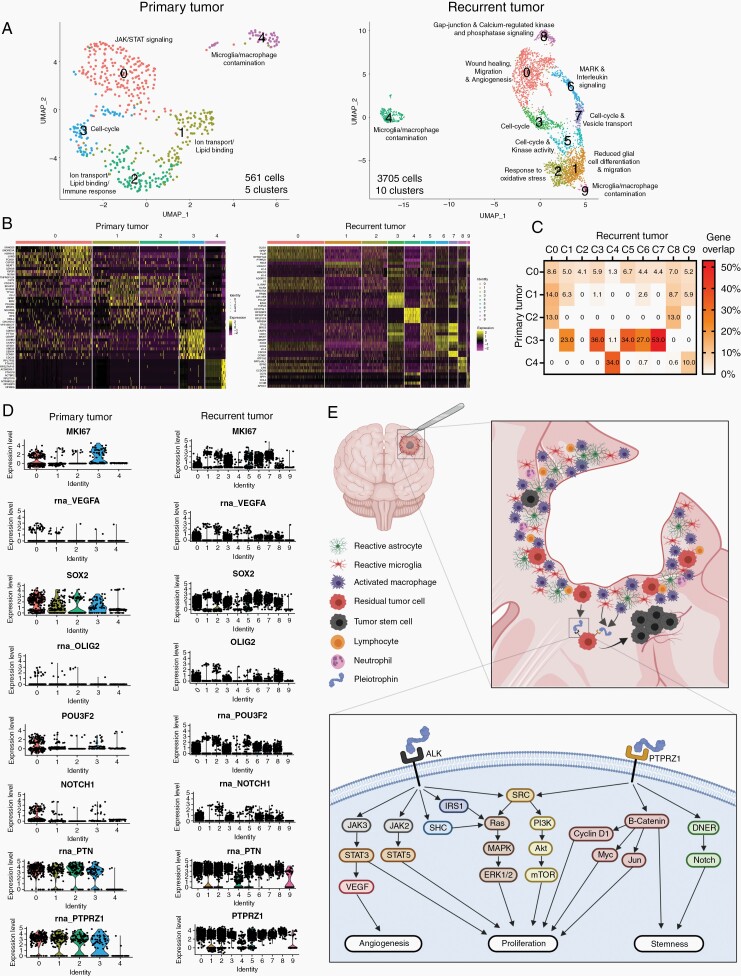
Results: Tumor resection induced microglia/macrophage infiltration, angiogenesis as well as proliferation and upregulation of several stem cell-related genes in recurrent tumor cells. Expression changes of selected genes SOX2, POU3F2, OLIG2, and NOTCH1 were validated at the protein level in xenografts and early recurrent patient tumors. Single-cell transcriptomics revealed the presence of distinct phenotypic cell clusters in recurrent tumors which deviated from clusters found in primary tumors. Recurrent tumors expressed elevated levels of pleiotrophin (PTN), secreted by both tumor cells and tumor-associated microglia/macrophages. Mechanistically, PTN could induce tumor cell proliferation, self-renewal, and the stem cell program. In glioblastoma patients, high PTN expression was associated with poor overall survival and identified as an independent prognostic factor.

Conclusion: Surgical tumor resection is an iatrogenic driver of PTN-mediated self-renewal in glioblastoma tumor cells that promotes therapeutic resistance and tumor recurrence.

Keywords: glioblastoma; pleiotrophin; recurrence; self-renewal; tumor resection.


Figures

Fig. 1
Fig. 1
Establishment and validation of PET/CT-based tumor detection and surgical resection procedure. (A) Representative 18F-FET PET/CT and histological images from a P3 xenograft 4 weeks after tumor cell implantation. Scale = 2.5 mm. (B) Timeline depicting tumor cell implantation and subsequent procedures. (C) Tumor resection procedure; Exposure of the implantation burr hole (C1), craniotomy (C2), bone flap removal (C3), microsurgical resection (C4), and bone flap repositioning (C5). Scale = 5 mm. (D) H&E and tumor cell marker vimentin stains of resected tissue. Scale = 2.5 mm (overview) and 50 µm (inserts). (E) Histological section from a post-resection brain confirming gross total resection. Scale = 2.5 mm. (F) Representative 18F-FET PET/CT images and histological validation at recurrence, 3 weeks after resection. Scale = 2.5 mm (PET/CT) and 5 mm (histology). Abbreviations: CT, computed tomography; PET, positron emission tomography.
Fig. 2
Fig. 2
Pathway enrichment and histological validation in recurrent tumors. (A) Top-10 enriched REACTOME, KEGG, and BIOCARTA pathways in recurrent tumors. (B) Representative example of a software-based classifier designed to quantify immunofluorescence double staining. Scale = 25 µm. (C) Quantification of proliferating tumor cells (vimentin+/Ki-67+) in primary (n = 9) vs recurrent (n = 17) xenografts. Scale = 50 µm (overview) and 10 µm (inserts). (D) Representative VEGF immunostaining and quantification in primary (n = 9) vs recurrent (n = 17) xenografts. Scale = 100 µm. (E) Software-based classifier designed for Iba1 quantification. Scale = 50 µm. (F) Iba1 staining quantification in primary (n = 9) vs recurrent (n = 17) xenografts and primary (n = 11) vs early recurrent (n = 11) patient GBMs. Scale = 50 µm. Abbreviations: GBMs, glioblastoma; VEGF, vascular endothelial growth factor.
Fig. 3
Fig. 3
GSCs are enriched in recurrent xenografts and patient GBMs. (A) Relative mRNA expression levels of 28 GSC markers in primary (n = 3) vs recurrent (n = 4) pooled xenografts. (B–D) Representative images of SOX2, OLIG2, and POU3F2 immunofluorescence staining and software-based quantification in primary (n = 9) vs recurrent (n = 17) xenografts. Scale = 50 µm (overview) and 10 µm (inserts). (E–G) Validation of SOX2, OLIG2, and POU3F2 protein upregulation in primary (n = 11) vs early recurrent (n = 11) patient GBMs. Scale = 50 µm (overview) and 10 µm (inserts). AU = arbitrary units. Abbreviations: GBMs, glioblastomas; GSCs, GBM stem cells.
Fig. 4
Fig. 4
PTN expression is found in both tumor cells and tumor-associated microglia/macrophages and increases in recurrent tumors. (A) Representative immunofluorescence images showing PTN expression in primary vs recurrent P3 xenografts. Scale = 75 µm (overview) and 25 µm (inserts). (B) Quantification of PTN expression in primary (n = 9) vs recurrent (n = 17) xenografts. (C) Quantification of PTN expression in patient GBMs validated PTN upregulation in early recurrent tumors. Scale = 50 µm (overview) and 25 µm (inserts). (D) PTN protein expression was seen both in SOX2+ GSCs and tumor-associated microglia/macrophages (white arrows). Scale = 25 µm (overview) and 10 µm (inserts). (E) Quantification of PTN-expressing tumor cells (vimentin+/PTN+) and microglia/macrophages (Iba1+/PTN+) in primary (n = 9) vs recurrent (n = 17) xenografts. (F, G) ELISA with 9 different patient-derived GBM spheroid cultures and primary human microglia as well as SV-40 microglia confirmed PTN secretion. (H, I) Quantification of PTPRZ1 expression in primary (n = 9) vs recurrent (n = 17) xenografts and primary (n = 11) vs early recurrent (n = 11) patient GBMs. Scale = 50 µm. AU = arbitrary units. Abbreviations: GBMs, glioblastomas; PTN, pleiotrophin.
Fig. 5
Fig. 5
PTN induces tumor cell proliferation, self-renewal, expression of GSC markers and is associated with poor patient survival. (A–D) Exogenous PTN induced proliferation after 5-day treatment of all 4 investigated spheroid cultures (n = 12 experiments). Scale = 200 µm (P3, T129, and T78) and 300 µm (T123). NS = non-significant. *P < .05, **P < .01, ***P < .001, ****P < .0001. (E–H) Limiting dilution assays with the addition of exogenous PTN and/or anti-PTN antibody (n = 3 experiments with 24 wells per condition/experiment). Error bars represent 95%CI. (I) Heatmap showing correlations between TCGA mRNA levels of PTN, PTPRZ1, NOTCH1, and the 28-gene GSC signature. Red asterisks indicate significant correlations with PTN. (J) Representative SOX2, POU3F2, and OLIG2 immunohistochemical staining performed on clotted T78 spheroids, cultured 4 days without EGF/FGF, and additional 48 h with/without exogenous PTN. Scale = 25 µm. (K, L) Survival analysis with TCGA PTN mRNA data and PTN protein levels in a clinical GBM patient cohort, stratified at optimized cutoff. Ticks indicate censored data. (M) Multivariate Cox regression performed on the patient cohort. Significant P-values are bold. Abbreviations: GBM, glioblastoma; GSC, GBM stem cell; PTN, pleiotrophin.
Fig. 6
Fig. 6
Single-cell transcriptomics of primary and recurrent tumors. (A, B) UMAP plots and heatmaps depicting clustering of tumor cells from primary and recurrent xenografts. (C) Gene expression overlap between clusters. (D) Single-cell expression levels of selected genes in primary vs recurrent tumors. (E) Graphical summary of the iatrogenic induction of PTN-mediated self-renewal and proliferation in glioblastoma recurrences. Abbreviations: PTN, pleiotrophin; UMAP, uniform manifold approximation and projection.

Comment in

  • Resection of glioma-Feeding the beast?
    Blobner J, Tonn JC. Blobner J, et al. Neuro Oncol. 2022 Jul 1;24(7):1088-1089. doi: 10.1093/neuonc/noac078. Neuro Oncol. 2022. PMID: 35323960 Free PMC article. No abstract available.

References

    1. Stupp R, Hegi ME, Mason WP, et al. . Effects of radiotherapy with concomitant and adjuvant temozolomide versus radiotherapy alone on survival in glioblastoma in a randomised phase III study: 5-year analysis of the EORTC-NCIC trial. Lancet Oncol. 2009;10(5):459–466. - PubMed
    1. Brown TJ, Brennan MC, Li M, et al. . Association of the extent of resection with survival in glioblastoma: a systematic review and meta-analysis. JAMA Oncol. 2016;2(11):1460–1469. - PMC - PubMed
    1. Petrecca K, Guiot MC, Panet-Raymond V, Souhami L. Failure pattern following complete resection plus radiotherapy and temozolomide is at the resection margin in patients with glioblastoma. J Neurooncol. 2013;111(1):19–23. - PubMed
    1. Yool AJ, Ramesh S. Molecular targets for combined therapeutic strategies to limit glioblastoma cell migration and invasion. Front Pharmacol. 2020;11:358. - PMC - PubMed
    1. Lemée JM, Clavreul A, Menei P. Intratumoral heterogeneity in glioblastoma: don’t forget the peritumoral brain zone. Neuro Oncol. 2015;17(10):1322–1332. - PMC - PubMed

Publication types

LinkOut - more resources