. 2022 Jan 12;30(1):83-96.e4.
doi: 10.1016/j.chom.2021.12.005. Epub 2021 Dec 7.

Pre-existing humoral immunity to human common cold coronaviruses negatively impacts the protective SARS-CoV-2 antibody response

Collaborators, Affiliations

Pre-existing humoral immunity to human common cold coronaviruses negatively impacts the protective SARS-CoV-2 antibody response

Chun-Yang Lin et al. Cell Host Microbe. .

Abstract

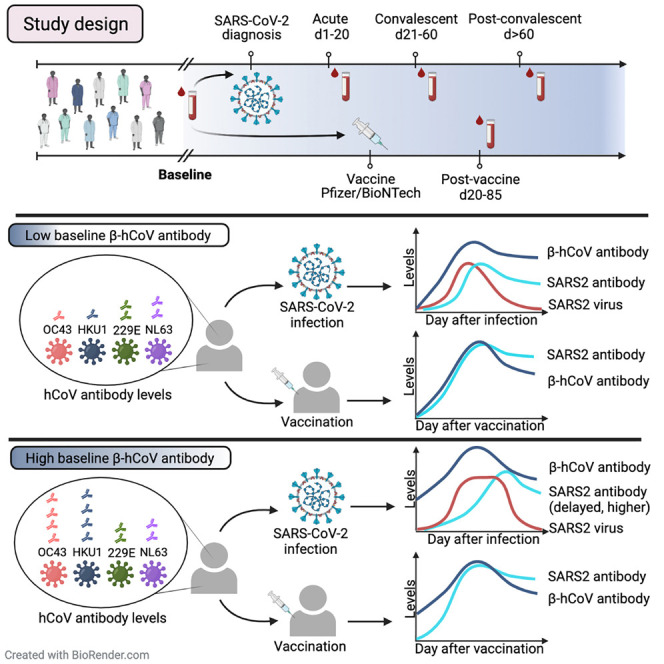
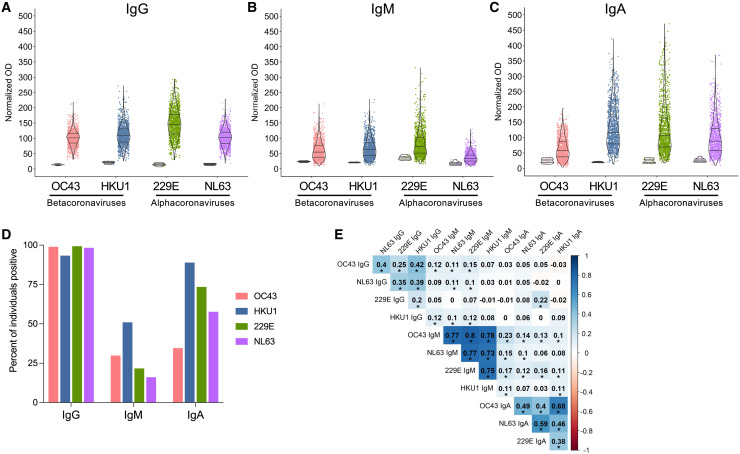
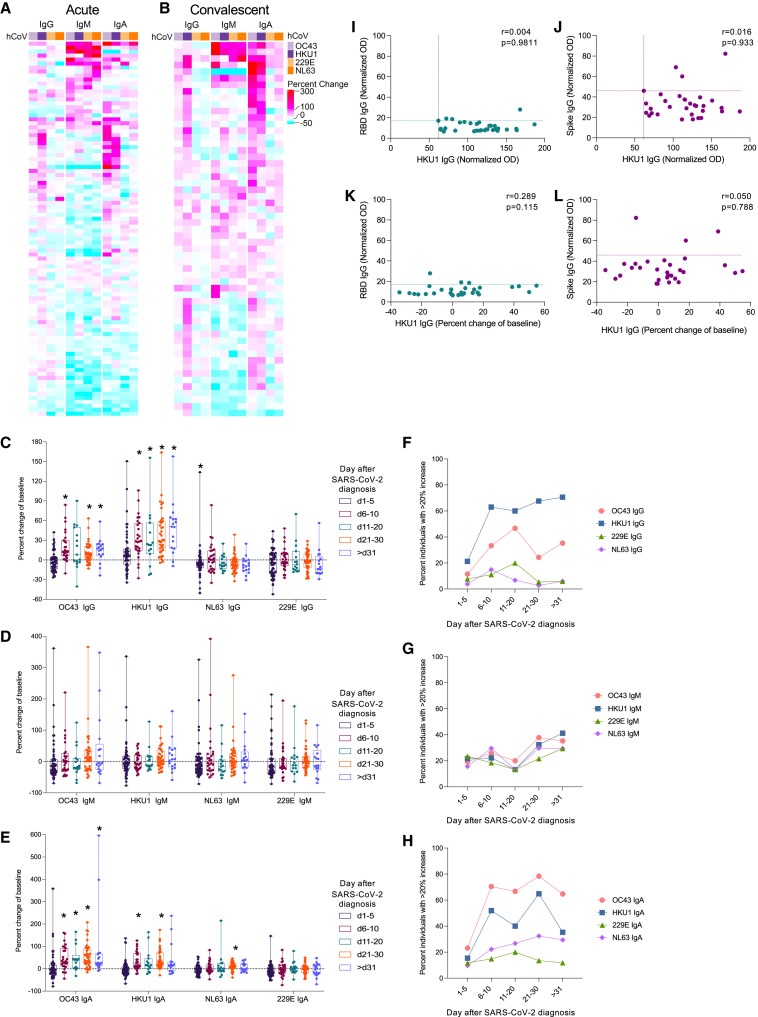
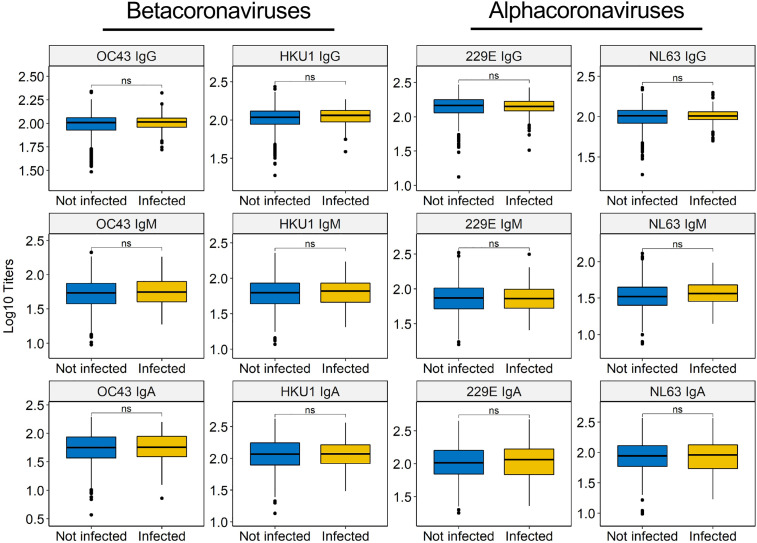
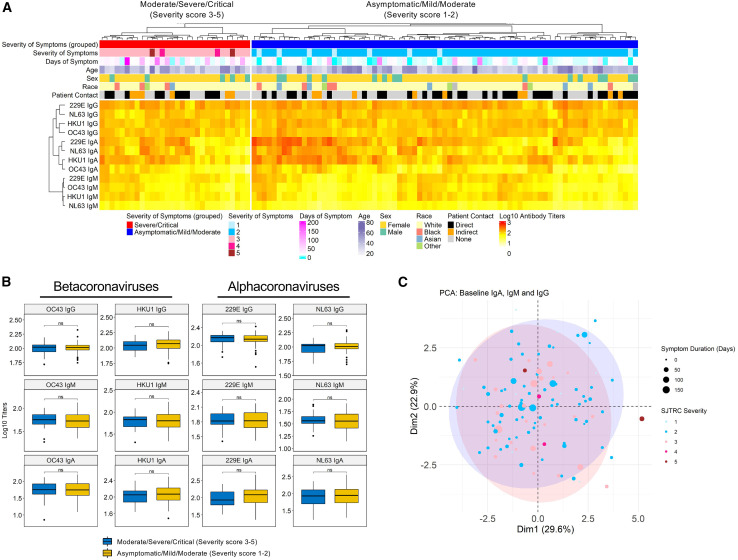
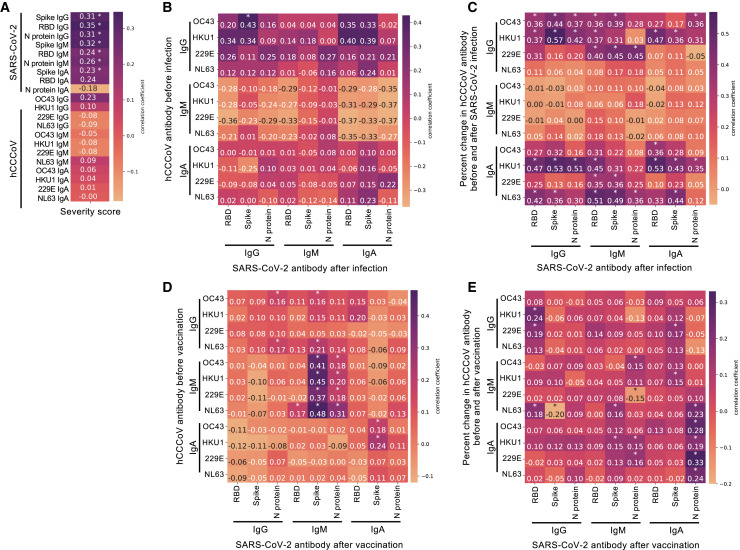
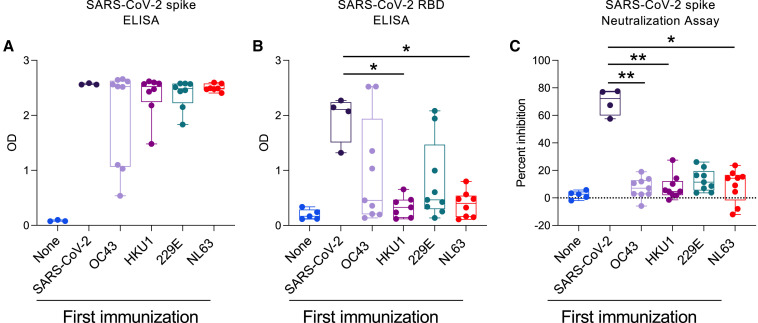
SARS-CoV-2 infection causes diverse outcomes ranging from asymptomatic infection to respiratory distress and death. A major unresolved question is whether prior immunity to endemic, human common cold coronaviruses (hCCCoVs) impacts susceptibility to SARS-CoV-2 infection or immunity following infection and vaccination. Therefore, we analyzed samples from the same individuals before and after SARS-CoV-2 infection or vaccination. We found hCCCoV antibody levels increase after SARS-CoV-2 exposure, demonstrating cross-reactivity. However, a case-control study indicates that baseline hCCCoV antibody levels are not associated with protection against SARS-CoV-2 infection. Rather, higher magnitudes of pre-existing betacoronavirus antibodies correlate with more SARS-CoV-2 antibodies following infection, an indicator of greater disease severity. Additionally, immunization with hCCCoV spike proteins before SARS-CoV-2 immunization impedes the generation of SARS-CoV-2-neutralizing antibodies in mice. Together, these data suggest that pre-existing hCCCoV antibodies hinder SARS-CoV-2 antibody-based immunity following infection and provide insight on how pre-existing coronavirus immunity impacts SARS-CoV-2 infection, which is critical considering emerging variants.

Keywords: 229E; COVID-19; HKU1; NL63; OC43; SARS-CoV-2; antibody; pre-existing immunity.


Conflict of interest statement

Declaration of interests P.G.T. has consulted for Illumina and 10X and serves on the advisory board of Immunoscape and Cyotagents. P.G.T. and J.C.C. filed patents related to treatment of severe respiratory infections, including SARS-CoV-2 (not based on research in this paper).

Figures

None
Graphical abstract
Figure 1
Figure 1
Wide variation in baseline hCCCoV antibody levels (A–C) Samples from 1,202 individuals taken prior to SARS-CoV-2 infection were analyzed by ELISA for (A) IgG, (B) IgM, and (C) IgA antibodies specific for spike proteins of OC43, HKU1, 229E, and NL63. Normalized ODs are presented, which is the percent ratio of the sample OD relative to the OD of the positive control of the plate. Negative control samples from young individuals in the FLU09 cohort are shown on the left for each antigen. (D) The percent of individuals with a positive value for each isotype as determined by a normalized OD greater than three times the average of the negative controls. (E) Clustered heatmap of Spearman’s correlation coefficients between the hCCCoV antibodies in baseline samples (n = 1,202). Asterisks indicate significant correlations after adjustment for multiple comparisons with the Bonferroni correction (p < 0.05).
Figure 2
Figure 2
hCCCoV IgM levels inversely correlate with age and are higher in individuals with direct patient contact (A) hCCCoV-normalized ODs were compared between younger (<43 years) versus older (³43 years) individuals based on median age of the cohort. (B) Participants self-reported whether they had direct, indirect, or no patient contact. Statistical significance was determined by the Wilcoxon–Mann–Whitney test with Bonferroni adjustment (ns, not significant; ∗∗p < 0.01; ∗∗∗p < 0.001; ∗∗∗∗p < 0.0001).
Figure 3
Figure 3
Antibodies specific for OC43 and HKU1 increase following SARS-CoV-2 infection (A and B) Samples taken from individuals during the (A) acute (1–20 days) or the (B) convalescent (>20 days) phase after PCR-confirmed infection were analyzed by ELISA for IgG, IgM, and IgA antibodies specific for spike proteins of OC43, HKU1, 229E, and NL63. The percent change of the normalized OD in the sample after infection relative to the baseline is depicted in the heatmap. (C–E) The percent change of (C) IgG, (D) IgM, and (E) IgA antibodies relative to the baseline sample was calculated for samples at indicated times following SARS-CoV-2 infection. Asterisks indicate significant difference compared to no fold change determined by Wilcoxon signed-rank test with the Benjamini, Krieger, and Yekutieli method. (F–H) Proportion of individuals with greater than a 20% increase in (F) IgG, (G) IgM, or (H) IgA. Fold change of hCCCoV antibodies for all acute and convalescent samples compared to baseline samples are reported in Table S2. (I–L) Normalized OD of (I and K) SARS-CoV-2 RBD IgG and (J and L) spike IgG in samples collected within 5 days of SARS-CoV-2 diagnosis were compared to the (I,J) normalized OD of HKU1 IgG in the same sample or the (K,L) boost in HKU1 IgG in the sample relative to baseline. The r value computed by the Spearman method is shown. Dashed lines indicate cut-offs for positive values.
Figure 4
Figure 4
Baseline hCCCoV antibody levels do not correlate with protection from SARS-CoV-2 infection Baseline hCCCoV-normalized ODs were compared between individuals that became infected (n = 121) during the study to individuals that remained SAR-CoV-2 negative (n = 1,081) using the Wilcoxon-Mann-Whitney test and adjusted with Bonferroni method (ns, not significant).
Figure 5
Figure 5
Baseline hCCCoV antibody levels do not correlate with disease severity following SARS-CoV-2 infection (A) Baseline hCCCoV-normalized ODs are depicted in the heatmap along with demographic information and severity scores. Individuals were given a severity score based on self-reported symptoms: (1) Asymptomatic (n = 8), (2) mild-moderate (n = 69), (3) moderate-severe (n = 26), (4) severe (n = 2), and (5) critical (n = 2). (B) Comparison of baseline hCCCoV antibody between infected subjects with severity score 3–5 (n = 30) and severity score 1 to 2 (n = 77). (C) Principal component analysis (PCA) of baseline betacoronavirus IgG-, IgA-, and IgM-normalized ODs. First two components (Dim1 and Dim2) are on the x and y axes, and numbers in parenthesis indicate percent variation explained by each component. The size and color of each bubble represent days and severity of symptoms for 107 SARS-CoV-2-infected subjects. The blue and red shaded areas represent 90% ellipses (Fox and Weisberg, 2019) for severity 3–5 and severity 1 to 2, respectively.
Figure 6
Figure 6
Existing hCCCoV antibody levels associate with the magnitude of the SARS-CoV-2 antibody response after infection, but not vaccination (A) The normalized OD of antibodies in samples taken 16–40 days after SARS-CoV-2 diagnosis (n = 123) was compared to the five severity scores. Kendall rank correlation coefficients are indicated in the heatmap. P values were corrected by false discovery rate. p < 0.05. (B–E) Pearson’s formulation was utilized to calculate correlation coefficients, with multiple testing correction with the TestCor package between (B) normalized ODs of baseline hCCCoV antibodies compared to normalized ODs of SARS-CoV-2 antibody in samples collected 16–40 days after infection (n = 41), (C) the percent change from baseline of hCCCoV antibodies compared to SARS-CoV-2 antibody in samples collected between 1 and 15 days after infection (n = 43), (D) baseline hCCCoV-normalized ODs compared to SARS-CoV-2 antibody 20–85 days after vaccination with Pfizer/BioNTech BNT162b2 (n = 256), and (E) the increase in hCCCoV antibodies relative to the baseline sample compared to SARS-CoV-2 antibody in samples collected after vaccination (n = 256).
Figure 7
Figure 7
Prior immunization with hCCCoV spike proteins limits the antibody responses to SARS-CoV-2 RBD (A–C) C57BL/6 mice were immunized with spike proteins in CFA, interperitoneally. Four weeks later, all mice were immunized with SARS-CoV-2 spike protein. Control mice (none) only received CFA at both time points. Serum taken 2 weeks after the second immunization was analyzed by ELISA for reactivity to (A) SARS-CoV-2 spike protein or (B) SARS-CoV-2 RBD. (C) Serum was tested in a SARS-CoV-2 surrogate neutralization assay. p values calculated using Kruskal-Wallis test and Dunn’s multiple comparisons test (p < 0.05; ∗∗p < 0.01).

References

    1. Aguilar-Bretones M., Westerhuis B.M., Raadsen M.P., de Bruin E., Chandler F.D., Okba N.M., Haagmans B.L., Langerak T., Endeman H., van den Akker J.P., et al. Seasonal coronavirus-specific B cells with limited SARS-CoV-2 cross-reactivity dominate the IgG response in severe COVID-19. J. Clin. Invest. 2021;131:e150613. - PMC - PubMed
    1. Allen E.K., Randolph A.G., Bhangale T., Dogra P., Ohlson M., Oshansky C.M., Zamora A.E., Shannon J.P., Finkelstein D., Dressen A., et al. SNP-mediated disruption of CTCF binding at the IFITM3 promoter is associated with risk of severe influenza in humans. Nat. Med. 2017;23:975–983. - PMC - PubMed
    1. Amanat F., Stadlbauer D., Strohmeier S., Nguyen T.H.O., Chromikova V., McMahon M., Jiang K., Arunkumar G.A., Jurczyszak D., Polanco J., et al. A serological assay to detect SARS-CoV-2 seroconversion in humans. Nat. Med. 2020;26:1033–1036. - PMC - PubMed
    1. Anderson E.M., Goodwin E.C., Verma A., Arevalo C.P., Bolton M.J., Weirick M.E., Gouma S., McAllister C.M., Christensen S.R., Weaver J., et al. UPenn COVID Processing Unit Seasonal human coronavirus antibodies are boosted upon SARS-CoV-2 infection but not associated with protection. Cell. 2021;184:1858–1864.e10. - PMC - PubMed
    1. Arvin A.M., Fink K., Schmid M.A., Cathcart A., Spreafico R., Havenar-Daughton C., Lanzavecchia A., Corti D., Virgin H.W. A perspective on potential antibody-dependent enhancement of SARS-CoV-2. Nature. 2020;584:353–363. - PubMed

Publication types

Substances