. 2021 Dec 28;37(13):110154.
doi: 10.1016/j.celrep.2021.110154.

Spatiotemporal localization of proteins in mycobacteria

Affiliations

Spatiotemporal localization of proteins in mycobacteria

Junhao Zhu et al. Cell Rep. .

Abstract

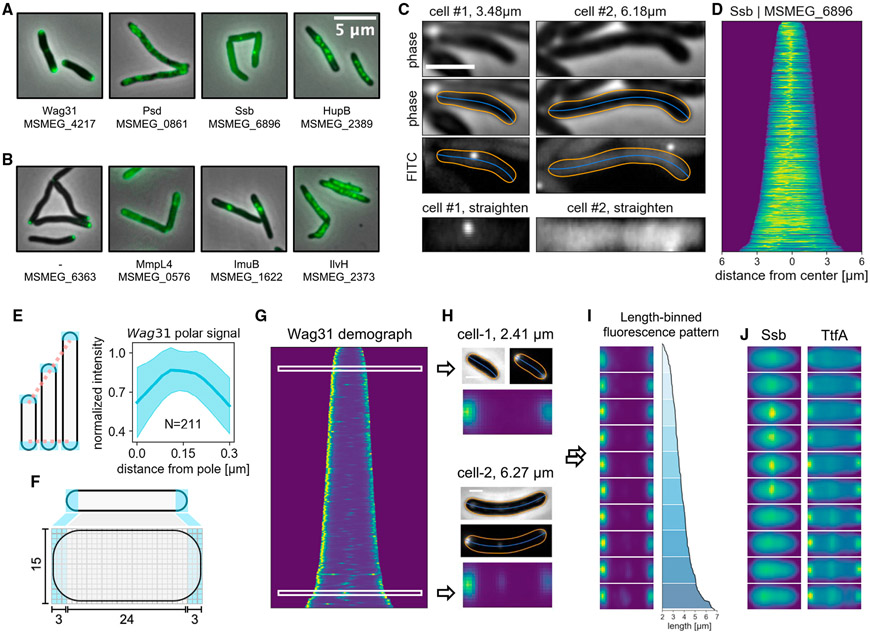
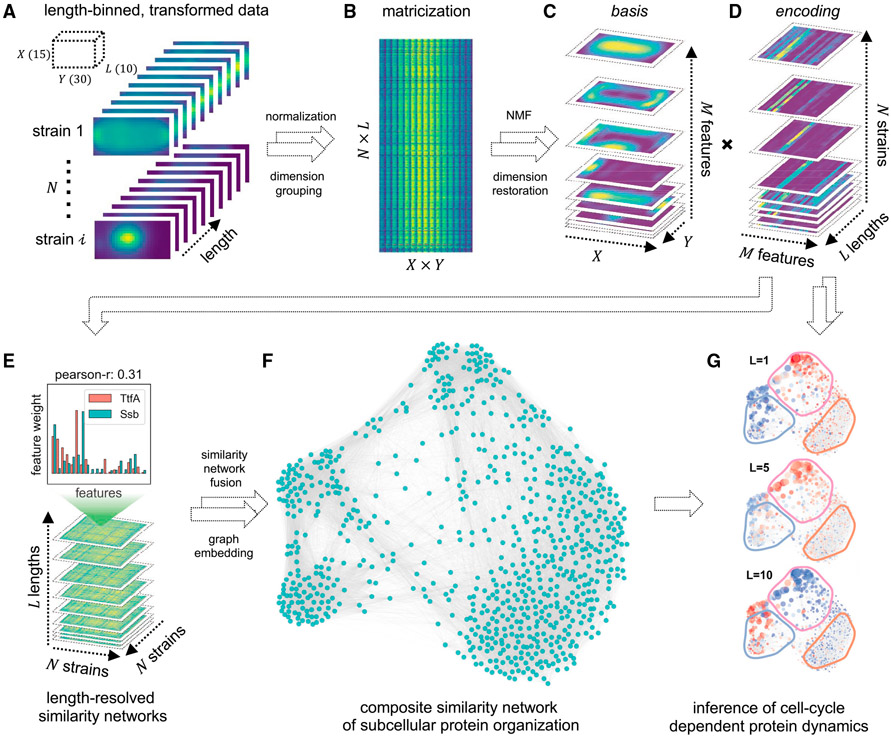
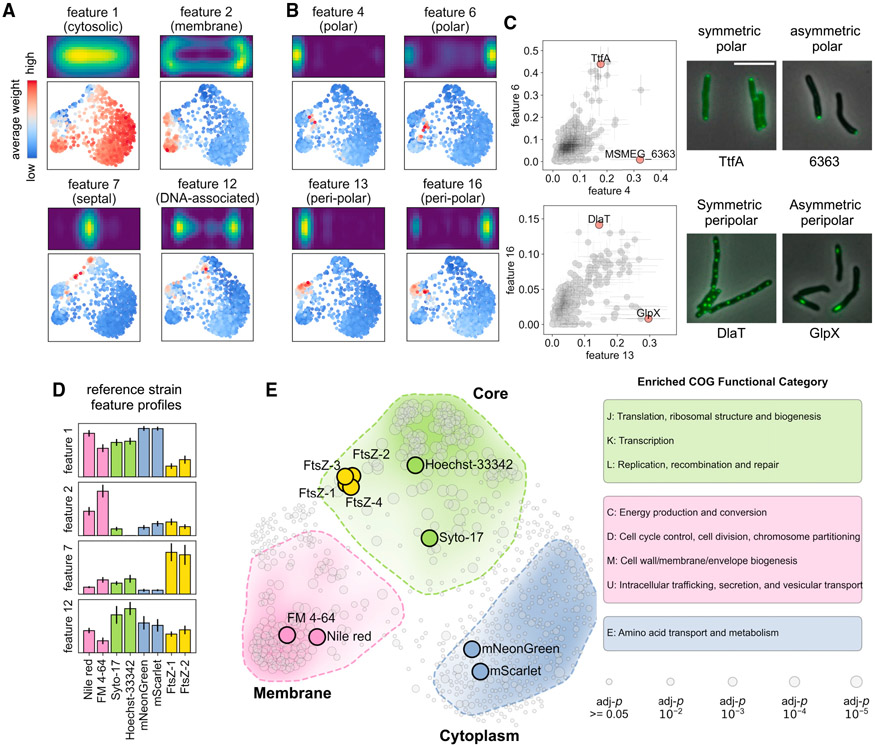
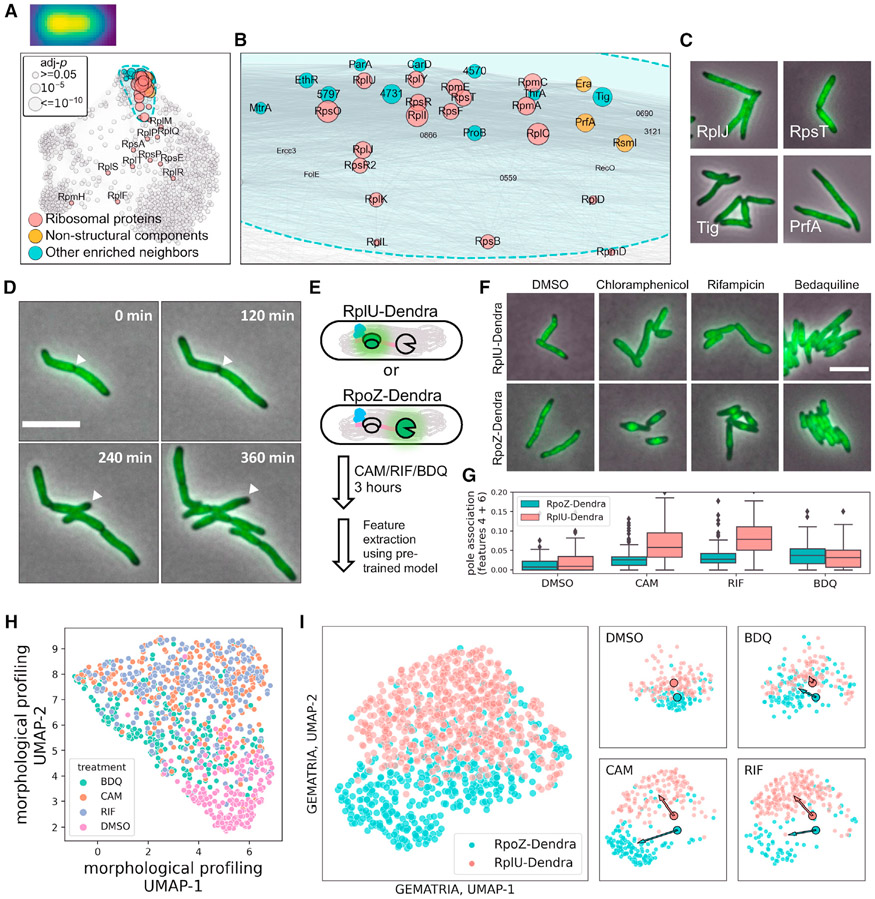
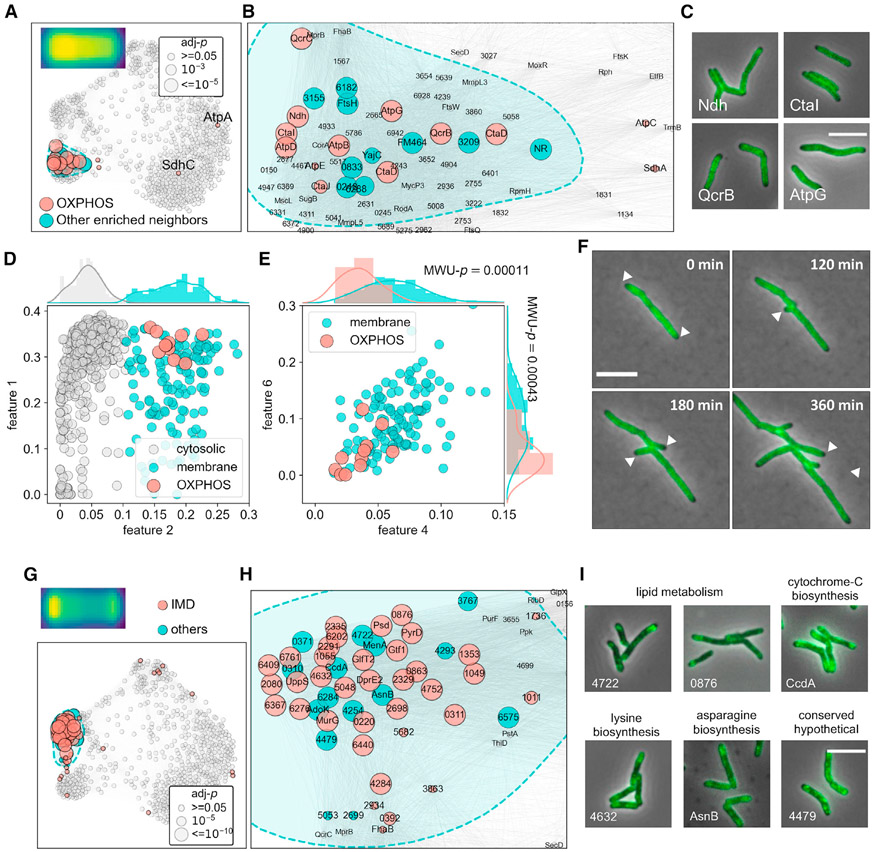
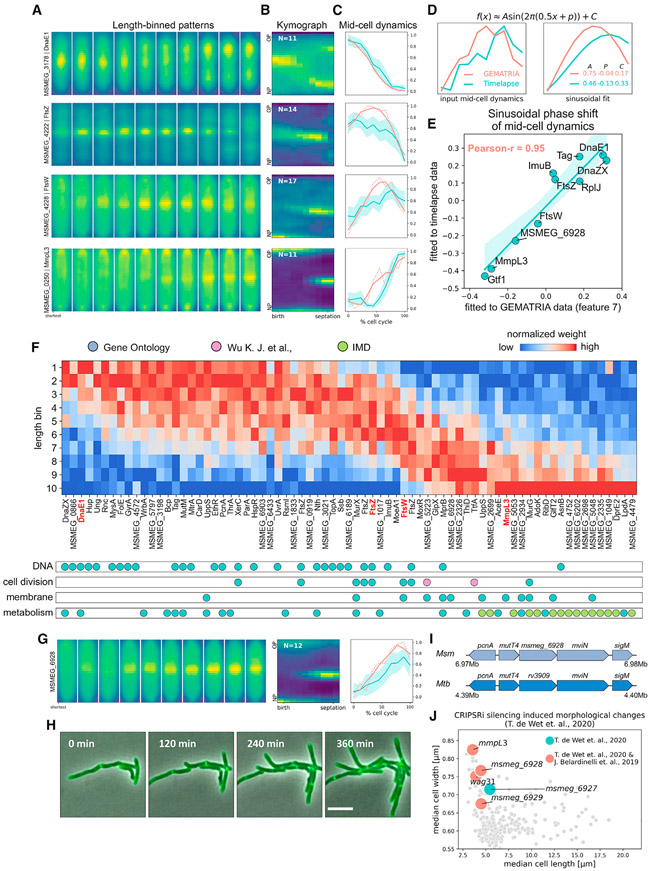
Although prokaryotic organisms lack traditional organelles, they must still organize cellular structures in space and time, challenges that different species solve differently. To systematically define the subcellular architecture of mycobacteria, we perform high-throughput imaging of a library of fluorescently tagged proteins expressed in Mycobacterium smegmatis and develop a customized computational pipeline, MOMIA and GEMATRIA, to analyze these data. Our results establish a spatial organization network of over 700 conserved mycobacterial proteins and reveal a coherent localization pattern for many proteins of known function, including those in translation, energy metabolism, cell growth and division, as well as proteins of unknown function. Furthermore, our pipeline exploits morphologic proxies to enable a pseudo-temporal approximation of protein localization and identifies previously uncharacterized cell-cycle-dependent dynamics of essential mycobacterial proteins. Collectively, these data provide a systems perspective on the subcellular organization of mycobacteria and provide tools for the analysis of bacteria with non-standard growth characteristics.

Keywords: Mycobacterium smegmatis; fluorescent protein; matrix factorization; microscopy image analysis; mycobacteria.


Conflict of interest statement

Declaration of interests The authors declare no competing interests.

Figures

Figure 1.
Figure 1.. MOMIA enables streamlined image processing and renders a spatial-temporal representation of mycobacterial protein localization
(A) Examples of MSR-Dendra strains with previously established subcellular localization patterns. Gene name and/or gene locus index is listed beneath each depiction. (B) Example images of previously uncharacterized proteins in the MSR-Dendra library. (C) MOMIA computes the morphological contours (orange lines) and centerlines (blue lines) with subpixel precision (STAR Methods). Here the representative cells express a single-stranded binding protein, Ssb-Dendra. Cellular fluorescence profiles are straightened and illustrated in bottom panels. (D) Axial intensity profiles of Ssb-Dendra-expressing cells are normalized and stacked according to cell length to render the demograph. (E) The expanse of the mycobacterial cell pole remains constant as the cell elongates. Left panel: cartoon illustrating the elongation-invariance of polar hemispheres. Right panel: the longitudinal intensity profiles of the polar 0.3 μm of 211 cells are interpolated, normalized, and realigned to calculate the averaged distribution (blue line, shaded area denotes one standard deviation from the mean) of Wag31-Dendra near the poles. (F) Schematic of pole-aware transformation of single-cell fluorescence data (STAR Methods). (G and H) (G) The demograph representation of Wag31 protein localization. The phase contrast and the fluorescence data of two representative cells of different lengths are shown in (H), with their standardized data matrices depicted below. (I) Length-binned stacks of transformed Wag31-Dendra data, the corresponding length profiles are plotted on the right. (J) Length-binned transformations of Ssb and TtfA. Scale bars, 2 μm in (C) and 1 μm in (H).
Figure 2.
Figure 2.. Schematic of GEMATRIA
(A) Binning-transformed MSR-Dendra dataset comprising 760 MSR-Dendra entries and 17 spike-in validation entries. The length-binned data are normalized independently for each entry before compilation. (B) Matricized form of the compiled MSR-Dendra dataset. The matrix comprises N × L rows, with each row being the flattened form (X × Y of a given length bin. (C and D) Decomposition of the two-dimensional data from (B) using non-negative matrix factorization with M components (features). (C) The basis feature matrices are reformed to the shape of X × Y × M, with each one of the M slices being a two-dimensional depiction of the basis image. (D) The extracted encoding matrices are reformed to the shape of M × L × N. For each entry (strain), the input length-binned data are reduced to M feature profiles, with each profile being the length-resolved (L) feature weights. (E) For each length bin (L in total), a pairwise similarity matrix (Pearson correlation coefficient) of the N entries is generated using feature weights from (D). (F) Illustration of the composite network rendered by similarity network fusion. (G) Illustration of color-coded length-resolved feature dynamics superimposed on the composite network (Video S4).
Figure 3.
Figure 3.. GEMATRIA unveils biologically relevant features
(A) Symmetric features indicative of diverse compartments of the protein localization network. Top panels depict the two-dimensional feature properties. Bottom panels highlight network nodes of high feature weights. (B) Pairs of asymmetric features highlighting similar but not identical regions of the network. (C) GEMATRIA discriminates proteins of varied degrees of axial symmetry. The major and the minor cell pole association is assessed using features 4 and 6, respectively. Similarly, features 13 and 16 are used to evaluate peri-polar association. The scattered dots and the horizontal and vertical sticks represent the means and the standard deviation of corresponding features. Scale bar, 5 μm. (D) Bar charts illustrating the mean feature weights (features 1, 2, 7, and 12) of the 8 validation entries. Error bars denote the standard deviations of corresponding feature weights over the 10 length bins. (E) SAFE reveals three major functional domains of the composite network. The smoothened convex hull of each functionally enriched subgraph is enclosed by a dashed line. The color opacity levels represent the Euclidean density of significantly enriched nodes. The sizes of the nodes denote the FDR-corrected p values by hypergeometric test, as specified in the bottom right panel.
Figure 4.
Figure 4.. Mycobacterial ribosomes are excluded from the cell poles
(A) SAFE revealed subdomains that are enriched for ribosomal proteins. The sizes of the nodes denote the FDR-corrected p values, as demonstrated in the top left panel. Ribosomal protein localization consensus is created as described in STAR Methods and depicted over the top left corner of (A). (B) Zoom-in view of the ribosomal protein-enriched subdomain in (A). (C) Example microscopy images of ribosomal proteins (top panels) and co-clustered neighbor entries (bottom panels). (D) Representative slices of RplU (MSMEG_1364) time-lapse imaging data. The progression of ribosomes being excluded from a maturing new pole is highlighted by white arrowheads. (E) Schematic of differential antibiotic treatments on cells expressing fluorescently marked ribosomes (RplU) or RNA polymerases (RpoZ). (F) Representative images of RplU- or RpoZ-Dendra-expressing cells after 3 h exposure to 50 μg/mL chloramphenicol, 100 μg/mL rifampicin, 5 μg/mL bedaquiline, or 1:200× diluted DMSO. (G) Rifampicin or chloramphenicol exposure caused polar repletion of diffused ribosomes as indicated by an elevated prevalence of features 4 and 6 (STAR Methods). (H) Unsupervised two-dimensional Uniform Manifold Approximation and Projection (UMAP) representation of single-cell morpho-phenotypes upon differential antibiotic treatment. (I) Two-dimensional UMAP representation of single-cell GEMATRIA feature profiles. The large scatterplot represents the allocation of antibiotic-treated single cells in UMAP space with individual cells color coded by their strain identities. UMAP projections of different treatment groups are plotted on the right. The two outlined dots represent the geometric centers of DMSO cells in UMAP space. The direction of antibiotic-induced changes in UMAP space is denoted by color-coded arrows pointing from the geometric centers of DMSO-treated cells to that of the antibiotic-treated cells.
Figure 5.
Figure 5.. Spatial co-occurrence of functionally associated mycobacterial membrane proteins
(A) Structural components of OXPHOS complex I, III, IV, and V tightly cluster in the membrane domain. (B) Zoom-in view of the OXPHOS component-enriched subdomain in (A). (C) Example microscopy images of proteins from complex I, III, IV, and V (Ndh, CtaI, QcrB, and AtpG, respectively). (D) Binary classification of membrane and cytosolic proteins using a Gaussian mixture model and feature 2 profiles (STAR Methods). (E) ATP biosynthesis proteins exhibit significantly lower polar (features 4 and 6) prevalence compared with other membrane proteins, the averaged features 4 and 6 values of OXPHOS components and the remnant membrane protein entries are used to perform Mann-Whitney U (MWU) tests, the p values of which are overlayed with the corresponding histograms. (F) Representative slices of QcrB (MSMEG_4263) time-lapse imaging data. Polar exclusion of QcrB is highlighted with white arrowheads. (G and H) (G) Full-scale (H) and zoom-in view of the subdomain enriched for IMD proteins. Biochemically discovered IMD proteins are highlighted in red, their closely associated neighbors are labeled in blue. (I) Example microscopy images of novel IMD-associated proteins identified in this study. Protein complex localization consensuses are created as described in STAR Methods and depicted on the top left corners of (A and G).
Figure 6.
Figure 6.. GEMATRIA empowers pseudo-temporal reconstruction of mycobacterial mid-cell protein dynamics from still image data
(A) Illustrations of length-binned fluorescence patterns of DnaE1, FtsZ, FtsW, and MmpL3. (B) Time-lapse kymographs (STAR Methods) of DnaE1, FtsZ, FtsW, and MmpL3. (C) Mid-cell dynamics of proteins in (A). estimated by GEMTRIA (red lines) or directly calculated from time-lapse kymographs (blue lines) as indicated in Figure S14B. Blue-shaded areas indicate the 95% confidence interval of multi-kymograph analysis. (D) Schematic of sinusoidal modeling of FtsW mid-cell dynamics. Mid-cell dynamics of FtsW (left panels) calculated by the two methods as elucidated in (C) are fitted to a modified sinusoidal function. The results and the parameters of each sinusoidal fit are plotted on the right. A, P, and C denote the amplitude, the phase, and the baseline constant of the sinusoidal model. (E) Sinusoidal phase shifts estimated from GEMATRIA- and kymograph-derived mid-cell dynamics are highly correlated. The fluorescence profiles of strains not listed in (A) and their representative time-lapse images are listed in Figures S14C and S1D, respectively. (F) GEMTRIA-derived mid-cell dynamics correlate with protein function. Top panel: phase-sorted heatmap of length-dependent feature 7 profiles. Entries with short-cell-associated feature 7 enrichment are positioned to the left, and vice versa. Bottom panel: functional labels of the candidate feature 7 variants. The four cell-cycle proteins described in (A) are highlighted in bold red text. Primary annotations (blue dots) were obtained from manually curated GO sets, as listed in Table S3. Additional “cell-cycle” proteins (pink dots) were referenced from Wu et al. (2018). IMD (green dots, referenced from Figure 4H) proteins identified in this study are superimposed over the “metabolism” subset. (G) Illustrations of the length-binned patterns (left), time-lapse kymographs (middle), and the mid-cell dynamics (right) of MSMEG_6928. (H) Representative slices of MSMEG_6928 time-lapse imaging data. Scale bar, 5 μm. (I) MSMEG_6928 and its neighboring genomic regions are highly conserved between Msm and Mtb. (J) CRISPRi silencing of the msmeg_6927–6929 operon and the putative protein partners of MSMEG_6928, wag31, and mmpL3 yield similar morphological outcomes (de Wet et al., 2020). Genes whose protein products reportedly interact with MSMEG_6928 (Belardinelli et al., 2019) are colored red.

References

    1. Aldridge BB, Fernandez-Suarez M, Heller D, Ambravaneswaran V, Irimia D, Toner M, and Fortune SM (2012). Asymmetry and aging of mycobacterial cells lead to variable growth and antibiotic susceptibility. Science 335, 100–104. - PMC - PubMed
    1. Arafat NA, and Bressan S (2017). Hypergraph drawing by force-directed placement. Lect. Notes Comput. Sci 10439, 387–394.
    1. Bakshi S, Choi H, Mondal J, and Weisshaar JC (2014). Time-dependent effects of transcription- and translation-halting drugs on the spatial distributions of the Escherichia coli chromosome and ribosomes. Mol. Microbiol 94, 871–887. - PMC - PubMed
    1. Bakshi S, Choi H, and Weisshaar JC (2015). The spatial biology of transcription and translation in rapidly growing Escherichia coli. Front. Microbiol 6, 1–15. - PMC - PubMed
    1. Bandekar AC, Subedi S, Ioerger TR, and Sassetti CM (2020). Cell-cycle-associated expression patterns predict gene function in mycobacteria. Curr. Biol, 1–11. - PMC - PubMed

Publication types

Substances

LinkOut - more resources