

Drug markets and COVID-19: A spatiotemporal study of drug offence detection rates in Brisbane, Australia
- PMID: 34965491
- PMCID: PMC9759315
- DOI: 10.1016/j.drugpo.2021.103561
Drug markets and COVID-19: A spatiotemporal study of drug offence detection rates in Brisbane, Australia
Abstract
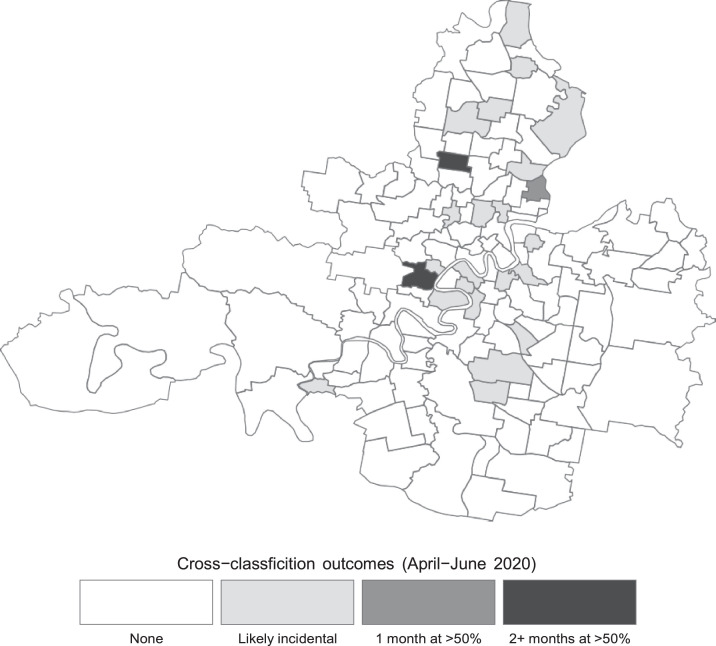
In many parts of the world, the social mobility restrictions and stay-at-home orders introduced during the early months of the COVID-19 pandemic have been associated with significant reductions in crime. However, contrary to this general finding, illicit drug offence detections increased significantly. In this study, we explore the geographical distribution of the increase in Queensland, Australia, using spatiotemporal generalised additive model (GAM) to identify locations in the Local Government Area (LGA) of Brisbane where drug offence detection rates were unusually high during the three months of the COVID-19 lockdown (April-June 2020). Contrary to expectation, we find that the increase in drug offence detection rates appears to have been modest in most places, but widespread and diffuse throughout the city. We conclude that drug offence detections are most likely to have increased incidentally, probably as a consequence of general street policing initiatives which saw an increase in the visibility and vulnerability of drug user communities. We do, however, identify several locations in Brisbane where the drug offence detection rate exceeded the prediction by a considerable margin (in one case, more than double the upper limit of the prediction). We argue that in these locations the increase was likely the result of some spatial displacement of inner-city drug markets coupled with a series of targeted policing activities. Further research is needed to clarify the true mechanism of change in these locations.
Keywords: COVID-19; Drug offence detections; Generalised additive model; Pandemic; Queensland.
Copyright © 2021. Published by Elsevier B.V.
Conflict of interest statement
Declarations of Interest The authors declare that they have no known competing financial interests or personal relationships that could have appeared to influence the work reported in this paper.
Figures


References
-
- Adler P. Columbia University Press; 1993. Wheeling & dealing: An ethnography of an upper-level drug dealing & smuggling community.
-
- Agar M. Seminar Press; 1973. Ripping and running. a formal ethnography of urban heroin addicts.
-
- Arnold J. Drugs in clubs. Drugs in society. 2002;1:2–3.
-
- Ashby M.P.J. Changes in police calls for service during the early months of the 2020 coronavirus pandemic. Policing: A Journal of Policy and Practice. 2020;14(4):1054–1072. doi: 10.1093/police/paaa037. - DOI
MeSH terms
LinkOut - more resources
Full Text Sources
Medical
Miscellaneous
