Increasing Financial Payments From Industry to Medical Oncologists in the United States, 2014-2017
- PMID: 34965511
- PMCID: PMC9309756
- DOI: 10.6004/jnccn.2021.7024
Increasing Financial Payments From Industry to Medical Oncologists in the United States, 2014-2017
Abstract
Background: Personal payments from the pharmaceutical industry to US physicians are common and are associated with changes in physicians' clinical practice and interpretation of clinical trial results. We assessed temporal trends in industry payments to oncologists, with particular emphasis on payments to authors of oncology clinical practice guideline and on payments related to immunotherapy drugs.
Methods: We included US physicians with active National Plan and Provider Enumeration System records and demographic data available in the Centers for Medicare & Medicaid Services Physician Compare system who had a specialty type of medical oncology or general internal medicine. Medical oncologists serving on NCCN Clinical Practice Guidelines in Oncology (NCCN Guidelines) Panels were identified manually. Industry payments, and the subset associated with PD-1/PD-L1 drugs, were identified in Open Payments, the federal repository of all transactions of financial value from industry to physicians and teaching hospitals, from 2014 to 2017.
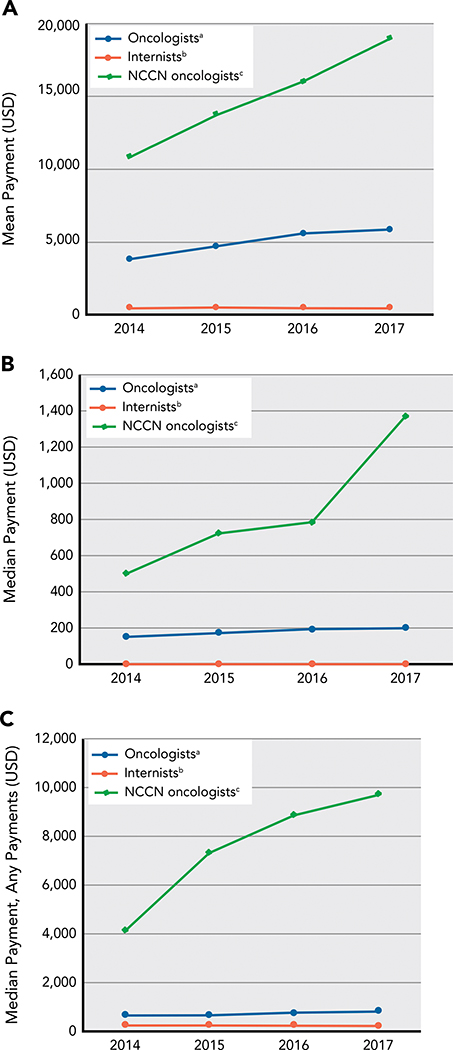
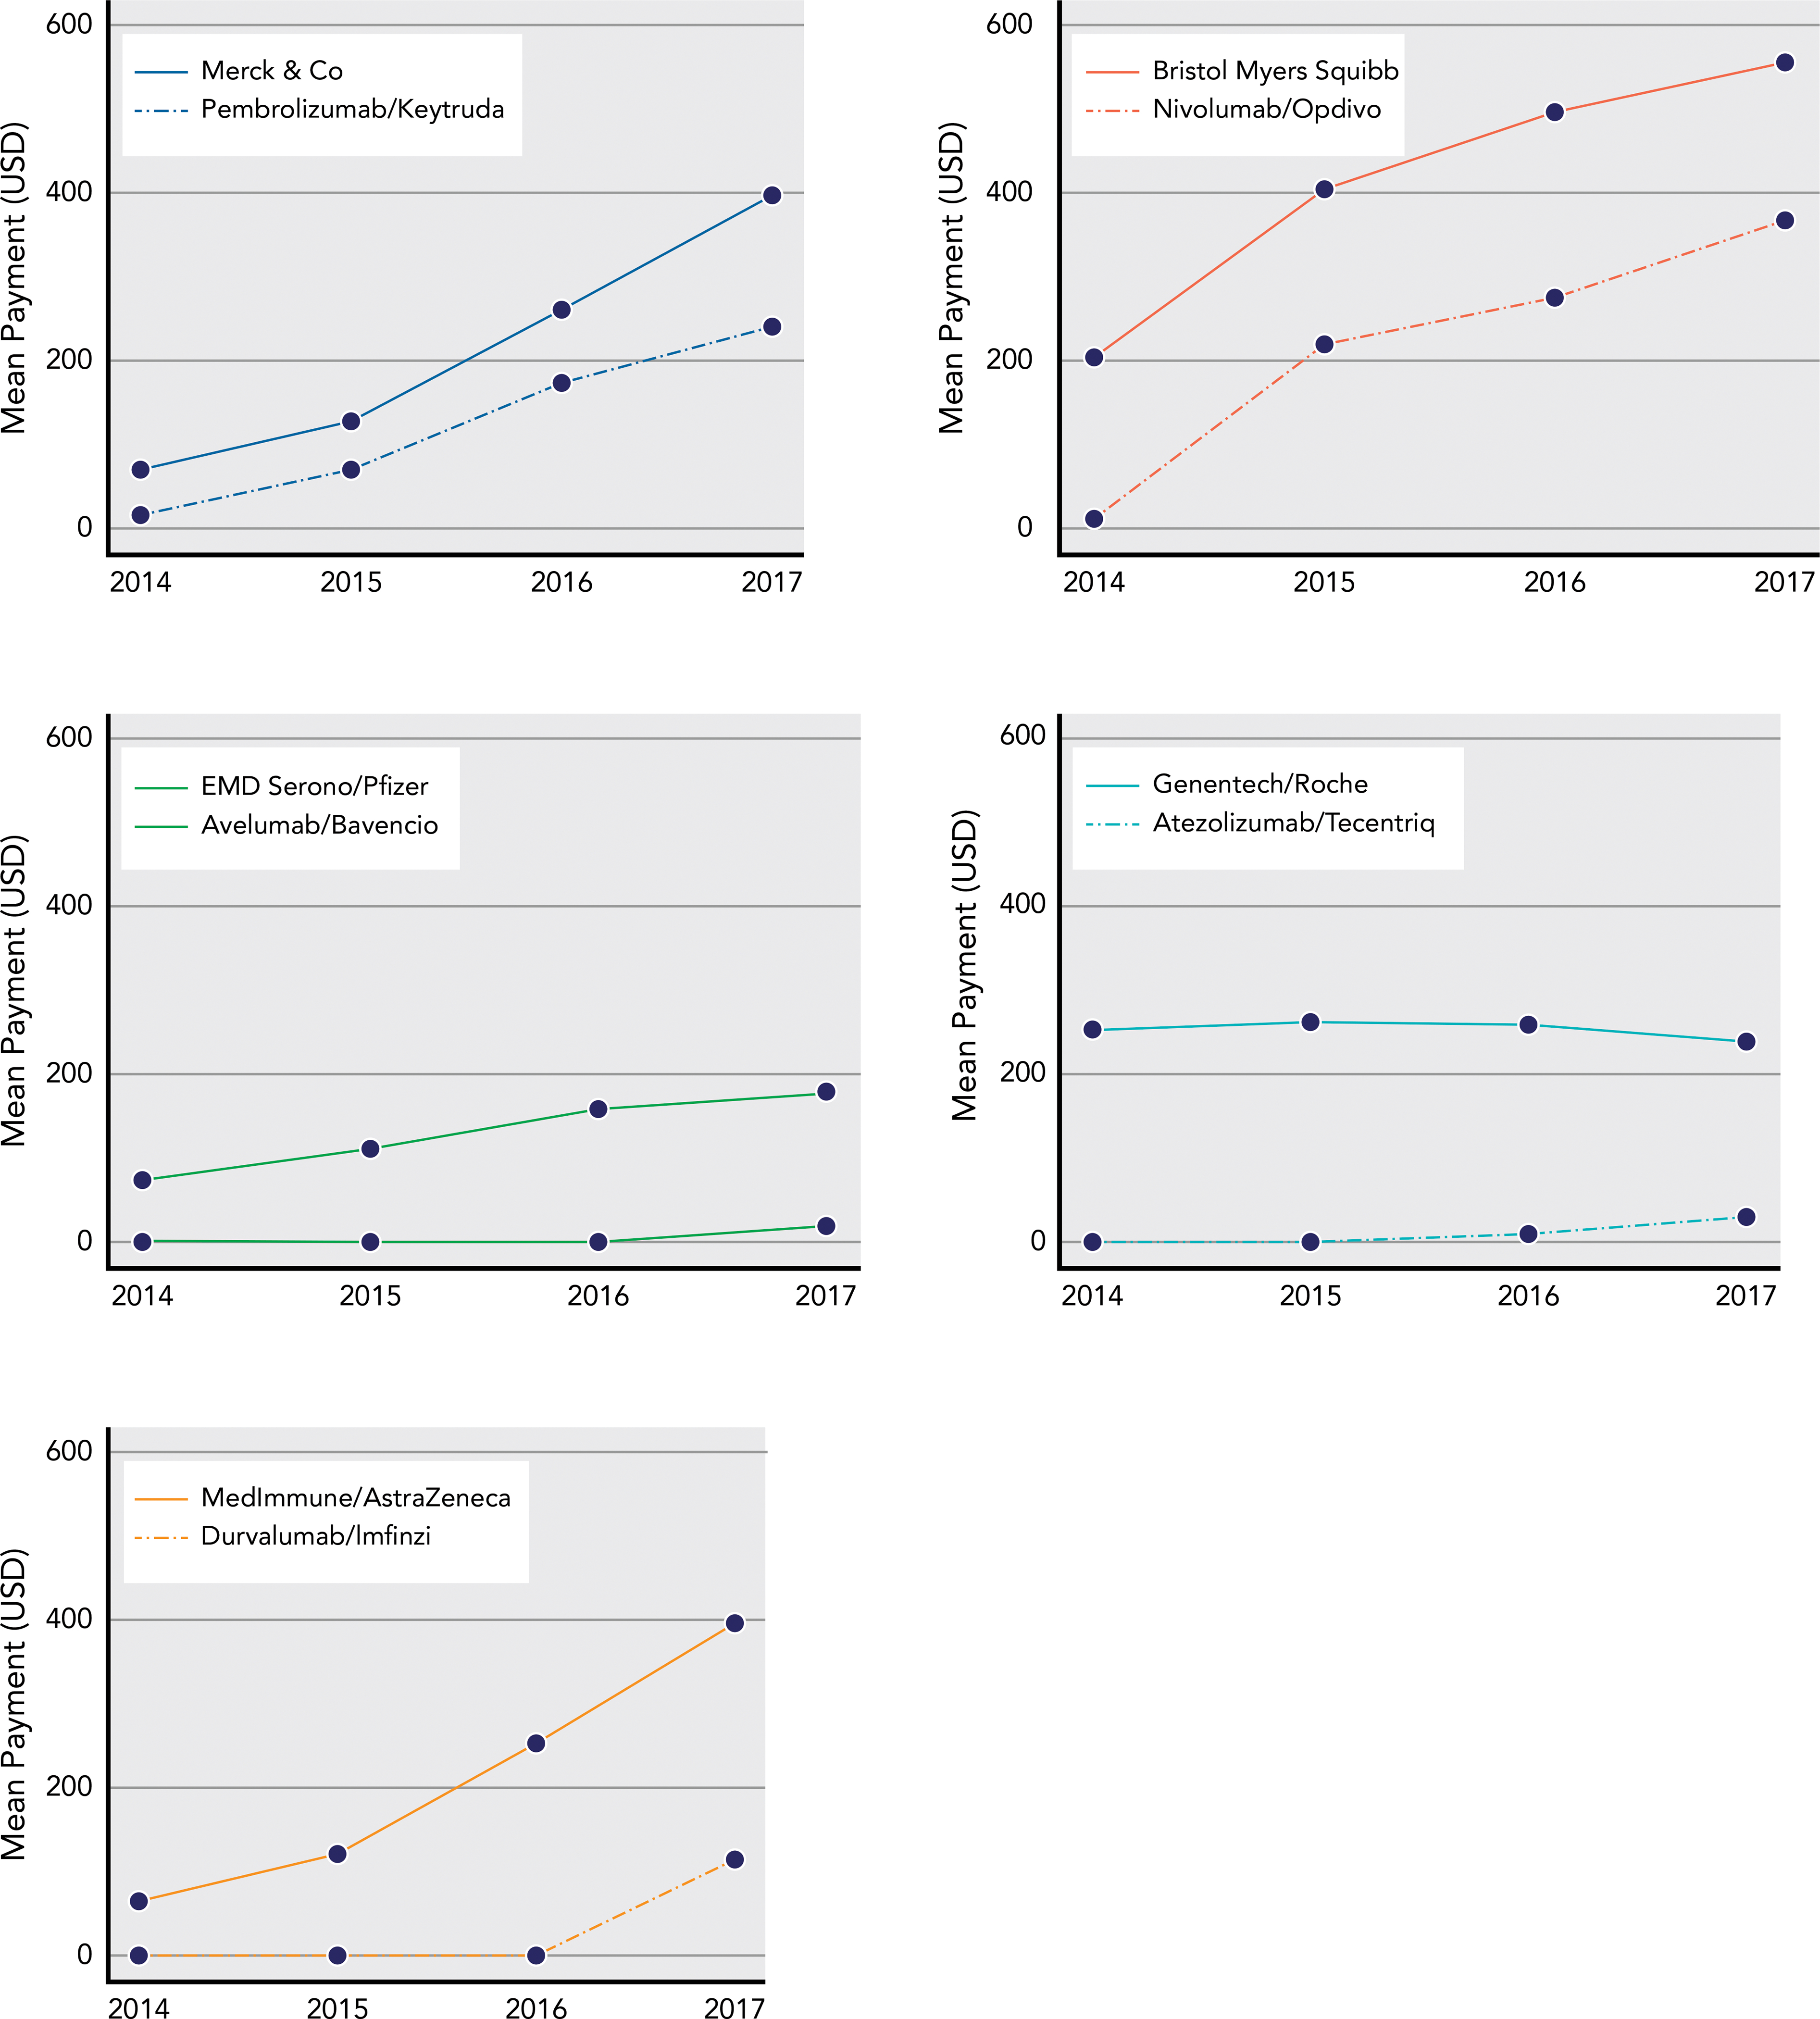
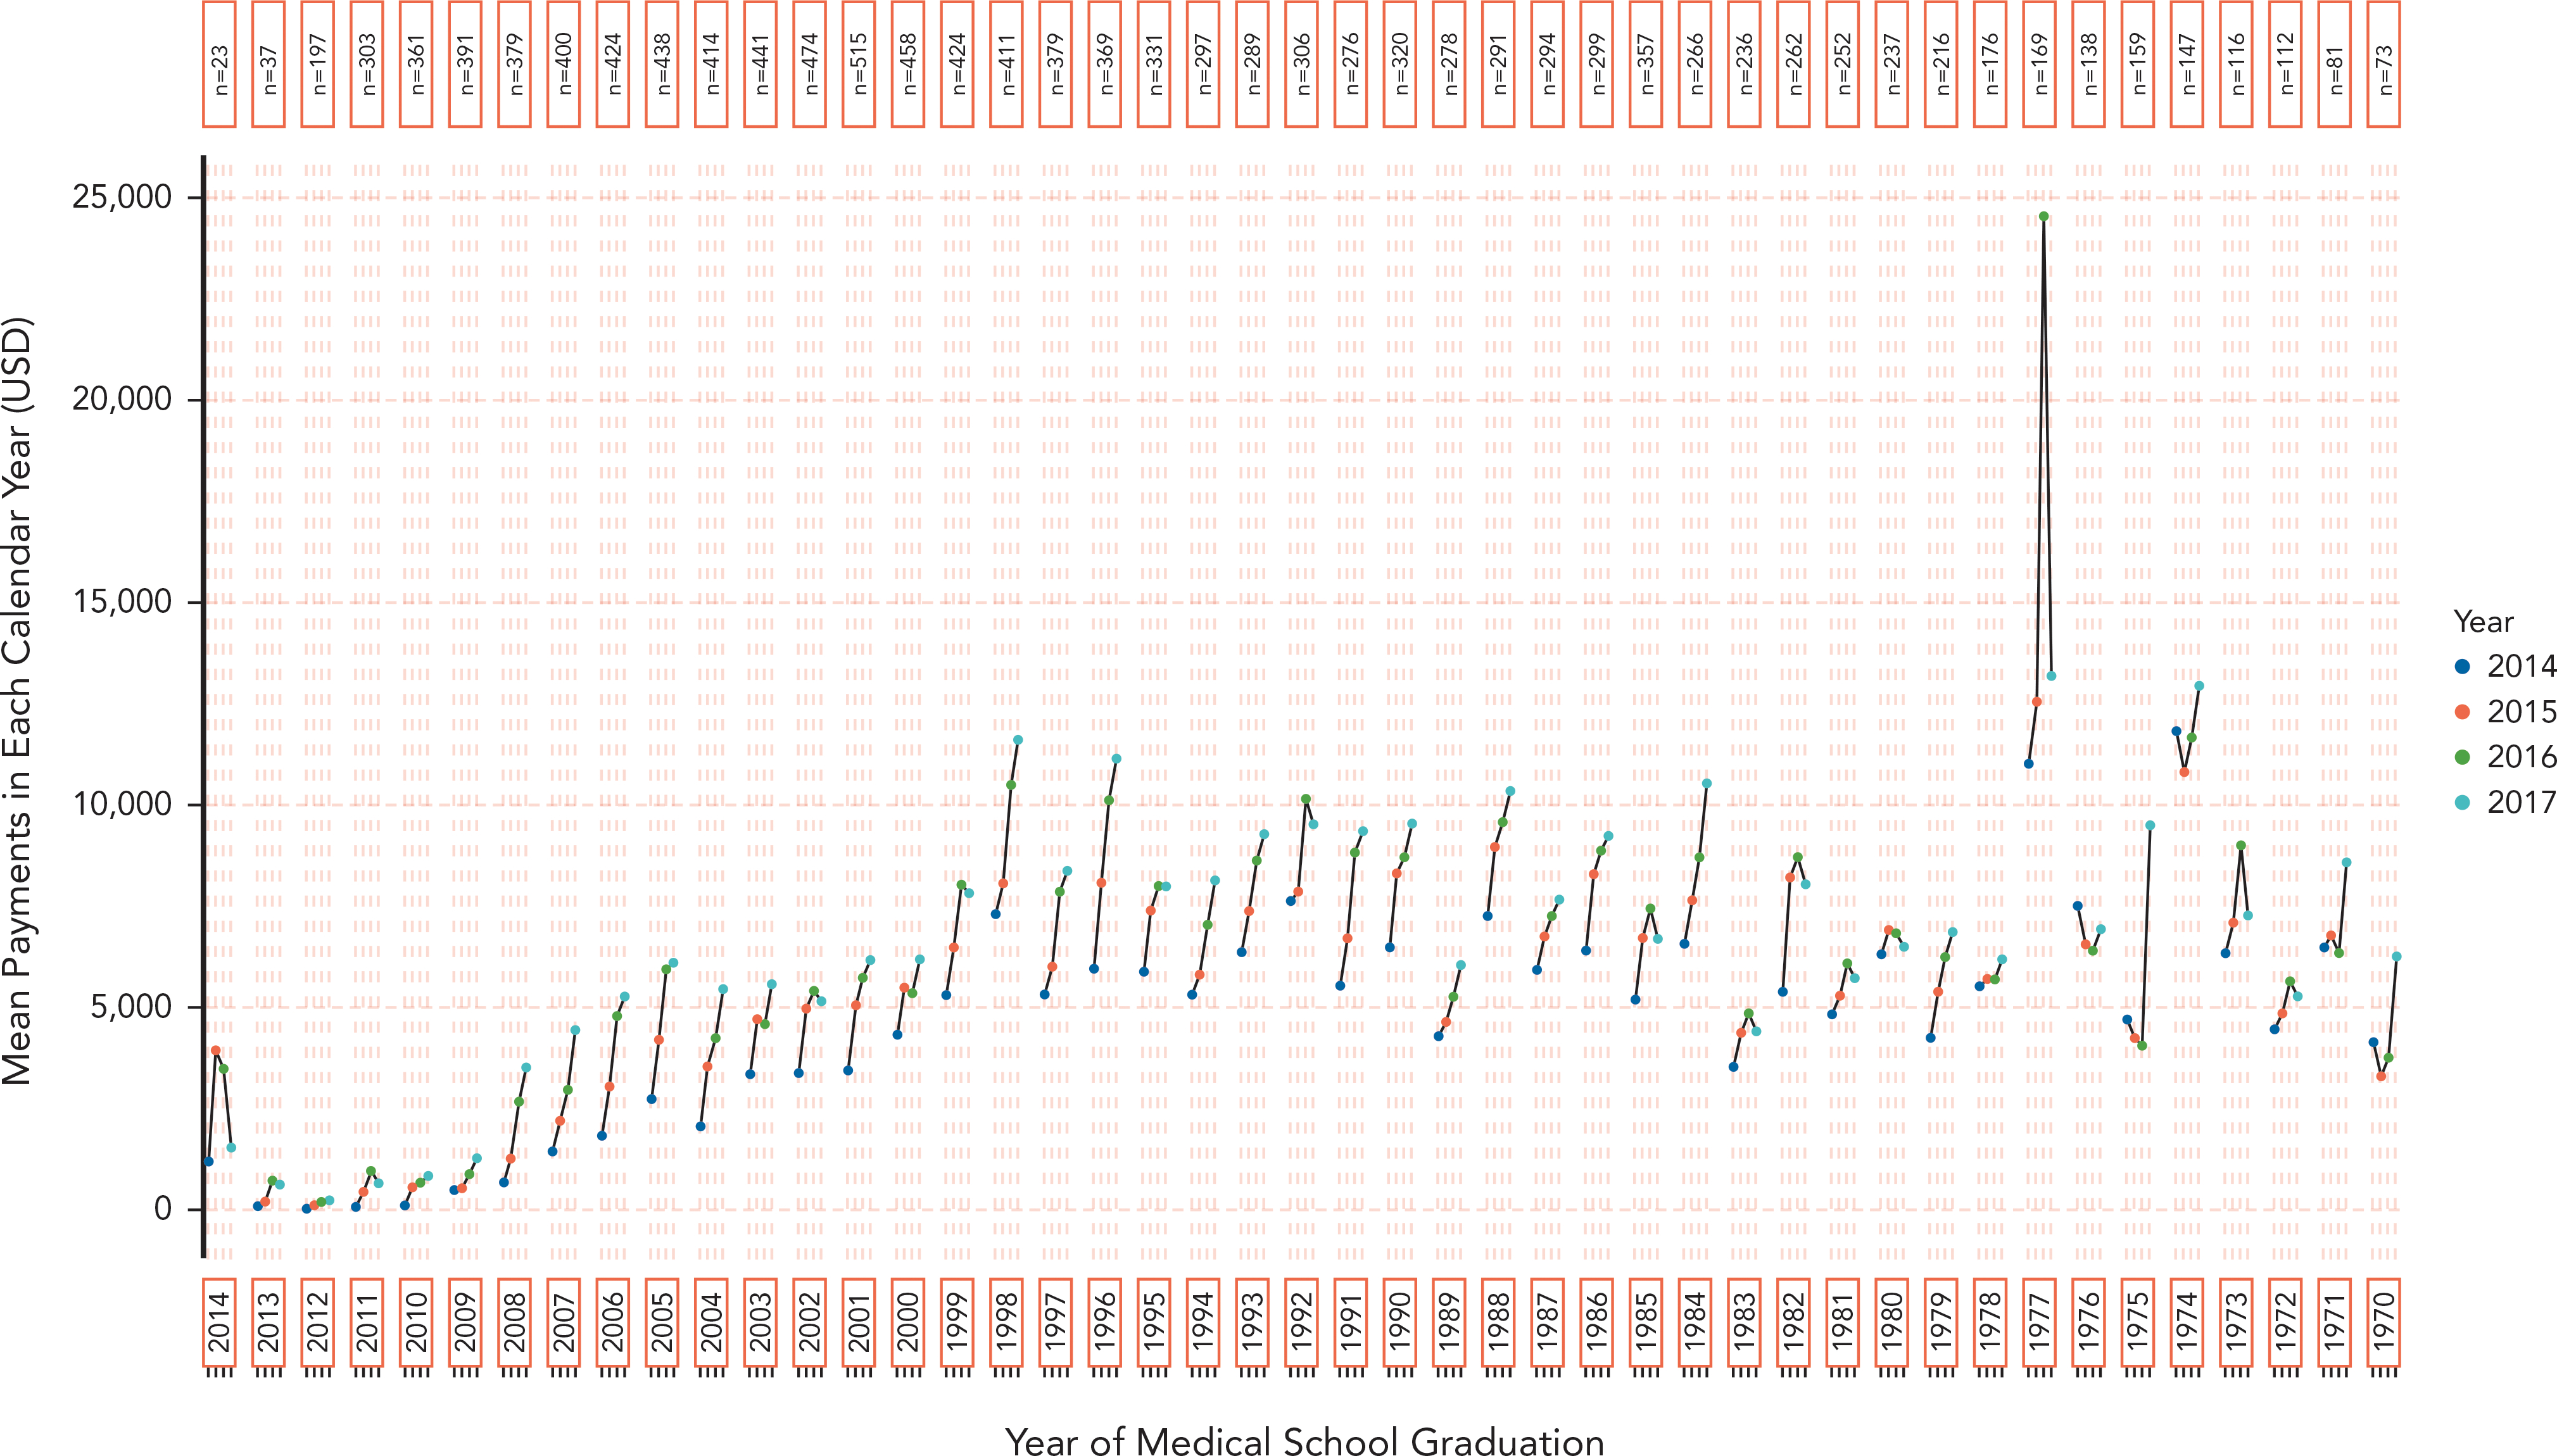
Results: There were 13,087 medical oncologists and 85,640 internists who received payments. The mean, annual, per-physician value of payments to oncologists increased from $3,811 in 2014 to $5,854 in 2017, and from $444 to $450 for internists; the median payment increased from $152 to $199 for oncologists and remained at $0 for internists. Oncologists who served on NCCN Guidelines Panels received a greater value in payments and experienced a greater relative increase: mean payments increased from $10,820 in 2014 to $18,977 in 2017, and median payments increased from $500 to $1,366. Among companies marketing PD-1/PD-L1 drugs, mean annual per-oncologist payments associated with PD-1/PD-L1 drugs increased from $28 to $773. Total per-oncologist payments from companies marketing PD-1/PD-L1 drugs experienced a 165% increase from 2014 to 2017, compared with a 31% increase among similar companies not marketing PD-1/PD-L1 drugs.
Conclusions: Pharmaceutical industry payments increased for US oncologists from 2014 to 2017 more than for general internists. The increase was greater among oncologists contributing to clinical practice guidelines and among pharmaceutical companies marketing PD-1/PD-L1 drugs. The increasing flow of money from industry to US oncologists supports ongoing concern regarding commercial interests in guideline development and clinical decision-making.
Keywords: clinical practice guidelines; conflicts of interest; industry payments; medical ethics; open payments.
Figures
Comment in
-
Physician Interactions With Industry: Striking the Right Balance.J Natl Compr Canc Netw. 2021 Dec 29;20(13). doi: 10.6004/jnccn.2021.7100. J Natl Compr Canc Netw. 2021. PMID: 34965509 No abstract available.
Similar articles
-
Personal Payments from Pharmaceutical Companies to Authors of Oncology Clinical Practice Guidelines.Oncologist. 2021 Sep;26(9):771-778. doi: 10.1002/onco.13823. Epub 2021 May 26. Oncologist. 2021. PMID: 33982829 Free PMC article.
-
Examination of Industry Payments to Radiation Oncologists in 2014 Using the Centers for Medicare and Medicaid Services Open Payments Database.Int J Radiat Oncol Biol Phys. 2016 Jan 1;94(1):19-26. doi: 10.1016/j.ijrobp.2015.09.004. Epub 2015 Sep 16. Int J Radiat Oncol Biol Phys. 2016. PMID: 26547386
-
Distribution and Patterns of Industry-Related Payments to Oncologists in 2014.J Natl Cancer Inst. 2016 Jul 7;108(12):djw163. doi: 10.1093/jnci/djw163. Print 2016 Dec. J Natl Cancer Inst. 2016. PMID: 27389914 Free PMC article.
-
Industry Payments to Adult Reconstruction-Trained Orthopedic Surgeons: An Analysis of the Open Payments Database From 2014 to 2019.J Arthroplasty. 2021 Nov;36(11):3788-3795. doi: 10.1016/j.arth.2021.07.004. Epub 2021 Jul 15. J Arthroplasty. 2021. PMID: 34362596 Review.
-
Assessment of Pharmaceutical Company and Device Manufacturer Payments to Gastroenterologists and Their Participation in Clinical Practice Guideline Panels.JAMA Netw Open. 2018 Dec 7;1(8):e186343. doi: 10.1001/jamanetworkopen.2018.6343. JAMA Netw Open. 2018. PMID: 30646328 Free PMC article. Review.
Cited by
-
Pharmaceutical industry payments and delivery of non-recommended and low value cancer drugs: population based cohort study.BMJ. 2023 Oct 25;383:e075512. doi: 10.1136/bmj-2023-075512. BMJ. 2023. PMID: 37879723 Free PMC article.
-
Physician Payments from Pharmaceutical Companies Related to Cancer Drugs.Oncologist. 2022 Oct 1;27(10):857-863. doi: 10.1093/oncolo/oyac160. Oncologist. 2022. PMID: 35946837 Free PMC article.
-
Characterizing industry payments to US teaching hospitals and affiliated physicians: a cross-sectional analysis of the Open Payments datasets from 2016 to 2022.Health Aff Sch. 2023 Jul 31;1(2):qxad031. doi: 10.1093/haschl/qxad031. eCollection 2023 Aug. Health Aff Sch. 2023. PMID: 38756245 Free PMC article.
-
Trends in enforcement of National Comprehensive Cancer Network financial conflict of interest policy.JNCI Cancer Spectr. 2024 Nov 1;8(6):pkae120. doi: 10.1093/jncics/pkae120. JNCI Cancer Spectr. 2024. PMID: 39589914 Free PMC article.
-
Cancer medicines: a private vice for public benefit?Ecancermedicalscience. 2024 Jan 30;18:ed131. doi: 10.3332/ecancer.2024.ed131. eCollection 2024. Ecancermedicalscience. 2024. PMID: 38425769 Free PMC article.
References
-
- Lo B, Field MJ, eds. Conflict of Interest in Medical Research, Education, and Practice. Washington, DC: National Academies Press; 2009. - PubMed
-
- Mitchell AP, Basch EM, Dusetzina SB. Financial relationships with industry among National Comprehensive Cancer Network Guideline authors. JAMA Oncol 2016;2:1628–1631. - PubMed
Publication types
MeSH terms
Substances
Grants and funding
LinkOut - more resources
Full Text Sources
Research Materials