. 2022 Mar 1;127(3):637-650.
doi: 10.1152/jn.00148.2021. Epub 2021 Dec 29.

No evidence for motor-recovery-related cortical connectivity changes after stroke using resting-state fMRI

Affiliations

No evidence for motor-recovery-related cortical connectivity changes after stroke using resting-state fMRI

Meret Branscheidt et al. J Neurophysiol. .

Abstract

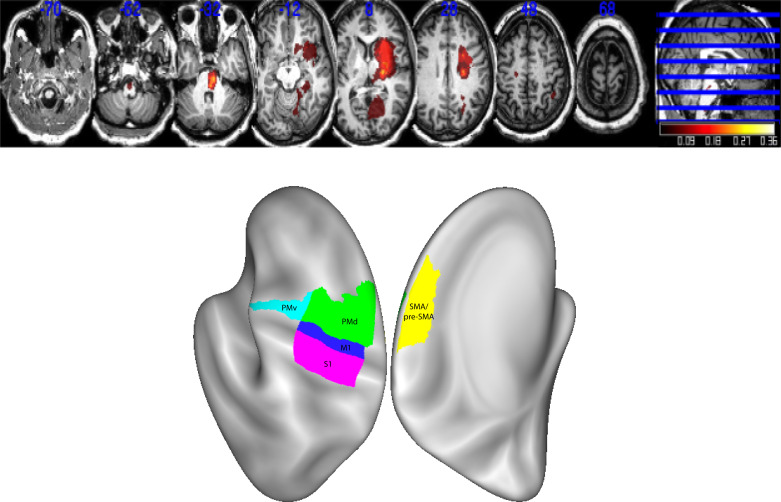
It has been proposed that a form of cortical reorganization (changes in functional connectivity between brain areas) can be assessed with resting-state (rs) functional MRI (fMRI). Here, we report a longitudinal data set collected from 19 patients with subcortical stroke and 11 controls. Patients were imaged up to five times over 1 year. We found no evidence, using rs-fMRI, for longitudinal poststroke cortical connectivity changes despite substantial behavioral recovery. These results could be construed as questioning the value of resting-state imaging. Here, we argue instead that they are consistent with other emerging reasons to challenge the idea of motor-recovery-related cortical reorganization poststroke when conceived of as changes in connectivity between cortical areas.NEW & NOTEWORTHY We investigated longitudinal changes in functional connectivity after stroke. Despite substantial motor recovery, we found no differences in functional connectivity patterns between patients and controls, nor any changes over time. Assuming that rs-fMRI is an adequate method to capture connectivity changes between cortical regions after brain injury, these results provide reason to doubt that changes in cortico-cortical connectivity are the relevant mechanism for promoting motor recovery.

Keywords: cortical reorganization; functional connectivity; motor recovery; resting-state imaging; stroke.


Conflict of interest statement

No conflicts of interest, financial or otherwise, are declared by the authors.

Figures

None
Graphical abstract
Figure 1.
Figure 1.
Lesion distribution (n = 19). Averaged lesion distribution mapped to MNI space with lesions flipped to one hemisphere. Bottom: the surface-based rendering of the regions of interest (ROI). Note that there was one patient with a small bilateral stroke but had only unilateral symptoms. PMd, dorsal premotor cortex; PMv, ventral premotor cortex; SMA, supplementary motor area.
Figure 2.
Figure 2.
Recovery of upper extremity deficits after stroke over 1 year. For all behavioral assessments, the largest changes in recovery were seen within the first 3 mo. Patients reached a plateau at 6 mo and, on average, remained impaired compared with controls at all time-points. Red lines, patients; blue lines, controls; FM-UE, Fugl-Meyer score upper extremity; ARAT, Arm Research Action Test.
Figure 3.
Figure 3.
No systematic differences in connectivity patterns of patients and controls in the early subacute recovery period (W1). A: heat map representation of average connectivity weights for controls and patients at W1. The y- and x-axes show the five regions of interest (ROIs) (S1, M1, PMd, PMv, SMA) for the left and right hemisphere creating a connectivity matrix. Each square represents the connectivity weight for the respective ROI pairing. The diagonal (black) is missing, as it is the correlation of a ROI with itself. B: vectorized upper triangular part of the correlation matrix for the average full connectivity pattern of controls (blue line) and patients (red line). C: null hypothesis test. The distribution of the Euclidean distance between connectivity patterns for controls and patients, as expected under the null hypothesis of no differences (see methods). Green dashed line shows the observed Euclidean distance between patients and controls for W1. The value lies within the 95% of the null hypothesis and therefore outside of the rejection zone of H0. D: equivalence test. Distribution of Euclidean distance is under the assumption of a real difference of Δ* = 1.18. The real value (dashed line) lies in the rejection region of this test, such that we can reject any alternative hypothesis of Δ* > 1.18 at a significance level of P < 0.05. E: the measured Δpatterns (green circle) for the intrahemispheric ipsilesional, contralesional, or interhemispheric ROIs also always fell within the lower 95% percentile of the distribution under the null hypothesis (gray boxes), indicating no significant difference. PMd, dorsal premotor cortex; PMv, ventral premotor cortex; SMA, supplementary motor area.
Figure 4.
Figure 4.
Patients showed a higher nonsystematic variability compared with controls at W1 (Δvariability = green circle, 2.5%–97.5% range = gray boxes). Only for intrahemispheric contralesional regions of interest (ROIs) did patients show lower variability.
Figure 5.
Figure 5.
No significant change from patients’ W1 connectivity pattern compared with time-points at the chronic stage. The green circles show the Euclidean distance between the average connectivity pattern of patients at W1 and the average patterns for patients of all consecutive weeks (W4, W12, W24, and W52). The lower 95th percentile of the distribution under the null hypothesis of no differences between the two weeks is indicated in the gray shaded area.
Figure 6.
Figure 6.
A: M1-M1 connectivity in our data set. In patients, interhemispheric connectivity between the two motor cortices was systematically lower than compared with controls at all time-points. However, no changes of M1-M1 connectivity over time were found. B: relative connectivity (RelCon) of SM1-SM1 in controls and patients. Although there was a significant difference in SM1-SM1 connectivity between the two groups, with lower RelCon for patients, there was no significant change over time.

References

    1. Dancause N, Nudo RJ. Shaping plasticity to enhance recovery after injury. Prog Brain Res 192: 273–295, 2011. doi:10.1016/B978-0-444-53355-5.00015-4. - DOI - PMC - PubMed
    1. Grefkes C, Ward NS. Cortical reorganization after stroke: how much and how functional? Neuroscientist 20: 56–70, 2014. doi:10.1177/1073858413491147. - DOI - PubMed
    1. Nudo RJ. Mechanisms for recovery of motor function following cortical damage. Curr Opin Neurobiol 16: 638–644, 2006. doi:10.1016/j.conb.2006.10.004. - DOI - PubMed
    1. Krakauer JW, Carmichael ST. Broken Movement. Cambridge, MA: MIT Press, 2017.
    1. Overman JJ, Clarkson AN, Wanner IB, Overman WT, Eckstein I, Maguire JL, Dinov ID, Toga AW, Carmichael ST. A role for ephrin-A5 in axonal sprouting, recovery, and activity-dependent plasticity after stroke. Proc Natl Acad Sci USA 109: E2230–E2239, 2012. doi:10.1073/pnas.1204386109. - DOI - PMC - PubMed

Publication types