. 2022 Mar 1;82(5):846-858.
doi: 10.1158/0008-5472.CAN-21-2342.

AMPK-mTOR-Mediated Activation of Autophagy Promotes Formation of Dormant Polyploid Giant Cancer Cells

Affiliations

AMPK-mTOR-Mediated Activation of Autophagy Promotes Formation of Dormant Polyploid Giant Cancer Cells

Bo You et al. Cancer Res. .

Abstract

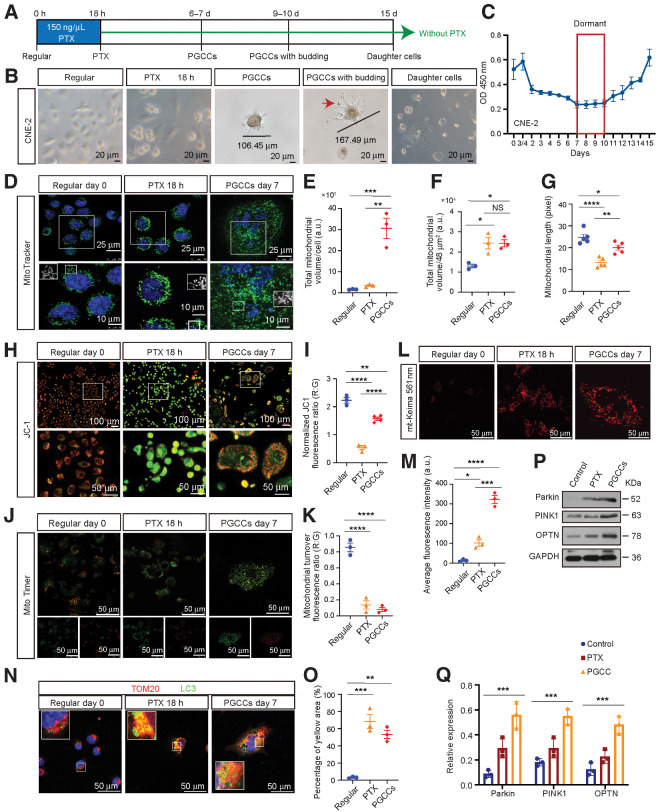
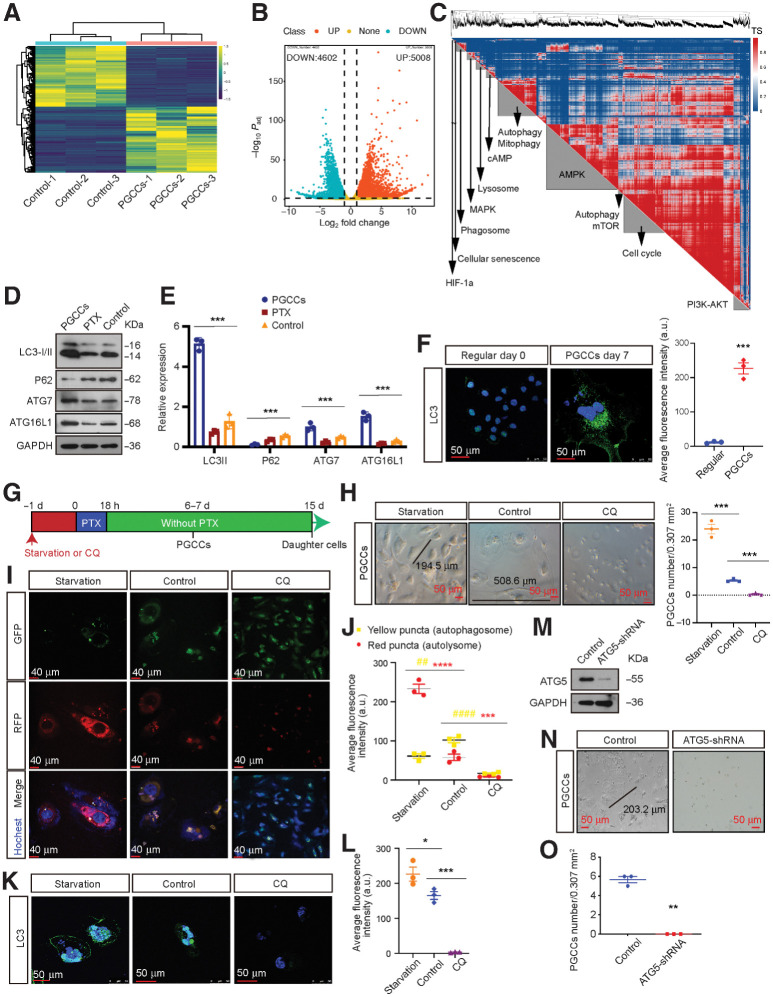
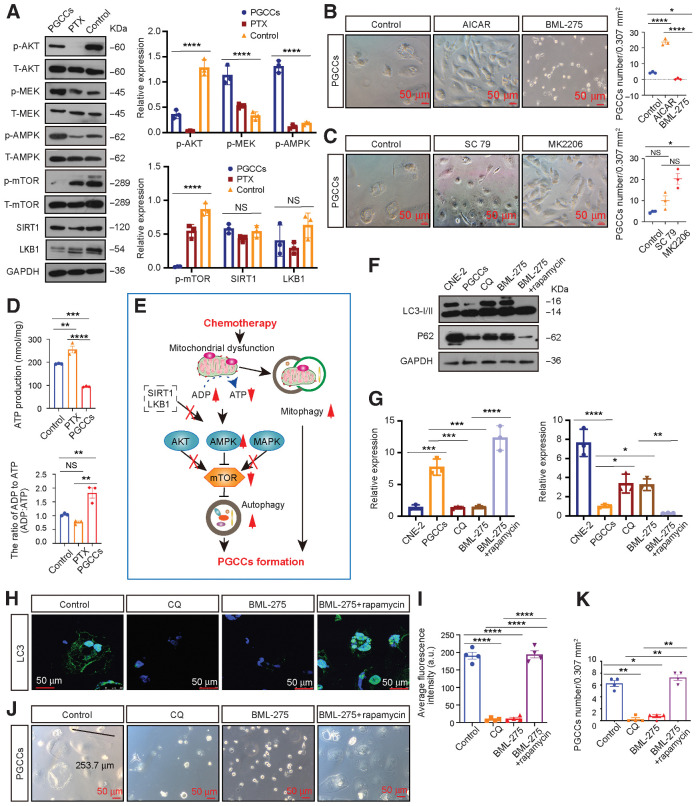
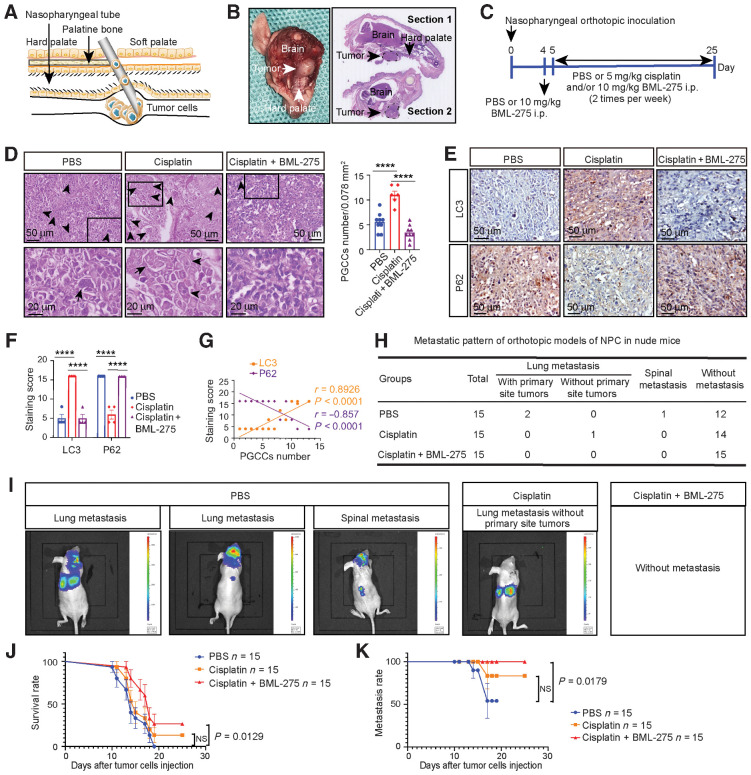
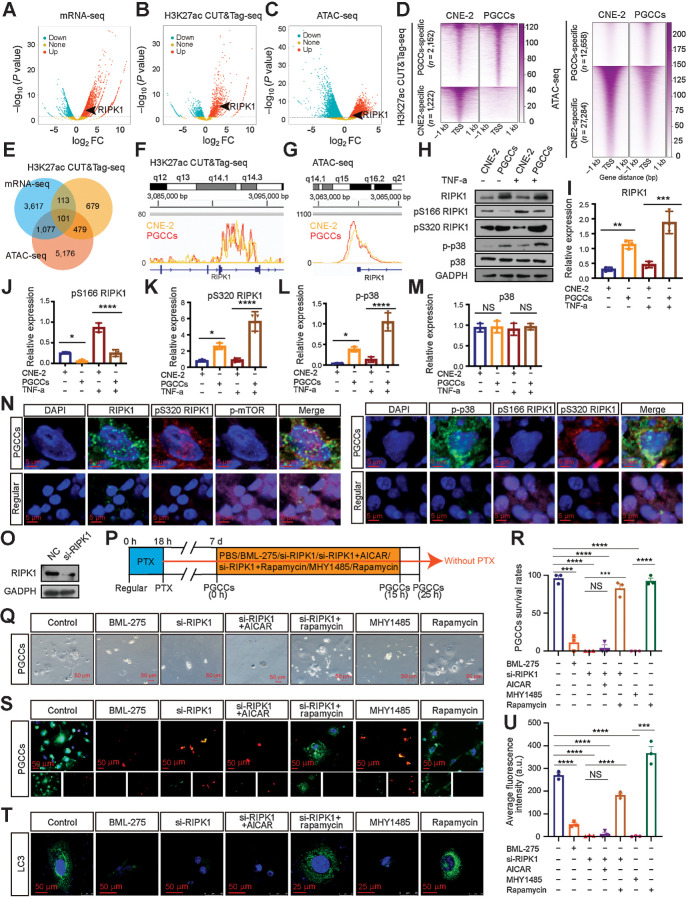
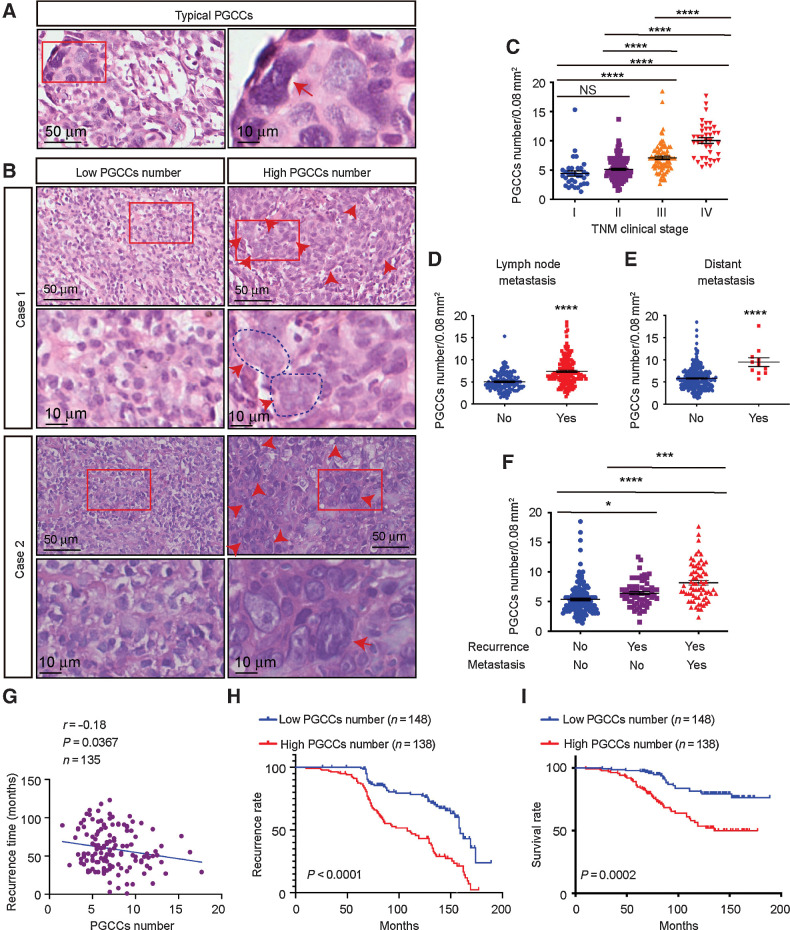
Dormant cancer cells that survive anticancer therapy can lead to cancer recurrence and disseminated metastases that prove fatal in most cases. Recently, specific dormant polyploid giant cancer cells (PGCC) have drawn our attention because of their association with the clinical risk of nasopharyngeal carcinoma (NPC) recurrence, as demonstrated by previous clinical data. In this study, we report the biological properties of PGCC, including mitochondrial alterations, and reveal that autophagy is a critical mechanism of PGCC induction. Moreover, pharmacologic or genetic inhibition of autophagy greatly impaired PGCC formation, significantly suppressing metastasis and improving survival in a mouse model. Mechanistically, chemotherapeutic drugs partly damaged mitochondria, which then produced low ATP levels and activated autophagy via the AMPK-mTOR pathway to promote PGCC formation. Analysis of the transcriptional and epigenetic landscape of PGCC revealed overexpression of RIPK1, and the scaffolding function of RIPK1 was required for AMPK-mTOR pathway-induced PGCC survival. High numbers of PGCCs correlated with shorter recurrence time and worse survival outcomes in patients with NPC. Collectively, these findings suggest a therapeutic approach of targeting dormant PGCCs in cancer.

Significance: Pretreatment with an autophagy inhibitor before chemotherapy could prevent formation of therapy-induced dormant polyploid giant cancer cells, thereby reducing recurrence and metastasis of nasopharyngeal carcinoma.


Figures

Figure 1. Morphologic characteristics, mitochondrial morphology, and function analysis of PGCCs. A, Experimental design for PGCC induction and daughter cell generation in vitro. B, Light phase contrast microscopy images of cells at the indicated time points. Arrow, the mononuclear daughter cells. C, The CCK8 assays were performed to measure cell proliferation. O.D., optical density. D, Mitochondrial morphology was visualized using MitoTracker. E and F, Mitochondrial volume/cell was measured in three fields per group, with three independent replicates. a.u., arbitrary units. G, Mitochondrial length was measured in five fields per group, with three independent replicates. H, Confocal microscopy of mitochondrial membrane potential change with JC-1. Red puncta, maintained mitochondria; green puncta, depolarized mitochondria. I, The quantification of JC-1 results. J, Mitochondrial turnover visualized by MitoTimer transfection and labeling. K, The histogram shows the ratiometric quantification of three independent experiments of 30 cells per group. R:G, red:green. L, Fluorescent images of cells transfected with plasmid mt-Keima (mitophagy reporter). M, Quantification of average fluorescence intensity, with three independent replicates of 30 cells per group. N, IF costaining of TOM20 and LC3. Blue, nucleus; red, TOM20; green, LC3. O, Quantification of the percentage of yellow area. P, Western blot analysis. Q, Gray value analysis of Western blot. All data represent the mean ± SEM of at least three independent experiments. P values were calculated using one-way ANOVA. *, P < 0.05; **, P < 0.01; ***, P < 0.001; ****, P < 0.0001; NS, not significant. PTX, paclitaxel.
Figure 1.
Morphologic characteristics, mitochondrial morphology, and function analysis of PGCCs. A, Experimental design for PGCC induction and daughter cell generation in vitro. B, Light phase contrast microscopy images of cells at the indicated time points. Arrow, the mononuclear daughter cells. C, The CCK8 assays were performed to measure cell proliferation. O.D., optical density. D, Mitochondrial morphology was visualized using MitoTracker. E and F, Mitochondrial volume/cell was measured in three fields per group, with three independent replicates. a.u., arbitrary units. G, Mitochondrial length was measured in five fields per group, with three independent replicates. H, Confocal microscopy of mitochondrial membrane potential change with JC-1. Red puncta, maintained mitochondria; green puncta, depolarized mitochondria. I, The quantification of JC-1 results. J, Mitochondrial turnover visualized by MitoTimer transfection and labeling. K, The histogram shows the ratiometric quantification of three independent experiments of 30 cells per group. R:G, red:green. L, Fluorescent images of cells transfected with plasmid mt-Keima (mitophagy reporter). M, Quantification of average fluorescence intensity, with three independent replicates of 30 cells per group. N, IF costaining of TOM20 and LC3. Blue, nucleus; red, TOM20; green, LC3. O, Quantification of the percentage of yellow area. P, Western blot analysis. Q, Gray value analysis of Western blot. All data represent the mean ± SEM of at least three independent experiments. P values were calculated using one-way ANOVA. *, P < 0.05; **, P < 0.01; ***, P < 0.001; ****, P < 0.0001; NS, not significant. PTX, paclitaxel.
Figure 2. Autophagy is activated in PGCCs and promote PGCC formation. A, DEGs were identified using three independent RNA-seq experiments. B, Upregulated and downregulated DEGs. C, DEG genetic cosimilarity map. Representative pathways enriched in A cluster are shown on the diagonal axis (FDR < 1%). TS, topology similarity. D, Western blot analysis of autophagy-related genes levels. E, Gray value analysis of Western blot. F, Left, IF detection of endogenous LC3 puncta. Right, total number of endogenous LC3 puncta per cell (Student t test). G, Experimental design for investigating the role of autophagy in PGCC formation. H, Left, representative light microscopy images of PGCC formation. Right, quantification of PGCC number (one-way ANOVA). I, Detection of autophagic flux using the mRFP-GFP-LC3 reporter. J, Autophagic flux analysis (two-way ANOVA). K, IF detection of endogenous LC3 puncta. L, Quantification of average fluorescence intensity per cell (one-way ANOVA). M, Interference efficiency was detected by Western blot in cells transfected with lentiviral ATG5-shRNA or mock vector. N, Representative light microscopic images of PGCC formation. O, Quantification of PGCCs number using Student t test. All data represent the mean ± SEM of three independent experiments. P values were calculated using one-way ANOVA or Student t tests or two-way ANOVA. *, P < 0.05; **, P < 0.01; ***, P < 0.001; ****, P < 0.0001. a.u., arbitrary units; CQ, chloroquine.
Figure 2.
Autophagy is activated in PGCCs and promote PGCC formation. A, DEGs were identified using three independent RNA-seq experiments. B, Upregulated and downregulated DEGs. C, DEG genetic cosimilarity map. Representative pathways enriched in A cluster are shown on the diagonal axis (FDR < 1%). TS, topology similarity. D, Western blot analysis of autophagy-related genes levels. E, Gray value analysis of Western blot. F, Left, IF detection of endogenous LC3 puncta. Right, total number of endogenous LC3 puncta per cell (Student t test). G, Experimental design for investigating the role of autophagy in PGCC formation. H, Left, representative light microscopy images of PGCC formation. Right, quantification of PGCC number (one-way ANOVA). I, Detection of autophagic flux using the mRFP-GFP-LC3 reporter. J, Autophagic flux analysis (two-way ANOVA). K, IF detection of endogenous LC3 puncta. L, Quantification of average fluorescence intensity per cell (one-way ANOVA). M, Interference efficiency was detected by Western blot in cells transfected with lentiviral ATG5-shRNA or mock vector. N, Representative light microscopic images of PGCC formation. O, Quantification of PGCCs number using Student t test. All data represent the mean ± SEM of three independent experiments. P values were calculated using one-way ANOVA or Student t tests or two-way ANOVA. *, P < 0.05; **, P < 0.01; ***, P < 0.001; ****, P < 0.0001. a.u., arbitrary units; CQ, chloroquine.
Figure 3. Autophagy activation promotes PGCC formation by activating AMPK-mTOR signaling. A, Left, Western blot analysis. Right, gray value analysis. B, Left, rescue experiments with PGCC formation. Right, quantification of PGCCs number. C, Left, rescue experiments with PGCC formation. Right, quantification of PGCCs number. D, Relative mitochondrial ATP production and cellular ADP:ATP ratio. E, Schematic overview. F, Western blot analysis. G, Gray value analysis of Western blot. H, Endogenous LC3 puncta were detected using IF. I, Quantification of average fluorescence intensity per cell (one-way ANOVA). J, Rescue experiments for PGCC formation using AMPK-mTOR signaling inhibitors. K, Quantification of PGCC number. All data represent the mean ± SEM of at least three independent experiments. P values were calculated using one-way ANOVA. *, P < 0.05; **, P < 0.01; ***, P < 0.001; ****, P < 0.0001; NS, not significant. CQ, chloroquine.
Figure 3.
Autophagy activation promotes PGCC formation by activating AMPK-mTOR signaling. A, Left, Western blot analysis. Right, gray value analysis. B, Left, rescue experiments with PGCC formation. Right, quantification of PGCCs number. C, Left, rescue experiments with PGCC formation. Right, quantification of PGCCs number. D, Relative mitochondrial ATP production and cellular ADP:ATP ratio. E, Schematic overview. F, Western blot analysis. G, Gray value analysis of Western blot. H, Endogenous LC3 puncta were detected using IF. I, Quantification of average fluorescence intensity per cell (one-way ANOVA). J, Rescue experiments for PGCC formation using AMPK-mTOR signaling inhibitors. K, Quantification of PGCC number. All data represent the mean ± SEM of at least three independent experiments. P values were calculated using one-way ANOVA. *, P < 0.05; **, P < 0.01; ***, P < 0.001; ****, P < 0.0001; NS, not significant. CQ, chloroquine.
Figure 4. AMPK inhibition with BML-275 before chemotherapy prevents metastasis and increases survival rate by preventing PGCC formation. A, Illustration of the tissue details for nasopharyngeal orthotopic implantation. B, Histology of nasopharyngeal orthotopic tumors. Left, gross observation. Right, hematoxylin and eosin staining for tumor locations (dotted black line). C, Schematic of the detailed treatment strategy. D, Left, hematoxylin and eosin analysis of PGCC number in tumor tissues. Arrow, representative PGCC. Right, quantification of PGCC number (one-way ANOVA). E, IHC analysis of tumor LC3 and P62 expression. F, Quantification of IHC staining (one-way ANOVA). G, Pearson correlation between LC3/P62 expression and PGCC number (linear regression). H, Pattern of NPC metastasis. I, Whole-body BLI was used to track tumor metastasis from the orthotopic site. J and K, Kaplan–Meier analysis was used to compare overall survival (J) and overall metastasis (log-rank test; K). All data represent the mean ± SEM of at least three independent experiments. P values were calculated using one-way ANOVA. ****, P < 0.0001; NS, not significant.
Figure 4.
AMPK inhibition with BML-275 before chemotherapy prevents metastasis and increases survival rate by preventing PGCC formation. A, Illustration of the tissue details for nasopharyngeal orthotopic implantation. B, Histology of nasopharyngeal orthotopic tumors. Left, gross observation. Right, hematoxylin and eosin staining for tumor locations (dotted black line). C, Schematic of the detailed treatment strategy. D, Left, hematoxylin and eosin analysis of PGCC number in tumor tissues. Arrow, representative PGCC. Right, quantification of PGCC number (one-way ANOVA). E, IHC analysis of tumor LC3 and P62 expression. F, Quantification of IHC staining (one-way ANOVA). G, Pearson correlation between LC3/P62 expression and PGCC number (linear regression). H, Pattern of NPC metastasis. I, Whole-body BLI was used to track tumor metastasis from the orthotopic site. J and K, Kaplan–Meier analysis was used to compare overall survival (J) and overall metastasis (log-rank test; K). All data represent the mean ± SEM of at least three independent experiments. P values were calculated using one-way ANOVA. ****, P < 0.0001; NS, not significant.
Figure 5. RIPK1 acts as a scaffold to promote PGCC survival by the AMPK-mTOR pathway. A–C, Volcano plot showing the log2-fold change (FC) vs.–log10 (P value) of differential mRNA expression (A), H3K27ac enrichment (B), and ATAC enrichment (C) identified between PGCCs and CNE-2 cells. Significantly up or down are selected according to P < 0.05. D, Heatmap of H3K27ac and ATAC signals at sites unique for PGCCs and CNE-2 cells. Signal density measured ±1 kb from the center regions is defined as tag density/bp. E, Venn diagram. F and G, H3K27ac CUT&Tag-seq signals (F) and ATAC-seq signals (G) at RIPK1 loci. H, Western blot analysis. I–M, Gray value analysis of Western blot. N, IF costaining in PGCCs and regular CNE-2 cells. O, Interference efficiency was detected by Western blot. P, Experimental design for investigating the role of autophagy in PGCC survival. Q, Rescue experiments for PGCC survival. R, Quantification of PGCC number. S, PGCCs viability analysis via LIVE/DEAD Viability assay. Scale bars, 50 μm. T, Endogenous LC3 puncta were detected using IF. U, Quantification of average fluorescence intensity per cell (one-way ANOVA). All data represent the mean ± SEM of at least three independent experiments. P values were calculated using one-way ANOVA. *, P < 0.05; **, P < 0.01; ***, P < 0.001; ****, P < 0.0001; NS, not significant. a.u., arbitrary units; mRNA-seq, mRNA sequencing; PTX, paclitaxel.
Figure 5.
RIPK1 acts as a scaffold to promote PGCC survival by the AMPK-mTOR pathway. AC, Volcano plot showing the log2-fold change (FC) vs.–log10 (P value) of differential mRNA expression (A), H3K27ac enrichment (B), and ATAC enrichment (C) identified between PGCCs and CNE-2 cells. Significantly up or down are selected according to P < 0.05. D, Heatmap of H3K27ac and ATAC signals at sites unique for PGCCs and CNE-2 cells. Signal density measured ±1 kb from the center regions is defined as tag density/bp. E, Venn diagram. F and G, H3K27ac CUT&Tag-seq signals (F) and ATAC-seq signals (G) at RIPK1 loci. H, Western blot analysis. I–M, Gray value analysis of Western blot. N, IF costaining in PGCCs and regular CNE-2 cells. O, Interference efficiency was detected by Western blot. P, Experimental design for investigating the role of autophagy in PGCC survival. Q, Rescue experiments for PGCC survival. R, Quantification of PGCC number. S, PGCCs viability analysis via LIVE/DEAD Viability assay. Scale bars, 50 μm. T, Endogenous LC3 puncta were detected using IF. U, Quantification of average fluorescence intensity per cell (one-way ANOVA). All data represent the mean ± SEM of at least three independent experiments. P values were calculated using one-way ANOVA. *, P < 0.05; **, P < 0.01; ***, P < 0.001; ****, P < 0.0001; NS, not significant. a.u., arbitrary units; mRNA-seq, mRNA sequencing; PTX, paclitaxel.
Figure 6. Presence and clinical significance of PGCCs in NPC. A, Representative hematoxylin and eosin staining of typical PGCCs in NPC tissue sections. B, Representative image of PGCCs in NPC tissue microarrays. C–F, PGCC number in different clinical stages (C), lymph node metastases (D), distant metastases (E), and recurrence (F). G, Pearson correlation between recurrence time and PGCC number (linear regression). H and I, Kaplan–Meier analysis was used to compare overall recurrence (H) and overall survival (log-rank test; I). All data represent the mean ± SEM of at least three independent experiments. P values were calculated using one-way ANOVA. *, P < 0.05; ***, P < 0.001; ****, P < 0.0001; NS, not significant.
Figure 6.
Presence and clinical significance of PGCCs in NPC. A, Representative hematoxylin and eosin staining of typical PGCCs in NPC tissue sections. B, Representative image of PGCCs in NPC tissue microarrays. CF, PGCC number in different clinical stages (C), lymph node metastases (D), distant metastases (E), and recurrence (F). G, Pearson correlation between recurrence time and PGCC number (linear regression). H and I, Kaplan–Meier analysis was used to compare overall recurrence (H) and overall survival (log-rank test; I). All data represent the mean ± SEM of at least three independent experiments. P values were calculated using one-way ANOVA. *, P < 0.05; ***, P < 0.001; ****, P < 0.0001; NS, not significant.

References

    1. Zhang L, Huang Y, Hong S, Yang Y, Yu G, Jia J, et al. . Gemcitabine plus cisplatin versus fluorouracil plus cisplatin in recurrent or metastatic nasopharyngeal carcinoma: a multicentre, randomised, open-label, phase 3 trial. Lancet 2016;388:1883–92. - PubMed
    1. Phan TG, Croucher PI. The dormant cancer cell life cycle. Nat Rev Cancer 2020;20:398–411. - PubMed
    1. Friberg S, Nystrom A. Cancer metastases: early dissemination and late recurrences. Cancer Growth Metastasis 2015;8:43–49. - PMC - PubMed
    1. Gao XL, Zhang M, Tang YL, Liang XH. Cancer cell dormancy: mechanisms and implications of cancer recurrence and metastasis. Onco Targets Ther 2017;10:5219–28. - PMC - PubMed
    1. Endo H, Inoue M. Dormancy in cancer. Cancer Sci 2019;110:474–80. - PMC - PubMed

Publication types

Substances