. 2022 Mar 1;28(5):939-947.
doi: 10.1158/1078-0432.CCR-21-3445.

Long-term Follow-up and Patterns of Response, Progression, and Hyperprogression in Patients after PD-1 Blockade in Advanced Sarcoma

Affiliations

Long-term Follow-up and Patterns of Response, Progression, and Hyperprogression in Patients after PD-1 Blockade in Advanced Sarcoma

Nicholas D Klemen et al. Clin Cancer Res. .

Abstract

Purpose: Programmed cell death protein 1 (PD-1) blockade can mediate objective responses in advanced sarcomas, but their durability has not been established and it is unclear if hyperprogressive disease (HPD) occurs in sarcomas treated with PD-1 inhibitors.

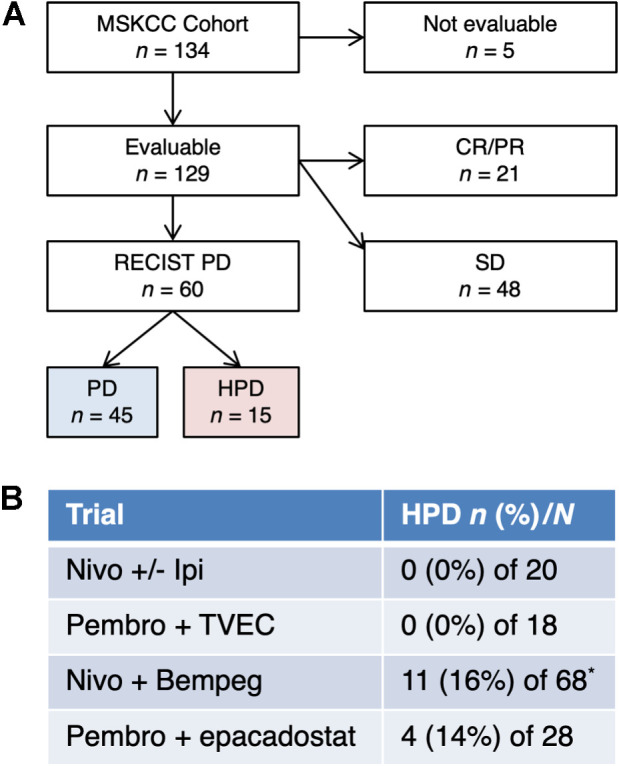
Experimental design: We pooled patients who were treated prospectively with nivolumab or pembrolizumab as monotherapy or with bempegaldesleukin, epacadostat, ipilimumab, or talimogene laherparepvec. We did a new independent assessment for HPD and analyzed clinical, pathologic, and genomic data from baseline tumor biopsies. Our primary endpoint was the incidence of HPD; secondary endpoints were clinical or genomic correlates of response or HPD.

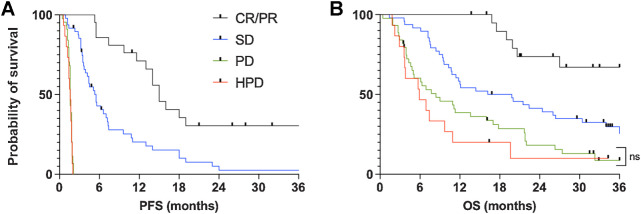
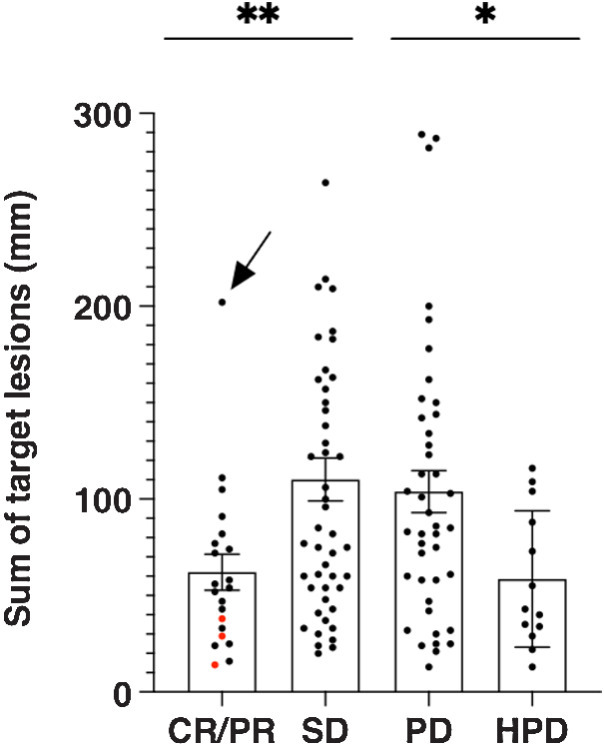
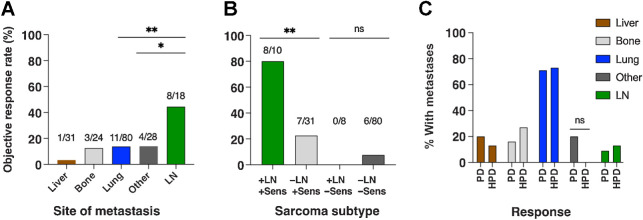
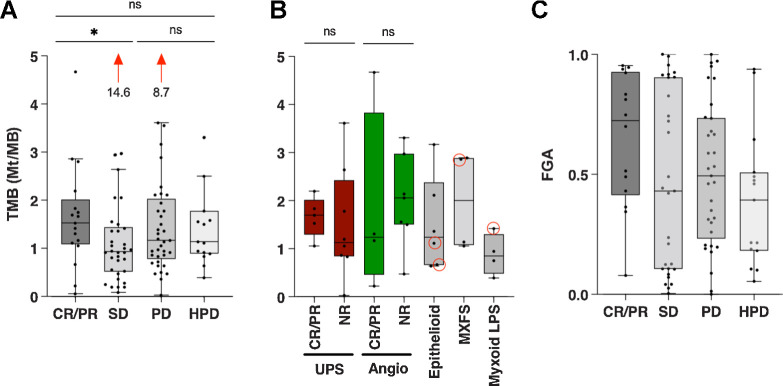
Results: We treated 134 patients with advanced sarcoma from 2015 to 2019. Twenty-one patients (16%) had a complete or partial response (CR/PR), and 30% of responses were durable for over 2 years. Forty-eight (36%) patients had stable disease (SD), 45 (34%) had progressive disease without HPD (PD), and 15 (11%) had HPD. Five patients (4%) were not evaluable for HPD. The sarcoma subtypes, sites of metastasis, clinical course, and genomic alterations in patients with PD and HPD were similar, except HPD tumors were smaller at baseline.

Conclusions: In patients with advanced sarcoma, PD-1 blockade can mediate durable responses. HPD occurs in sarcoma at an incidence that is similar to what has been reported in other solid tumors, but patients with HPD were clinically and biologically similar to those who had PD. Further research is required to establish whether HPD is a biologically distinct phenomenon and whether a theoretical risk of HPD should influence patient management.


Figures

Figure 1. HPD in sarcoma. A, CONSORT diagram for comparison. Five patients were not evaluable. B, Incidence of HPD in each protocol (P = 0.03 by χ2 test). The number of patients with HPD (n, %) and the total number treated on protocol (N) are indicated. Patients who were enrolled on multiple trials were only included once, on the first study. *Five patients in the nivolumab plus bempegaldesleukin trial were not evaluable.
Figure 1.
HPD in sarcoma. A, CONSORT diagram for comparison. Five patients were not evaluable. B, Incidence of HPD in each protocol (P = 0.03 by χ2 test). The number of patients with HPD (n, %) and the total number treated on protocol (N) are indicated. Patients who were enrolled on multiple trials were only included once, on the first study. *Five patients in the nivolumab plus bempegaldesleukin trial were not evaluable.
Figure 2. Outcomes of patients stratified by best response. Kaplan–Meier curves show PFS (A) and OS (B) after the first dose of the study drug. ns, not statistically significant.
Figure 2.
Outcomes of patients stratified by best response. Kaplan–Meier curves show PFS (A) and OS (B) after the first dose of the study drug. ns, not statistically significant.
Figure 3. Response and tumor burden at baseline. Tumor burden is represented by the sum of prospectively recorded target lesions at baseline per RECIST. The 3 patients with complete responses are indicated by red dots. The patient indicated by the arrow had a pleomorphic liposarcoma in the mediastinum. *, P < 0.05; **, P < 0.01.
Figure 3.
Response and tumor burden at baseline. Tumor burden is represented by the sum of prospectively recorded target lesions at baseline per RECIST. The 3 patients with complete responses are indicated by red dots. The patient indicated by the arrow had a pleomorphic liposarcoma in the mediastinum. *, P < 0.05; **, P < 0.01.
Figure 4. Patterns of metastatic spread and response rate. Bars indicate the percentage of patients with metastases in the indicated site that had an objective response. The numbers above each bar show patients with a response over patients evaluable. Some patients had metastases in multiple sites. “Other” metastases include skin and soft tissue, peritoneum, and retroperitoneum. A, Response rate of patients with metastases in the given site. B, Response rate is grouped by the presence or absence of LN metastases and whether the sarcoma subtype was considered immune-sensitive or not. Sensitive subtypes were ASPS, epithelioid sarcoma, myxofibrosarcoma, UPS, and angiosarcoma. C, Distribution of metastases in patients with PD and HPD. LN, lymph node; ns, not statistically significant; Sens, sensitive. *, P < 0.05; **, P < 0.01.
Figure 4.
Patterns of metastatic spread and response rate. Bars indicate the percentage of patients with metastases in the indicated site that had an objective response. The numbers above each bar show patients with a response over patients evaluable. Some patients had metastases in multiple sites. “Other” metastases include skin and soft tissue, peritoneum, and retroperitoneum. A, Response rate of patients with metastases in the given site. B, Response rate is grouped by the presence or absence of LN metastases and whether the sarcoma subtype was considered immune-sensitive or not. Sensitive subtypes were ASPS, epithelioid sarcoma, myxofibrosarcoma, UPS, and angiosarcoma. C, Distribution of metastases in patients with PD and HPD. LN, lymph node; ns, not statistically significant; Sens, sensitive. *, P < 0.05; **, P < 0.01.
Figure 5. Association between response and genomic alterations. Bars show median with 95% confidence intervals. A, TMB is shown for each patient with the given response. The median for CR/PR was 1.5 while for SD it was 0.93 (P = 0.04). Two patients with SD and PD had a TMB of 14.6 and 8.7, respectively. B, TMB is shown between responders (CR/PR) and nonresponders (NR) for UPS and angiosarcoma. The TMB for patients with epithelioid sarcoma, myxofibrosarcoma (MXFS), and myxoid LPS are also shown, with red circles indicating responders. C, FGA is shown as a percentage for each patient. LPS, liposarcoma; MXFS, myxofibrosarcoma.
Figure 5.
Association between response and genomic alterations. Bars show median with 95% confidence intervals. A, TMB is shown for each patient with the given response. The median for CR/PR was 1.5 while for SD it was 0.93 (P = 0.04). Two patients with SD and PD had a TMB of 14.6 and 8.7, respectively. B, TMB is shown between responders (CR/PR) and nonresponders (NR) for UPS and angiosarcoma. The TMB for patients with epithelioid sarcoma, myxofibrosarcoma (MXFS), and myxoid LPS are also shown, with red circles indicating responders. C, FGA is shown as a percentage for each patient. LPS, liposarcoma; MXFS, myxofibrosarcoma.
Figure 6. GSEA of pathways associated with HPD as compared with PD. RNA-seq was performed on baseline tumor biopsies. Bars are a summary of results from GSEA plots with the gene set names from Hallmark pathways and the normalized enrichment score. Positive enrichment score represents pathways that were correlated with HPD while negative enrichment score represents those that were correlated with PD. All gene sets shown had an adjusted P value < 0.05. IFN, interferon.
Figure 6.
GSEA of pathways associated with HPD as compared with PD. RNA-seq was performed on baseline tumor biopsies. Bars are a summary of results from GSEA plots with the gene set names from Hallmark pathways and the normalized enrichment score. Positive enrichment score represents pathways that were correlated with HPD while negative enrichment score represents those that were correlated with PD. All gene sets shown had an adjusted P value < 0.05. IFN, interferon.

Comment in

  • Clin Cancer Res. 28:811.
  • Clin Cancer Res. 28:811.

References

    1. Lindberg RD, Martin RG, Romsdahl MM, Barkley HT. Conservative surgery and postoperative radiotherapy in 300 adults with soft tissue sarcomas. Cancer 1981;47:2391–7. - PubMed
    1. Weitz J, Antonescu CR, Brennan MF. Localized extremity soft tissue sarcoma: improved knowledge with unchanged survival over time. J Clin Oncol 2003;21:2719–25. - PubMed
    1. Billingsley KG, Burt ME, Jara E, Ginsberg RJ, Woodruff JM, Leung DH, et al. Pulmonary metastases from soft tissue sarcoma: analysis of patterns of diseases and postmetastasis survival. Ann Surg 1999;229:602–10. - PMC - PubMed
    1. Tap WD, Wagner AJ, Schöffski P, Martin-Broto J, Krarup-Hansen A, Ganjoo KN, et al. Effect of doxorubicin plus olaratumab vs doxorubicin plus placebo on survival in patients with advanced soft tissue sarcomas: The ANNOUNCE randomized clinical trial. JAMA 2020;323:1266–76. - PMC - PubMed
    1. Seddon B, Strauss SJ, Whelan J, Leahy M, Woll PJ, Cowie F, et al. Gemcitabine and docetaxel versus doxorubicin as first-line treatment in previously untreated advanced unresectable or metastatic soft tissue sarcomas (GeDDiS): a randomized controlled phase III trial. Lancet Oncol 2017;18:1397–410. - PMC - PubMed

Publication types

Substances