. 2022 Mar 15;28(6):1217-1228.
doi: 10.1158/1078-0432.CCR-21-2718.

Impact of Duration of Neoadjuvant Aromatase Inhibitors on Molecular Expression Profiles in Estrogen Receptor-positive Breast Cancers

Affiliations

Impact of Duration of Neoadjuvant Aromatase Inhibitors on Molecular Expression Profiles in Estrogen Receptor-positive Breast Cancers

Milana A Bergamino et al. Clin Cancer Res. .

Abstract

Purpose: Aromatase inhibitor (AI) treatment is the standard of care for postmenopausal women with primary estrogen receptor-positive breast cancer. The impact of duration of neoadjuvant endocrine therapy (NET) on molecular characteristics is still unknown. We evaluated and compared changes of gene expression profiles under short-term (2-week) versus longer-term neoadjuvant AIs.

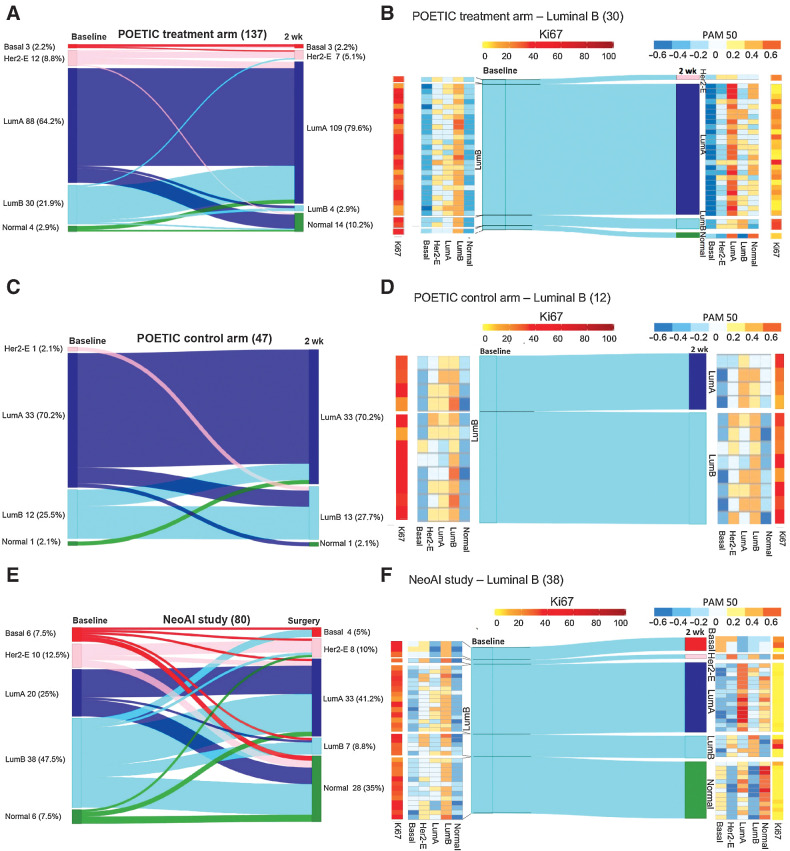
Experimental design: Global gene expression profiles from the PeriOperative Endocrine Therapy for Individualised Care (POETIC) trial (137 received 2 weeks of AIs and 47 received no treatment) and targeted gene expression from 80 patients with breast cancer treated with NET for more than 1 month (NeoAI) were assessed. Intrinsic subtyping, module scores covering different cancer pathways and immune-related genes were calculated for pretreated and posttreated tumors.

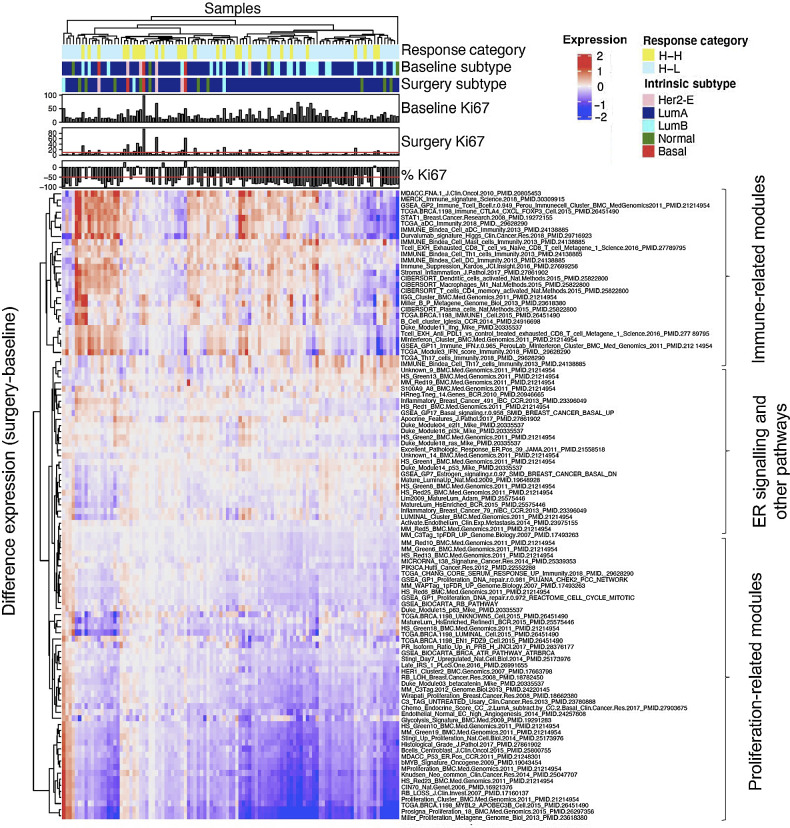
Results: The differences in intrinsic subtypes after NET were comparable between the two cohorts, with most Luminal B (90.0% in the POETIC trial and 76.3% in NeoAI) and 50.0% of HER2 enriched at baseline reclassified as Luminal A or normal-like after NET. Downregulation of proliferative-related pathways was observed after 2 weeks of AIs. However, more changes in genes from cancer-signaling pathways such as MAPK and PI3K/AKT/mTOR and immune response/immune-checkpoint components that were associated with AI-resistant tumors and differential outcome were observed in the NeoAI study.

Conclusions: Tumor transcriptional profiles undergo bigger changes in response to longer NET. Changes in HER2-enriched and Luminal B subtypes are similar between the two cohorts, thus AI-sensitive intrinsic subtype tumors associated with good survival might be identified after 2 weeks of AI. The changes of immune-checkpoint component expression in early AI resistance and its impact on survival outcome warrants careful investigation in clinical trials.


Figures

Figure 1. Differences in intrinsic subtype classification from baseline to surgery in the POETIC subset and the NeoAI study. Changes of intrinsic subtype classifications in all the POETIC-treated samples (A); in POETIC Luminal B–treated samples (B); in POETIC control samples (C); in POETIC Luminal B control samples (D); in all the NeoAI study samples (E), and in NeoAI Luminal B samples (F). Her2-E, Her2 enriched; LumB, Luminal B; LumA, Luminal A; 2 wk, 2-week time point.
Figure 1.
Differences in intrinsic subtype classification from baseline to surgery in the POETIC subset and the NeoAI study. Changes of intrinsic subtype classifications in all the POETIC-treated samples (A); in POETIC Luminal B–treated samples (B); in POETIC control samples (C); in POETIC Luminal B control samples (D); in all the NeoAI study samples (E), and in NeoAI Luminal B samples (F). Her2-E, Her2 enriched; LumB, Luminal B; LumA, Luminal A; 2 wk, 2-week time point.
Figure 2. Module scores expression changes in the POETIC cohort. A, Barplots showing the significant module scores expression changes between baseline and after 2 weeks of AI in the POETIC dataset for all samples, for Luminal B samples only (B) and for controls (C). The x-axis shows the log2FC and the y-axis shows the significant module scores that changed. Bars are colored by the degree of significance of the P value by paired t test. FDR; false discovery rate; log2 FC, log2 fold change.
Figure 2.
Module scores expression changes in the POETIC cohort. A, Barplots showing the significant module scores expression changes between baseline and after 2 weeks of AI in the POETIC dataset for all samples, for Luminal B samples only (B) and for controls (C). The x-axis shows the log2FC and the y-axis shows the significant module scores that changed. Bars are colored by the degree of significance of the P value by paired t test. FDR; false discovery rate; log2 FC, log2 fold change.
Figure 3. Differential single-gene expression changes between baseline and surgery of the 17 genes included in the FOS and JUN module scores in the POETIC cohort. Differential expression in the treated samples from POETIC subset (A) and in the controls (B). In red, there are the significant genes by P values by paired t tests and log2FC. FDR, false discovery rate; log2 FC, log2 fold change; NS, nonsignificant; P, significant by P value paired t tests; P&log2FC, significant by P value and log2 fold change.
Figure 3.
Differential single-gene expression changes between baseline and surgery of the 17 genes included in the FOS and JUN module scores in the POETIC cohort. Differential expression in the treated samples from POETIC subset (A) and in the controls (B). In red, there are the significant genes by P values by paired t tests and log2FC. FDR, false discovery rate; log2 FC, log2 fold change; NS, nonsignificant; P, significant by P value paired t tests; P&log2FC, significant by P value and log2 fold change.
Figure 4. Single-gene expression changes of genes in common between baseline and surgery in the different cohorts. A, Scatterplot of differentially expressed genes between baseline and surgery measured by log2 FC among the entire short-term and long-term AI cohorts. B, Scatterplot of differentially expressed genes between baseline and surgery measured by log2 FC among Luminal B–treated tumors only in the short-term and long-term AI cohorts C, Boxplot showing the intersections of common genes differentially expressed between baseline and surgery among different combinations of subgroups of sample patients within the POETIC and NeoAI cohorts: all treated patients in POETIC, only treated with Luminal A in POETIC, only treated with Luminal B in POETIC, all patients in NeoAI, only Luminal A in NeoAI, only Luminal B patients in NeoAI, only controls in POETIC. FDR, false discovery rate; log2 FC, log2 fold change.
Figure 4.
Single-gene expression changes of genes in common between baseline and surgery in the different cohorts. A, Scatterplot of differentially expressed genes between baseline and surgery measured by log2 FC among the entire short-term and long-term AI cohorts. B, Scatterplot of differentially expressed genes between baseline and surgery measured by log2 FC among Luminal B–treated tumors only in the short-term and long-term AI cohorts C, Boxplot showing the intersections of common genes differentially expressed between baseline and surgery among different combinations of subgroups of sample patients within the POETIC and NeoAI cohorts: all treated patients in POETIC, only treated with Luminal A in POETIC, only treated with Luminal B in POETIC, all patients in NeoAI, only Luminal A in NeoAI, only Luminal B patients in NeoAI, only controls in POETIC. FDR, false discovery rate; log2 FC, log2 fold change.
Figure 5. Unsupervised hierarchical clustering showing the difference on gene expression modules scores from baseline to surgery in the POETIC-treated subset (gene expression changes: surgery-baseline). The module scores shown in this heatmap are those selected at baseline by two unpaired SAM analysis between Ki67 H-H versus H–L, categories in the POETIC subset and annotated by the main categories. ER, estrogen receptor; expression, gene expression; H-H, Ki67 Highbaseline- Ki67 Highsurgery; H-L, Ki67 Highbaseline- Ki67 Lowsurgery; Her2-E, Her2 enriched; LumB, Luminal B; LumA, Luminal A; 2 wk; 2-week time point.
Figure 5.
Unsupervised hierarchical clustering showing the difference on gene expression modules scores from baseline to surgery in the POETIC-treated subset (gene expression changes: surgery-baseline). The module scores shown in this heatmap are those selected at baseline by two unpaired SAM analysis between Ki67 H-H versus H–L, categories in the POETIC subset and annotated by the main categories. ER, estrogen receptor; expression, gene expression; H-H, Ki67 Highbaseline- Ki67 Highsurgery; H-L, Ki67 Highbaseline- Ki67 Lowsurgery; Her2-E, Her2 enriched; LumB, Luminal B; LumA, Luminal A; 2 wk; 2-week time point.
Figure 6. Boxplots showing changes in gene expression from baseline to surgery of the two immune-related signatures (“durvalumab” and “immune-tolerance”) among H-H and H-L Ki67 response categories in the POETIC-treated subset (A) and in the NeoAI study (B). Boxplots showing gene signature expression of the two immune-related signatures at surgery stratified by H-H and H-L tumors in the POETIC-treated subset (C) and in the NeoAI study (D). H-H, Ki67 Highbaseline- Ki67 Highsurgery; H-L, Ki67 Highbaseline- Ki67 Lowsurgery; Her2-E, Her2 enriched; LumB, Luminal B; LumA, Luminal A; 2 wk, 2-week time point.
Figure 6.
Boxplots showing changes in gene expression from baseline to surgery of the two immune-related signatures (“durvalumab” and “immune-tolerance”) among H-H and H-L Ki67 response categories in the POETIC-treated subset (A) and in the NeoAI study (B). Boxplots showing gene signature expression of the two immune-related signatures at surgery stratified by H-H and H-L tumors in the POETIC-treated subset (C) and in the NeoAI study (D). H-H, Ki67 Highbaseline- Ki67 Highsurgery; H-L, Ki67 Highbaseline- Ki67 Lowsurgery; Her2-E, Her2 enriched; LumB, Luminal B; LumA, Luminal A; 2 wk, 2-week time point.

References

    1. Selli C, Turnbull AK, Pearce DA, Li A, Fernando A, Wills J, et al. . Molecular changes during extended neoadjuvant letrozole treatment of breast cancer: distinguishing acquired resistance from dormant tumours. Breast Cancer Res 2019;21:2. - PMC - PubMed
    1. Miller TW, Balko JM, Fox EM, Ghazoui Z, Dunbier A, Dowsett M, et al. . ERα-dependent E2F transcription can mediate resistance to estrogen deprivation in human breast cancer. Cancer Discov 2011;1:338–51. - PMC - PubMed
    1. Dunbier AK, Ghazoui Z, Anderson H, Salter J, Nerurkar A, Osin P, et al. . Molecular profiling of aromatase inhibitor – treated postmenopausal breast tumors identifies immune-related correlates of resistance. Clin Cancer Res 2013;19:2775–86. - PubMed
    1. Dowsett M, Ellis MJ, Dixon JM, Gluz O, Robertson J, Kates R, et al. . Evidence-based guidelines for managing patients with primary ER+ HER2− breast cancer deferred from surgery due to the COVID-19 pandemic. NPJ Breast Cancer 2020;6:21. - PMC - PubMed
    1. Sørlie T, Tibshirani R, Parker J, Hastie T, Marron JS, Nobel A, et al. . Repeated observation of breast tumor subtypes in independent gene expression data sets. Proc Natl Acad Sci U S A 2003;100:8418–23. - PMC - PubMed

Publication types

MeSH terms