Review
. 2022 Jan 31;45(1):6-15.
doi: 10.14348/molcells.2021.0204.

Rich Phase Separation Behavior of Biomolecules

Affiliations
Review

Rich Phase Separation Behavior of Biomolecules

Yongdae Shin. Mol Cells. .

Abstract

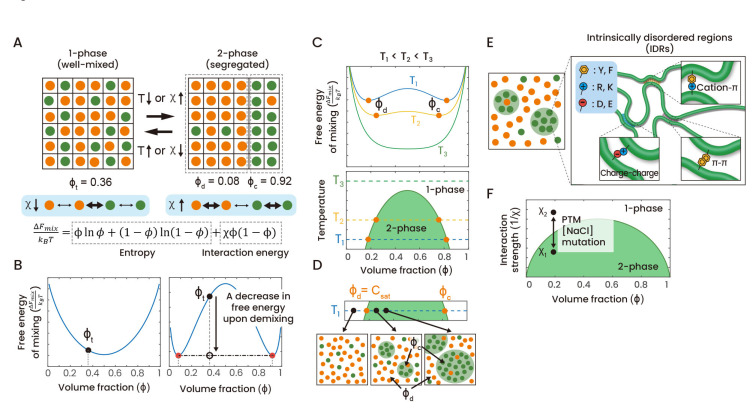
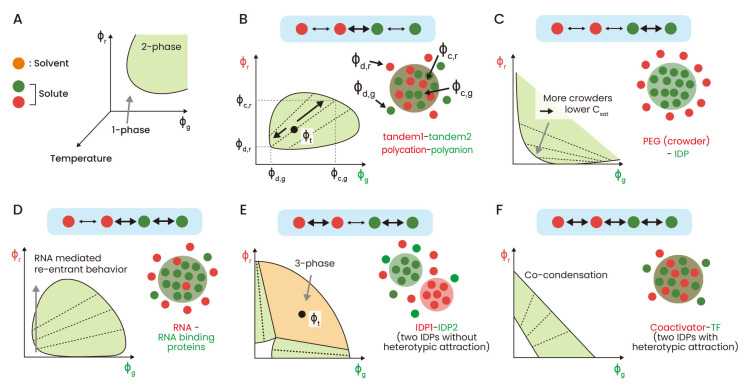
Phase separation is a thermodynamic process leading to the formation of compositionally distinct phases. For the past few years, numerous works have shown that biomolecular phase separation serves as biogenesis mechanisms of diverse intracellular condensates, and aberrant phase transitions are associated with disease states such as neurodegenerative diseases and cancers. Condensates exhibit rich phase behaviors including multiphase internal structuring, noise buffering, and compositional tunability. Recent studies have begun to uncover how a network of intermolecular interactions can give rise to various biophysical features of condensates. Here, we review phase behaviors of biomolecules, particularly with regard to regular solution models of binary and ternary mixtures. We discuss how these theoretical frameworks explain many aspects of the assembly, composition, and miscibility of diverse biomolecular phases, and highlight how a model-based approach can help elucidate the detailed thermodynamic principle for multicomponent intracellular phase separation.

Keywords: condensate; membrane-less organelle; phase diagram; phase separation; regular solution model.


Conflict of interest statement

CONFLICT OF INTEREST

The author has no potential conflicts of interest to disclose.

Figures

Fig. 1
Fig. 1. Binary regular solution model and its phase behaviors.
(A) A binary regular solution model. In the binary system, two types of species, a solute and a solvent, are distributed in each lattice site. The volume fraction of solutes, φ, serves as an important parameter for describing the state of the system. When the system undergoes phase separation into the two-phase state, the system volume is divided into two regions with different volume fractions of solutes. As an example, this figure shows a transition between the single-phase state with a total solute volume fraction, φt, and the two-phase state with volume fractions φd and φc. Interactions between species are characterized by the Flory interaction parameter, χ. When homotypic interactions are favored over heterotypic ones, phase separation can be induced. The free energy of mixing per unit volume, ΔFmix, is given by the sum of entropic contribution and interaction energies. (B) (Left) In the absence of any interactions between species (χ = 0), the compositional dependence of the free energy is convex, leading to the well-mixed single-phase state. (Right) When homotypic interactions are strong enough, the free energy curve becomes concave, and the system can lower the free energy by dividing the system volume into two regions with differing compositions. The solid and empty black circles denote the total free energy of the system before and after phase separation, respectively. Red circles represent solute volume fractions in the dilute and dense phases. (C) Temperature dependence of the free energy and the resulting phase diagram. (Top) For each temperature, the free energy curve determines whether phase separation occurs or not and, if it occurs, volume fractions in two phases (φd and φc) as well. (Bottom) Phase diagrams are typically drawn in the temperature-volume fraction (concentration) plane. (D) In the binary regular solution model, at constant temperature, increasing solute concentration increases the volume of the dense phase while the solute concentrations in two coexisting-phases are fixed to values at the phase boundary. Frequently, a concentration corresponding to the left-hand side boundary of the coexistence region is called the saturation concentration, Csat. (E) Proteins containing intrinsically disordered regions can often phase-separate through homotypic IDR-IDR interactions mediated by charged and/or aromatic residues. (F) The phase diagram of the binary regular solution model can also be plotted in the concentration-interaction parameter plane. Changes in interaction strengths, caused by perturbations such as post-translational modifications, mutations, and varying salt concentrations, can modulate phase separation behavior.
Fig. 2
Fig. 2. Diverse phase behaviors of ternary systems.
(A) With an additional type of solute, the phase diagram of ternary systems becomes three-dimensional, but a two-dimensional slice in the plane of two solute concentrations is typically used. (B) A mixture of two solutes with attractive heterotypic interactions. Examples include pairs of polycation-polyanion or multivalent proteins with tandem modular interaction domains. Each solute alone cannot phase-separate, but addition of the interacting partners can induce phase separation. Throughout Fig. 2, the dotted lines represent tie-lines which describe the direction of phase separation. The points where tie-lines meet the coexistence curve (a loop in the figure) give solute concentrations in coexisting phases. (C) A mixture of a phase-separating solute and a crowder. Increasing the concentration of crowders leads to a decrease in the saturation concentration of the phase-separating solute. Crowders promote phase separation through an excluded volume effect. In this case, the tie-lines are oriented negatively, indicating that the crowders are excluded from the dense phase. (D) A mixture of scaffold-client solutes. The scaffold (green species) is a type of solute that can undergo phase separation alone, and the client (red species) exhibits attractive heterotypic interactions with the scaffold. This feature is reflected in the phase diagram: the 2-phase coexistence region intersects the X-axis corresponding to the absence of clients. Examples of this category include RNA and RNA binding proteins. As clients, RNA enhances phase separation of RNA binding proteins when present at low amounts, but at higher concentrations it ultimately causes dissolution of dense phases. (E) When two solutes exhibit attractive homotypic interactions but minimal heterotypic ones, three distinct phases can coexist. In this case, there are two immiscible dense phases, each of which is primarily enriched with one type of solute. (F) If attractive heterotypic interactions are as strong as homotypic ones, droplets of two solutes become miscible, forming a single dense phase enriched with both types of solutes. An example includes co-condensation of transcription factors (TFs) and coactivators.

References

    1. Aumiller W.M., Jr., Keating C.D., Jr. Phosphorylation-mediated RNA/peptide complex coacervation as a model for intracellular liquid organelles. Nat. Chem. 2016;8:129–137. doi: 10.1038/nchem.2414. - DOI - PubMed
    1. Banani S.F., Rice A.M., Peeples W.B., Lin Y., Jain S., Parker R., Rosen M.K. Compositional control of phase-separated cellular bodies. Cell. 2016;166:651–663. doi: 10.1016/j.cell.2016.06.010. - DOI - PMC - PubMed
    1. Banani S.F., Lee H.O., Hyman A.A., Rosen M.K. Biomolecular condensates: organizers of cellular biochemistry. Nat. Rev. Mol. Cell Biol. 2017;18:285–298. doi: 10.1038/nrm.2017.7. - DOI - PMC - PubMed
    1. Banerjee P.R., Milin A.N., Moosa M.M., Onuchic P.L., Deniz A.A. Reentrant phase transition drives dynamic substructure formation in ribonucleoprotein droplets. Angew. Chem. Int. Ed. Engl. 2017;56:11354–11359. doi: 10.1002/anie.201703191. - DOI - PMC - PubMed
    1. Basu S., Mackowiak S.D., Niskanen H., Knezevic D., Asimi V., Grosswendt S., Geertsema H., Ali S., Jerković I., Ewers H., et al. Unblending of transcriptional condensates in human repeat expansion disease. Cell. 2020;181:1062–1079.e30. doi: 10.1016/j.cell.2020.04.018. - DOI - PMC - PubMed