

High Expression of CEMIP Correlates Poor Prognosis and the Tumur Microenvironment in Breast Cancer as a Promisingly Prognostic Biomarker
- PMID: 34966410
- PMCID: PMC8710689
- DOI: 10.3389/fgene.2021.768140
High Expression of CEMIP Correlates Poor Prognosis and the Tumur Microenvironment in Breast Cancer as a Promisingly Prognostic Biomarker
Abstract
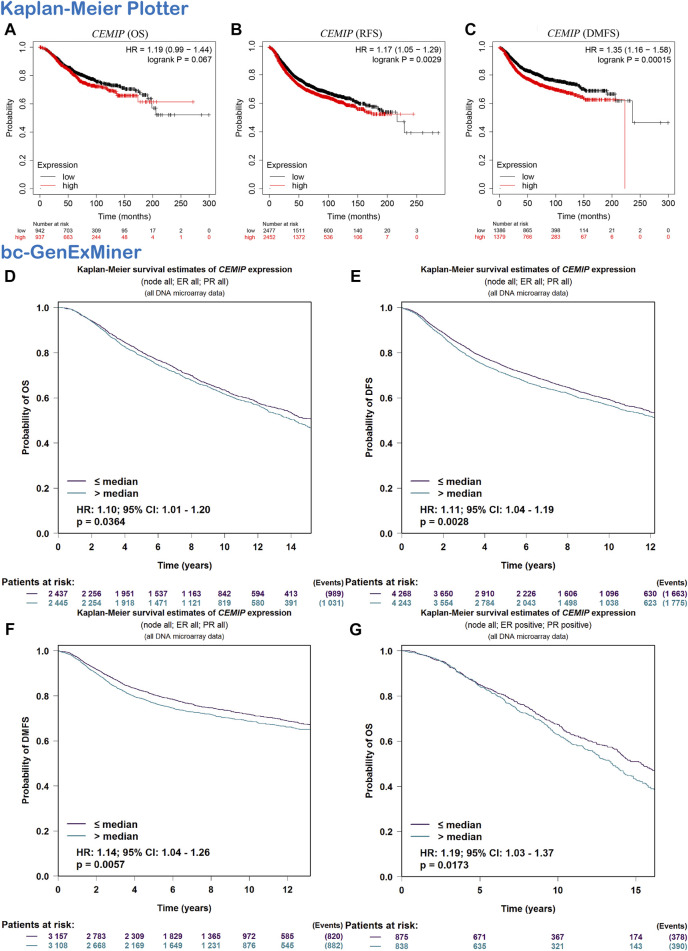
Cell migration-inducing hyaluronidase 1 (CEMIP), a Wnt-related protein and also known as KIAA1199, is implicated in the process of metastatic colonization in a variety of malignant tumors, including breast cancer (BC), which is one of the most frequently diagnosed tumors in women worldwide. In this study, multiple public databases, online analytical tools, and bioinformatics approaches were applied to explore the expression levels, regulatory mechanisms, and biological functions of CEMIP in BC. We illustrated that CEMIP was highly expressed in various kinds of carcinomas, including BC, especially advanced subtypes, and predicted less favorable prognosis (negatively associated with overall survival) in BC patients, which might be an independent prognostic factor. Then, we revealed that the mutation and high expression of CEMIP might lead to it as an oncogene. We also demonstrated that TP53 mutation, DNA hypo-methylation, and the expression changes of three potential upstream transcription factors (EZH2, EGR1, and JUN) of CEMIP were likely to cause the hyperexpression of CEMIP in BC. Moreover, our findings suggested that CEMIP might exert its carcinogenic roles in the tumor microenvironment via participation in the extracellular matrix formation, increasing cancer-associated fibroblast (CAF), M2 macrophage, and neutrophil infiltration and decreasing CD8+ T cell infiltration. In summary, our study provided more solid evidence for CEMIP as a prognostic and metastatic biomarker and a potential therapeutic target in BC. Of course, these findings also need more confirmations of basic experiments and further clinical trials in the future.
Keywords: CEMIP; biomarker; breast cancer; prognosis; tumor microenvironment.
Copyright © 2021 Dong, Yang, Yuan, Hou and Wu.
Conflict of interest statement
The authors declare that the research was conducted in the absence of any commercial or financial relationships that could be construed as a potential conflict of interest.
Figures


Similar articles
-
CEMIP, a Promising Biomarker That Promotes the Progression and Metastasis of Colorectal and Other Types of Cancer.Cancers (Basel). 2022 Oct 18;14(20):5093. doi: 10.3390/cancers14205093. Cancers (Basel). 2022. PMID: 36291875 Free PMC article. Review.
-
CEMIP as a potential biomarker and therapeutic target for breast cancer patients.Int J Med Sci. 2022 Feb 7;19(3):434-445. doi: 10.7150/ijms.58067. eCollection 2022. Int J Med Sci. 2022. PMID: 35370456 Free PMC article.
-
Central Role of CEMIP in Tumorigenesis and Its Potential as Therapeutic Target.J Cancer. 2017 Jul 20;8(12):2238-2246. doi: 10.7150/jca.19295. eCollection 2017. J Cancer. 2017. PMID: 28819426 Free PMC article. Review.
-
Research on the biological mechanism and potential application of CEMIP.Front Immunol. 2023 Aug 18;14:1222425. doi: 10.3389/fimmu.2023.1222425. eCollection 2023. Front Immunol. 2023. PMID: 37662915 Free PMC article. Review.
-
H3K27me3 loss plays a vital role in CEMIP mediated carcinogenesis and progression of breast cancer with poor prognosis.Biomed Pharmacother. 2020 Mar;123:109728. doi: 10.1016/j.biopha.2019.109728. Epub 2019 Dec 14. Biomed Pharmacother. 2020. PMID: 31846842
Cited by
-
Effects of Hyaluronan on Breast Cancer Aggressiveness.Cancers (Basel). 2023 Jul 27;15(15):3813. doi: 10.3390/cancers15153813. Cancers (Basel). 2023. PMID: 37568628 Free PMC article. Review.
-
Adipocyte Glucocorticoid Receptor Inhibits Immune Regulatory Genes to Maintain Immune Cell Homeostasis in Adipose Tissue.Endocrinology. 2023 Sep 23;164(11):bqad143. doi: 10.1210/endocr/bqad143. Endocrinology. 2023. PMID: 37738419 Free PMC article.
-
Bone-matrix mineralization dampens integrin-mediated mechanosignalling and metastatic progression in breast cancer.Nat Biomed Eng. 2023 Nov;7(11):1455-1472. doi: 10.1038/s41551-023-01077-3. Epub 2023 Aug 7. Nat Biomed Eng. 2023. PMID: 37550422
-
Dual effects of radiotherapy on tumor microenvironment and its contribution towards the development of resistance to immunotherapy in gastrointestinal and thoracic cancers.Front Cell Dev Biol. 2023 Oct 3;11:1266537. doi: 10.3389/fcell.2023.1266537. eCollection 2023. Front Cell Dev Biol. 2023. PMID: 37849740 Free PMC article. Review.
-
CEMIP, a Promising Biomarker That Promotes the Progression and Metastasis of Colorectal and Other Types of Cancer.Cancers (Basel). 2022 Oct 18;14(20):5093. doi: 10.3390/cancers14205093. Cancers (Basel). 2022. PMID: 36291875 Free PMC article. Review.
References
LinkOut - more resources
Full Text Sources
Research Materials
Miscellaneous