. 2021;17(12):1396-1401.
doi: 10.1038/s41567-021-01393-y. Epub 2021 Dec 7.

Search for topological defect dark matter with a global network of optical magnetometers

Affiliations

Search for topological defect dark matter with a global network of optical magnetometers

Samer Afach et al. Nat Phys. 2021.

Abstract

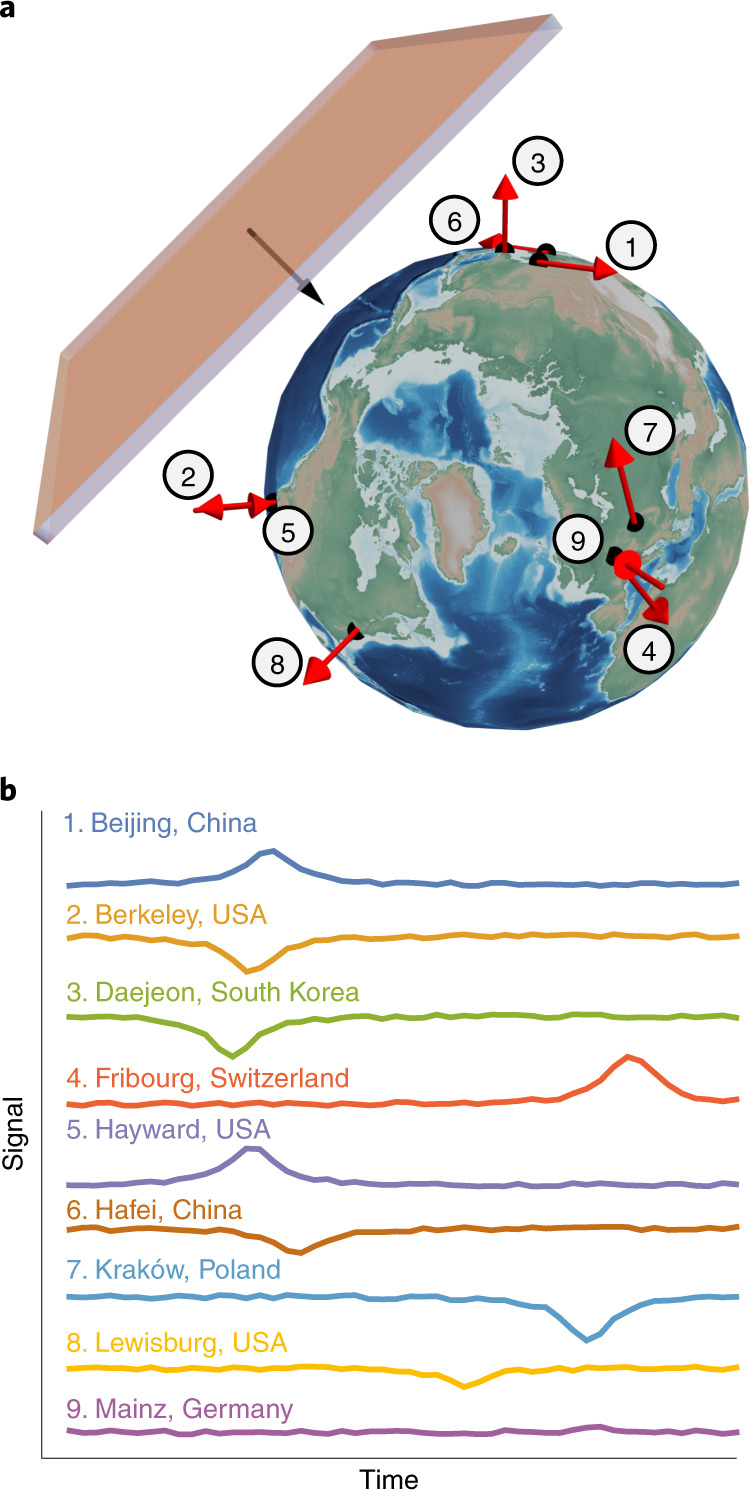
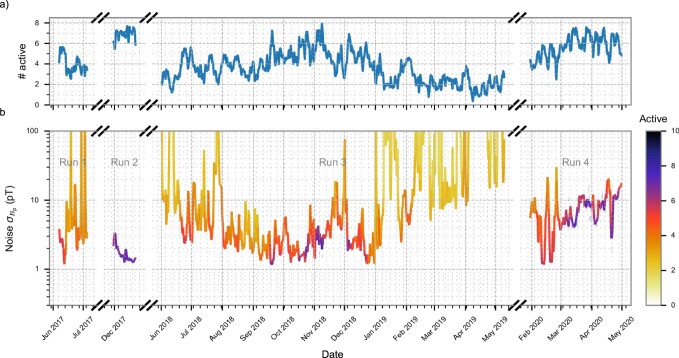
Ultralight bosons such as axion-like particles are viable candidates for dark matter. They can form stable, macroscopic field configurations in the form of topological defects that could concentrate the dark matter density into many distinct, compact spatial regions that are small compared with the Galaxy but much larger than the Earth. Here we report the results of the search for transient signals from the domain walls of axion-like particles by using the global network of optical magnetometers for exotic (GNOME) physics searches. We search the data, consisting of correlated measurements from optical atomic magnetometers located in laboratories all over the world, for patterns of signals propagating through the network consistent with domain walls. The analysis of these data from a continuous month-long operation of GNOME finds no statistically significant signals, thus placing experimental constraints on such dark matter scenarios.

Keywords: Atomic and molecular physics; Dark energy and dark matter; Particle physics.


Conflict of interest statement

Competing interestsThe authors declare no competing interests.

Figures

Fig. 1
Fig. 1. Visualization of an ALP domain-wall crossing.
a, Image showing the Earth together with the position and sensitive axes of the GNOME magnetometers during Science Run 2. Position and sensitive axes are show as red arrows. The crossing direction of the domain wall is represented as a black arrow (Extended Data Table 1). b, Simulation of the signals expected to be observed from a domain-wall crossing at the different magnetometers comprising the network.
Fig. 2
Fig. 2. Significance of the search events.
The blue dashed line represents the cumulative number of events expected from the background in the 23 days of data from Science Run 2. Here 10.7 years of time-shuffled data are used to evaluate the background. Such a duration is an arbitrary choice, but it is sufficiently long to characterize the background. The number of candidate events measured in the background data is re-scaled to the duration of Science Run 2. The solid green line represents the cumulative number of events measured in Science Run 2. The red crosses indicate the magnitude-to-uncertainty ratio at which new events are found in the search data. The upper axis indicates the statistical significance in units of Gaussian standard deviations of finding one event in the search data. The significance is given by the probability of detecting one or more background events at a magnitude-to-uncertainty ratio above that of the candidate event (equation (5)). The right axis shows the normalized number of events over a period of a year. The event with the greatest magnitude-to-uncertainty ratio is found at 12.6. Source data
Fig. 3
Fig. 3. Sensitivity of the GNOME network to domain walls.
Amount of time T, indicated in colour, for which GNOME had a normalized pseudo-magnetic-field-magnitude sensitivity above Bp (that is, the domain wall would induce a magnitude-to-uncertainty ratio of at least one) for domain walls with a given duration Δt (defined as the FWHM of a Lorentzian signal) throughout Science Run 2. The upper axis shows the range of ALP masses to which GNOME is sensitive (equation (9)). The characteristic shape of the sensitive region is a result of the filtering and averaging of the raw data, as described in Methods. Averaging reduces the sensitivity of the search data to short pulse durations and high-pass filtering suppresses sensitivity to long Δt. The sensitivity of GNOME varies in time with changes in the number of active GNOME magnetometers recording data and their background noise. Only the worst-case direction is considered. The plot assumes the parameters of the analysis: 20 s averaging time, 1.67 mHz first-order zero-phase Butterworth filter, and 50 and 60 Hz zero-phase notch filters with a quality factor of 60. Source data
Fig. 4
Fig. 4. Bounds on the ALP parameter space.
The bounds are drawn from the presented analysis of Science Run 2 with 90% confidence level. Relationship between the parameters from ALP theory and measured quantities is discussed in Supplementary Section II. a, In colour, upper bound on the interaction scale for axion–nucleon coupling, fint, to which GNOME was sensitive as a function of ma and the ratio between symmetry-breaking and interaction scales (ξ ≡ fSB/fint). The dashed horizontal lines highlight the cross-section used in b with the respective colour. b, Cross-sections of the excluded parameter volume in a for different ξ ratios. We note that the domain walls may not be the only form of dark matter; therefore, ρDW < 0.4 GeV cm–3. If the domain-wall energy density is substantially smaller, this would affect the bounds shown here. Source data
Extended Data Fig. 1
Extended Data Fig. 1. Summary of the GNOME performance during the four Science Runs from 2017 to 2020.
The raw magnetometer data are averaged for 20 s and their standard deviation is calculated over a minimum of one and a maximum of two hours segments depending on the availability of continuous data segments. For each binned point, the combined network noise considering the worst case domain-wall crossing direction is evaluated as defined in Ref. . (a) One-day rolling average of the number of active sensors. (b) Multi-colored solid line represents the one-day rolling average of the combined network noise and the multi-colored dashes show the noise of the individual sampled segments. The data are preprocessed with the same filters used for the analysis. The number of magnetometers active is indicated by the color of the line and dashes. Source data
Extended Data Fig. 2
Extended Data Fig. 2. Summary of the true-positive analysis results.
(a) shows the probability of detecting a domain-wall-crossing event with randomized parameters (as discussed in the text) as a function of p-value and directional-consistency thresholds. The inserted events have a magnitude-to-uncertainty ratio between 5 and 10. The black line indicates the combination of parameters corresponding to a 97.5% detection probability. The white dot indicates the particular thresholds chosen for the analysis. (b) Shows the mean detection probability reached for different magnitude-to-uncertainty ratios for the chosen thresholds.

References

    1. Bertone G, Hooper D, Silk J. Particle dark matter: evidence, candidates and constraints. Phys. Rep. 2005;405:279–390.
    1. Gorenstein P, Tucker W. Astronomical signatures of dark matter. Adv. High Energ. Phys. 2014;2014:878203.
    1. Safronova M, et al. Search for new physics with atoms and molecules. Rev. Mod. Phys. 2018;90:025008.
    1. Preskill J, Wise MB, Wilczek F. Cosmology of the invisible axion. Phys. Lett. B. 1983;120:127–132.
    1. Graham PW, Irastorza IG, Lamoreaux SK, Lindner A, van Bibber KA. Experimental searches for the axion and axion-like particles. Annu. Rev. Nucl. Part. Sci. 2015;65:485–514.