

Statistical Inferences Using Effect Sizes in Human Endothelial Function Research
- PMID: 34966462
- PMCID: PMC8654719
- DOI: 10.1007/s44200-021-00006-6
Statistical Inferences Using Effect Sizes in Human Endothelial Function Research
Abstract
Introduction: Magnitudes of change in endothelial function research can be articulated using effect size statistics. Effect sizes are commonly used in reference to Cohen's seminal guidelines of small (d = 0.2), medium (d = 0.5), and large (d = 0.8). Quantitative analyses of effect size distributions across various research disciplines have revealed values differing from Cohen's original recommendations. Here we examine effect size distributions in human endothelial function research, and the magnitude of small, medium, and large effects for macro and microvascular endothelial function.
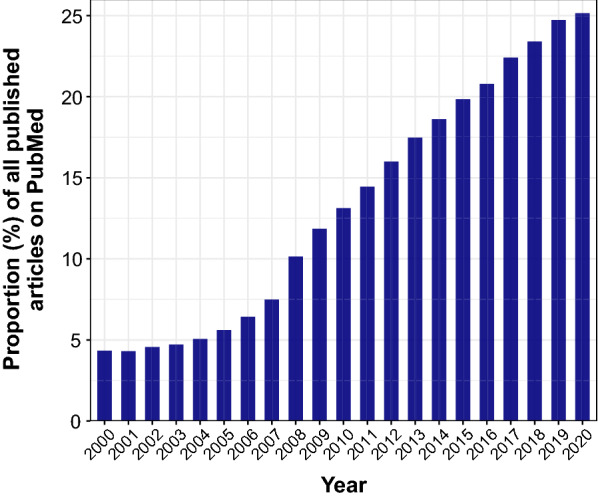
Methods: Effect sizes reported as standardized mean differences were extracted from meta research available for endothelial function. A frequency distribution was constructed to sort effect sizes. The 25th, 50th, and 75th percentiles were used to derive small, medium, and large effects. Group sample sizes and publication year from primary studies were also extracted to observe any potential trends, related to these factors, in effect size reporting in endothelial function research.
Results: Seven hundred fifty-two effect sizes were extracted from eligible meta-analyses. We determined small (d = 0.28), medium (d = 0.69), and large (d = 1.21) effects for endothelial function that corresponded to the 25th, 50th, and 75th percentile of the data distribution.
Conclusion: Our data indicate that direct application of Cohen's guidelines would underestimate the magnitude of effects in human endothelial function research. This investigation facilitates future a priori power analyses, provides a practical guiding benchmark for the contextualization of an effect when no other information is available, and further encourages the reporting of effect sizes in endothelial function research.
Keywords: Effect sizes; Endothelial function; Statistical power; Statistics.
© The Author(s) 2021.
Conflict of interest statement
Conflict of interestNo conflicts of interest, financial or otherwise, are declared by the authors.
Figures


Similar articles
-
Effect Size Guidelines, Sample Size Calculations, and Statistical Power in Gerontology.Innov Aging. 2019 Sep 4;3(4):igz036. doi: 10.1093/geroni/igz036. eCollection 2019 Aug. Innov Aging. 2019. PMID: 31528719 Free PMC article.
-
Novel Effect Size Interpretation Guidelines and an Evaluation of Statistical Power in Rehabilitation Research.Arch Phys Med Rehabil. 2020 Dec;101(12):2219-2226. doi: 10.1016/j.apmr.2020.02.017. Epub 2020 Apr 6. Arch Phys Med Rehabil. 2020. PMID: 32272106
-
An Examination of Effect Sizes and Statistical Power in Speech, Language, and Hearing Research.J Speech Lang Hear Res. 2020 May 22;63(5):1572-1580. doi: 10.1044/2020_JSLHR-19-00299. Epub 2020 Apr 28. J Speech Lang Hear Res. 2020. PMID: 32343919
-
Calculating and reporting effect sizes to facilitate cumulative science: a practical primer for t-tests and ANOVAs.Front Psychol. 2013 Nov 26;4:863. doi: 10.3389/fpsyg.2013.00863. Front Psychol. 2013. PMID: 24324449 Free PMC article. Review.
-
Meta-analysis provides evidence-based effect sizes for a cancer-specific quality-of-life questionnaire, the FACT-G.J Clin Epidemiol. 2010 Mar;63(3):270-81. doi: 10.1016/j.jclinepi.2009.05.001. Epub 2009 Aug 27. J Clin Epidemiol. 2010. PMID: 19716264 Review.
Cited by
-
Effects of metformin treatment on the risk of acute myocardial infarction.Sci Rep. 2025 Jul 29;15(1):27707. doi: 10.1038/s41598-025-13211-z. Sci Rep. 2025. PMID: 40730654 Free PMC article.
-
Acute partial sleep restriction does not impact arterial function in young and healthy humans.Exp Physiol. 2024 Sep;109(9):1492-1504. doi: 10.1113/EP091699. Epub 2024 Jun 20. Exp Physiol. 2024. PMID: 38900696 Free PMC article.
-
Interpretation of the Standardized Mean Difference Effect Size When Distributions Are Not Normal or Homoscedastic.Educ Psychol Meas. 2024 Oct 6:00131644241278928. doi: 10.1177/00131644241278928. Online ahead of print. Educ Psychol Meas. 2024. PMID: 39554777 Free PMC article.
-
Effect of dietary glycemic index on insulin resistance in adults without diabetes mellitus: a systematic review and meta-analysis.Front Nutr. 2025 Feb 13;12:1458353. doi: 10.3389/fnut.2025.1458353. eCollection 2025. Front Nutr. 2025. PMID: 40018272 Free PMC article.
References
-
- Aczel B, Palfi B, Szollosi A, Kovacs M, Szaszi B, Szecsi P, et al. Quantifying support for the null hypothesis in psychology: an empirical investigation. Adv Methods Pract Psychol Sci. 2018;1:357–366. doi: 10.1177/2515245918773742. - DOI
LinkOut - more resources
Full Text Sources