

Impedance-based Real-time Monitoring of Neural Stem Cell Differentiation
- PMID: 34966467
- PMCID: PMC8667812
- DOI: 10.2478/joeb-2021-0006
Impedance-based Real-time Monitoring of Neural Stem Cell Differentiation
Abstract
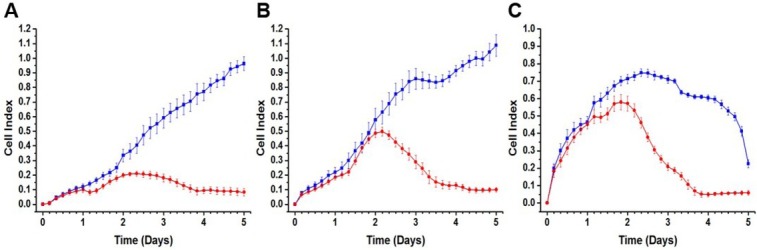
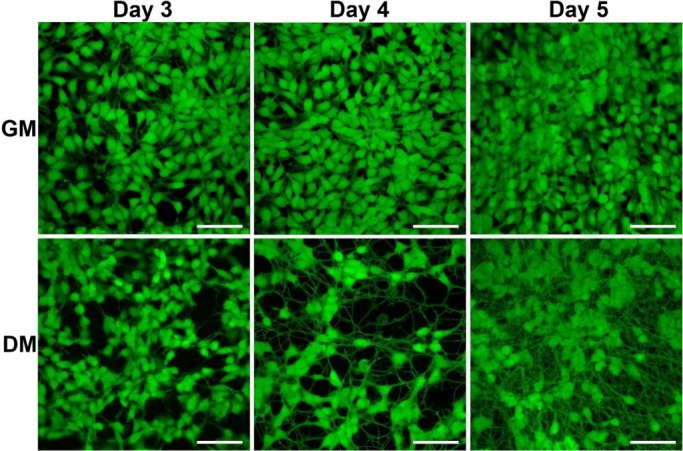
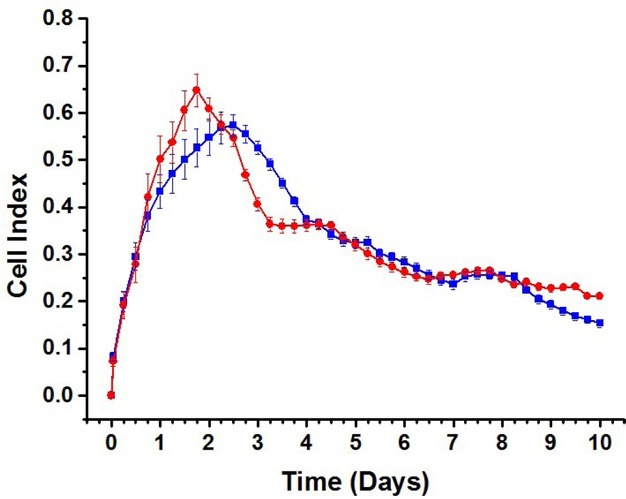
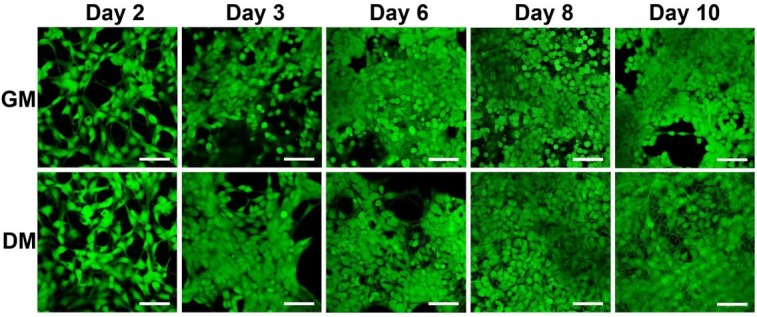
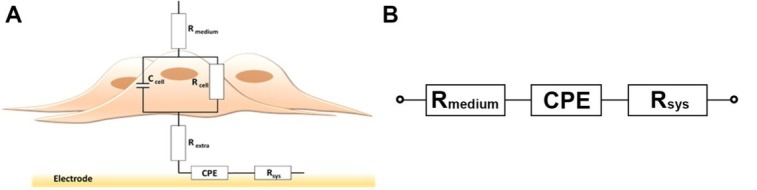
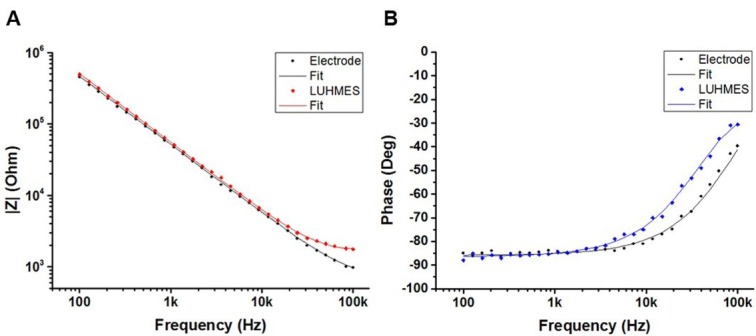
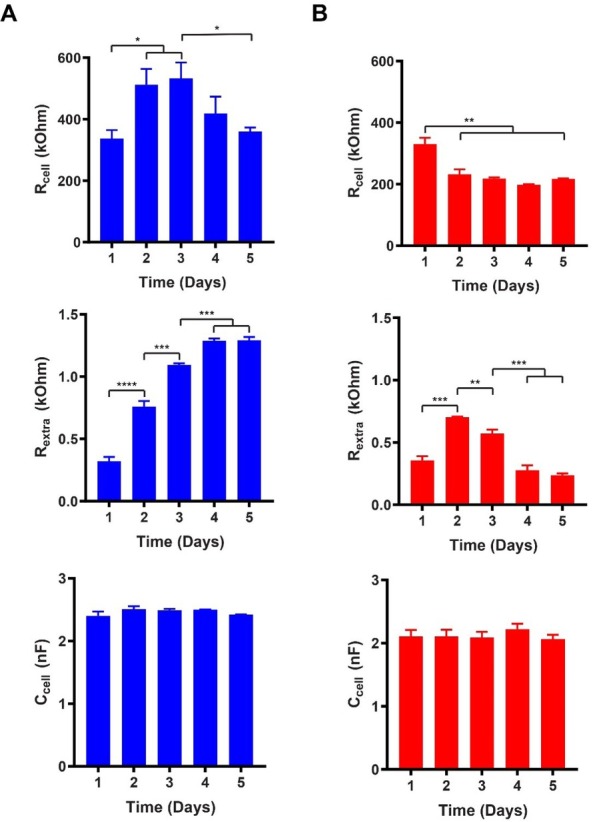
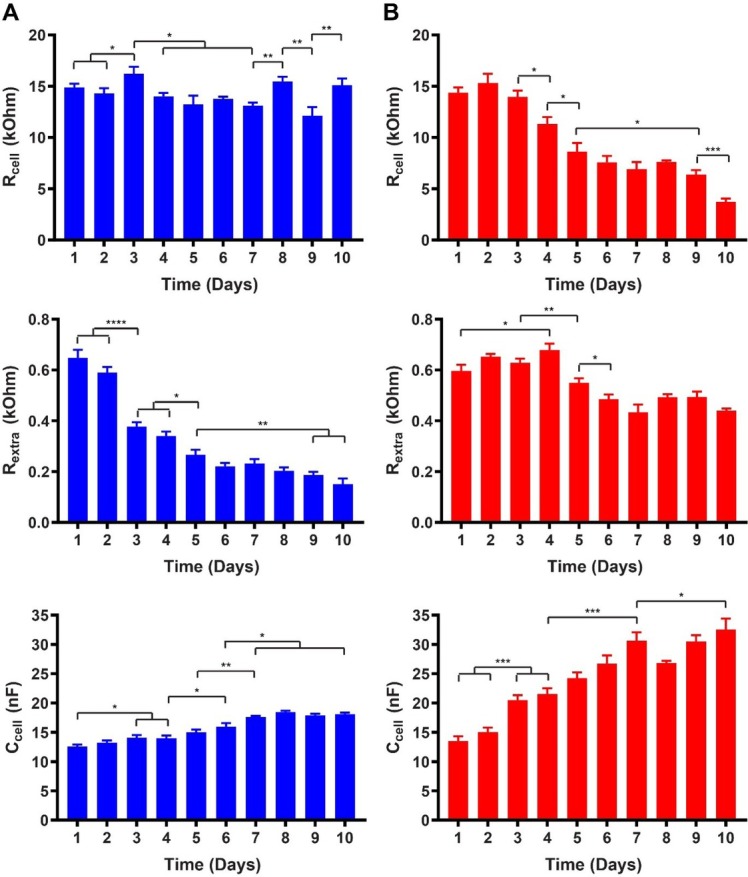
We present here the first impedance-based characterization of the differentiation process of two human mesencephalic fetal neural stem lines. The two dopaminergic neural stem cell lines used in this study, Lund human mesencephalic (LUHMES) and human ventral mesencephalic (hVM1 Bcl-XL), have been developed for the study of Parkinsonian pathogenesis and its treatment using cell replacement therapy. We show that if only relying on impedance magnitude analysis, which is by far the most usual approach in, e.g., cytotoxicity evaluation and drug screening applications, one may not be able to distinguish whether the neural stem cells in a population are proliferating or differentiating. However, the presented results highlight that equivalent circuit analysis can provide detailed information on cellular behavior, e.g. simultaneous changes in cell morphology, cell-cell contacts, and cell adhesion during formation of neural projections, which are the fundamental behavioral differences between proliferating and differentiating neural stem cells. Moreover, our work also demonstrates the sensitivity of impedance-based monitoring with capability to provide information on changes in cellular behavior in relation to proliferation and differentiation. For both of the studied cell lines, in already two days (one day after induction of differentiation) equivalent circuit analysis was able to show distinction between proliferation and differentiation conditions, which is significantly earlier than by microscopic imaging. This study demonstrates the potential of impedance-based monitoring as a technique of choice in the study of stem cell behavior, laying the foundation for screening assays to characterize stem cell lines and testing the efficacy epigenetic control.
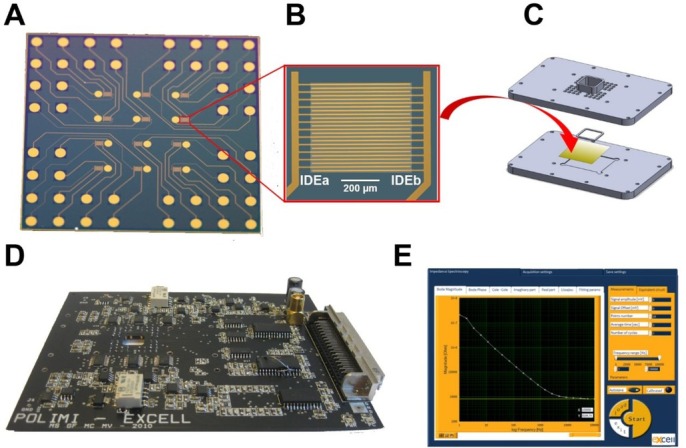
Keywords: Dopaminergic neuron; ECIS; Equivalent circuit; IDE; Impedance; Neural stem cell; Stem cell differentiation.
© 2021 Shah F. J., Caviglia C., Zór K., Carminati M., Ferrari G., Sampietro M., Martínez-Serrano A., Emnéus J. K., Heiskanen A. R., published by Sciendo.
Conflict of interest statement
Conflict of interest Authors state no conflict of interest.
Figures
Similar articles
-
Real-time monitoring of neural differentiation of human mesenchymal stem cells by electric cell-substrate impedance sensing.J Biomed Biotechnol. 2011;2011:485173. doi: 10.1155/2011/485173. Epub 2011 May 31. J Biomed Biotechnol. 2011. PMID: 21716652 Free PMC article.
-
Impedimetric real-time monitoring of neural pluripotent stem cell differentiation process on microelectrode arrays.Biosens Bioelectron. 2016 Dec 15;86:277-286. doi: 10.1016/j.bios.2016.06.056. Epub 2016 Jun 20. Biosens Bioelectron. 2016. PMID: 27387257
-
Preclinical Analysis of Fetal Human Mesencephalic Neural Progenitor Cell Lines: Characterization and Safety In Vitro and In Vivo.Stem Cells Transl Med. 2017 Feb;6(2):576-588. doi: 10.5966/sctm.2015-0228. Epub 2016 Sep 2. Stem Cells Transl Med. 2017. PMID: 28191758 Free PMC article.
-
Electrical impedance sensing in stem cell research: Insights, applications, and future directions.Prog Biophys Mol Biol. 2025 Mar;195:1-14. doi: 10.1016/j.pbiomolbio.2024.11.004. Epub 2024 Nov 16. Prog Biophys Mol Biol. 2025. PMID: 39557164 Review.
-
Adult subventricular zone neural stem cells as a potential source of dopaminergic replacement neurons.Front Neurosci. 2014 Feb 10;8:16. doi: 10.3389/fnins.2014.00016. eCollection 2014. Front Neurosci. 2014. PMID: 24574954 Free PMC article. Review.
Cited by
-
Improvement of bioanalytical parameters through automation: suitability of a hand-like robotic system.Anal Bioanal Chem. 2024 Nov;416(26):5827-5839. doi: 10.1007/s00216-024-05510-7. Epub 2024 Aug 29. Anal Bioanal Chem. 2024. PMID: 39207494
-
Bioimpedance measurements of fibrotic and acutely injured lung tissues.Acta Biomater. 2025 Mar 1;194:270-287. doi: 10.1016/j.actbio.2025.01.039. Epub 2025 Jan 25. Acta Biomater. 2025. PMID: 39870150
References
-
- Pripuzova N.S., Getie-Kebtie M., Grunseich C., Sweeney C., Malech H., Alterman M.A.. Development of a protein marker panel for characterization of human induced pluripotent stem cells (hiPSCs) using global quantitative proteome analysis. Stem Cell Res. 2015;14:323–338. doi: 10.1016/j.scr.2015.01.009. - DOI - PMC - PubMed
LinkOut - more resources
Full Text Sources
Research Materials