. 2021 Dec 9:9:e12577.
doi: 10.7717/peerj.12577. eCollection 2021.

Distributions of extinction times from fossil ages and tree topologies: the example of mid-Permian synapsid extinctions

Affiliations

Distributions of extinction times from fossil ages and tree topologies: the example of mid-Permian synapsid extinctions

Gilles Didier et al. PeerJ. .

Abstract

Given a phylogenetic tree that includes only extinct, or a mix of extinct and extant taxa, where at least some fossil data are available, we present a method to compute the distribution of the extinction time of a given set of taxa under the Fossilized-Birth-Death model. Our approach differs from the previous ones in that it takes into account (i) the possibility that the taxa or the clade considered may diversify before going extinct and (ii) the whole phylogenetic tree to estimate extinction times, whilst previous methods do not consider the diversification process and deal with each branch independently. Because of this, our method can estimate extinction times of lineages represented by a single fossil, provided that they belong to a clade that includes other fossil occurrences. We assess and compare our new approach with a standard previous one using simulated data. Results show that our method provides more accurate confidence intervals. This new approach is applied to the study of the extinction time of three Permo-Carboniferous synapsid taxa (Ophiacodontidae, Edaphosauridae, and Sphenacodontidae) that are thought to have disappeared toward the end of the Cisuralian (early Permian), or possibly shortly thereafter. The timing of extinctions of these three taxa and of their component lineages supports the idea that the biological crisis in the late Kungurian/early Roadian consisted of a progressive decline in biodiversity throughout the Kungurian.

Keywords: Amniotes; Edaphosauridae; Extinction time; Fossil record; Fossilized-birth-death model; Mass extinction events; Ophiacodontidae; Permian; Permo-Carboniferous synapsids; Sphenacodontidae.


Conflict of interest statement

The authors declare that they have no competing interests.

Figures

Figure 1
Figure 1. A simulated extinct clade with sampled fossils represented by brown dots.
Top: The clade’s complete evolutionary history. Bottom: The portion of the clade’s history observable from the known fossil record. Note that the ‘blue’ and ‘yellow’ taxa diversify before going extinct, but that these diversification events are not recorded in the known fossil record.
Figure 2
Figure 2. Decomposition of the probability density of a phylogenetic tree of extinct and extant taxa with fossils (figured by brown dots) as the product of the probability densities of “basic trees” by cutting it at each fossil find (adapted from Didier & Laurin, 2020).
Figure 3
Figure 3. One of the 100 equally parsimonious trees of our dataset and the extinction time probability density distributions of its extinct taxa.
Intervals of possible ages for each fossil are represented as thick brown segments with a certain level of transparency (darker brown segments correspond to over lapping intervals). The extinction time probability distributions are represented in red. These sometimes overlap the intervals of possible ages of the last fossils of a given branch because fossil ages are sampled in these intervals to compute the distributions. The thin blue line represents the Kungurian/Roadian (Cisuralian/Guadalupian) boundary. Only the branch tips are time-calibrated; the position of nodes is set to the median of the distribution of the corresponding speciation time, as shown in Figs. SI and S2 (Sections SI–S5).
Figure 4
Figure 4. Extinction time probability density distributions of ophiacodontids (X axis, in Ma).
The colored part under each distribution starts at its 95% confidence upper bound. The thin vertical lines represent the Kungurian/Roadian (Cisuralian/Guadalupian) boundary.
Figure 5
Figure 5. Extinction time probability density distributions of edaphosaurids (X axis, in Ma).
The colored part under each distribution starts at its 95% confidence upper bound. The thin vertical lines represents the Kungurian/Roadian (Cisuralian/Guadalupian) boundary.
Figure 6
Figure 6. Extinction time probability density distributions of sphenacodontids (X axis, in Ma).
The colored part under each distribution starts at its 95% confidence upper bound. The thin vertical lines represent the Kungurian/Roadian (Cisuralian/Guadalupian) boundary.
Figure 7
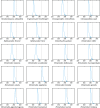
Figure 7. Extinction time probability density distributions of the taxa of our dataset that are not ophiacodontids, edaphosaurids or sphenacodontids (X axis, in Ma).
The colored part under each distribution starts at its 95% confidence upper bound. The thin vertical lines represents the Kungurian/Roadian (Cisuralian/Guadalupian) boundary.
Figure 8
Figure 8. Probability density distributions of the extinction times (X axis, in Ma) of the clades Ophiacodontidae, Edaphosauridae and and Sphenacodontidae based on our dataset.
The colored part under each distribution starts at its 95% confidence upper bound. The vertical line represents the Kungurian/Roadian (Cisuralian/Guadalupian) boundary.

References

    1. Abdala F, Rubidge BS, Van Den Heever J. The oldest therocephalians (Therapsida, Eutheriodontia) and the early diversification of Therapsida. Palaeontology. 2008;51(4):1011–1024. doi: 10.1111/j.1475-4983.2008.00784.x. - DOI
    1. Alroy J. Constant extinction, constrained diversification, and uncoordinated stasis in North American mammals. Palaeogeography, Palaeoclimatology, Palaeoecology. 1996;127(1–4):285–311. doi: 10.1016/S0031-0182(96)00100-9. - DOI
    1. Alroy J. A simple Bayesian method of inferring extinction. Paleobiology. 2014;40(4):584–607. doi: 10.1666/13074. - DOI
    1. Alroy J, Marshall C, Miller A. The Paleobiology Database. 2012. https://paleobiodb.org/#/ https://paleobiodb.org/#/
    1. Amson E, Laurin M. On the affinities of Tetraceratops insignis, an Early Permian synapsid. Acta Palaeontologica Polonica. 2011;56(2):301–312. doi: 10.4202/app.2010.0063. - DOI

LinkOut - more resources