. 2023 Jan;32(2):281-298.
doi: 10.1111/mec.16334. Epub 2022 Jan 17.

Genomic analyses reveal range-wide devastation of sea otter populations

Affiliations

Genomic analyses reveal range-wide devastation of sea otter populations

Annabel C Beichman et al. Mol Ecol. 2023 Jan.

Abstract

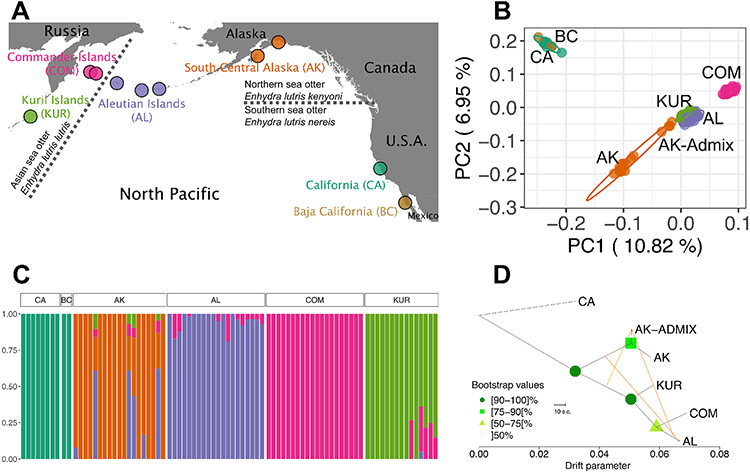
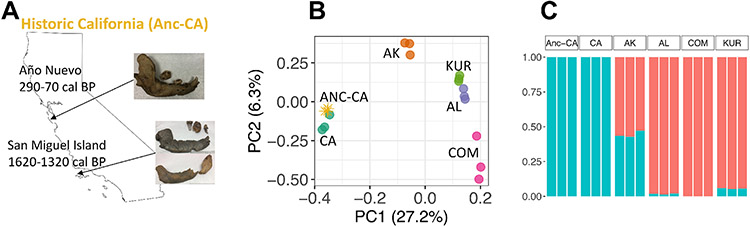
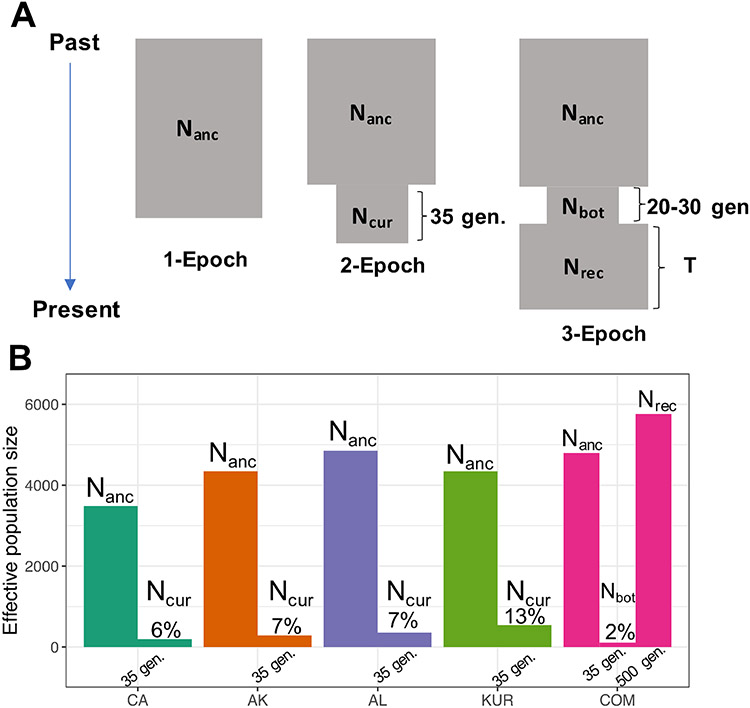
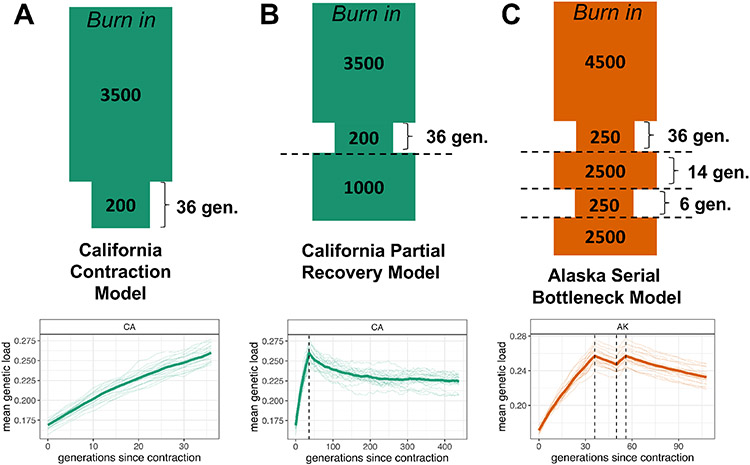
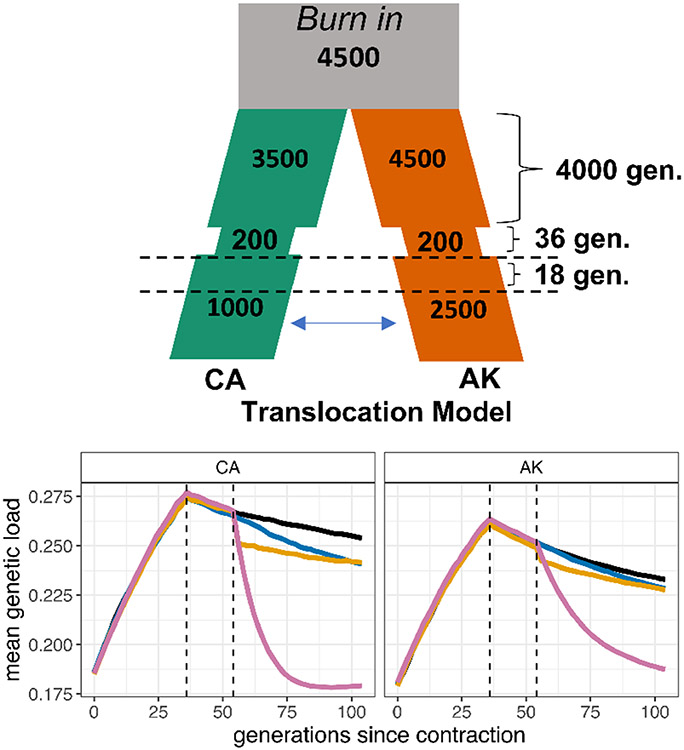
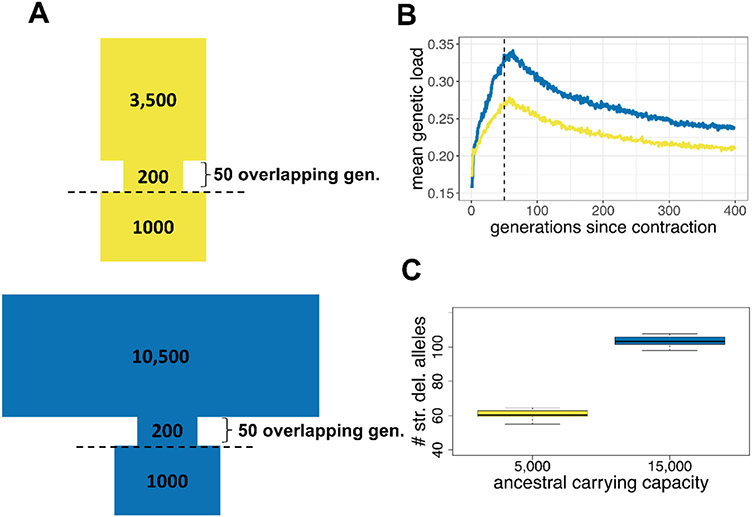
The genetic consequences of species-wide declines are rarely quantified because the timing and extent of the decline varies across the species' range. The sea otter (Enhydra lutris) is a unique model in this regard. Their dramatic decline from thousands to fewer than 100 individuals per population occurred range-wide and nearly simultaneously due to the 18th-19th century fur trade. Consequently, each sea otter population represents an independent natural experiment of recovery after extreme population decline. We designed sequence capture probes for 50 Mb of sea otter exonic and neutral genomic regions. We sequenced 107 sea otters from five populations that span the species range to high coverage (18-76×) and three historical Californian samples from ~1500 and ~200 years ago to low coverage (1.5-3.5×). We observe distinct population structure and find that sea otters in California are the last survivors of a divergent lineage isolated for thousands of years and therefore warrant special conservation concern. We detect signals of extreme population decline in every surviving sea otter population and use this demographic history to design forward-in-time simulations of coding sequence. Our simulations indicate that this decline could lower the fitness of recovering populations for generations. However, the simulations also demonstrate how historically low effective population sizes prior to the fur trade may have mitigated the effects of population decline on genetic health. Our comprehensive approach shows how demographic inference from genomic data, coupled with simulations, allows assessment of extinction risk and different models of recovery.

Keywords: conservation genomics; demographic simulations; genetic load; population bottleneck; sea otters.


Conflict of interest statement

Declaration of interests

The authors have no conflicts of interest.

Figures

Figure 1.
Figure 1.. Sea Otter Population Structure Mirrors Historic Distribution.
A) Locations of sea otter samples used in this study. Sea otters were sampled from the Kuril Islands (KUR, n = 13), Commander Islands (COM, n = 45), Aleutian Islands (AL, consisting of Attu, Amchitka and Adak Islands, n = 21), south central Alaska (AK, n = 19), California (CA, n = 7), and Baja California (BC, n = 2). Dashed lines indicate the previously-designated subspecies boundaries between southern, northern and Asian sea otters. See Figure S1 for finer-scale sampling location maps, Supplemental Methods for sample information, and Tables S1 and S3 for sample and coverage details. B) Principal components analysis of modern sea otter samples. Multivariate t-distribution 95% data ellipses are shown. See Figure S3A-C for PCA analyses of the northern and Asian populations without California which provide greater resolution of their population structure. C) fastSTRUCTURE analysis of the samples with the number of clusters (K) = 5. See Figure S3F for additional values of K. D) Bootstrapped Treemix analysis showing drift between populations, with migration events shown as orange lines. California was set as the root. Admixed south central Alaskan individuals are separated in the analysis (AK-Admix) from the non-admixed (AK). Baja California was excluded as it appears to be an expansion of the California population, rather than a distinct population. Treemix residuals are shown in Figure S3G. See also Figures S1, S3 and Tables S1, S3, S4, and S5.
Figure 2.
Figure 2.. Historical DNA Suggests Genetic Stability in California.
A) Sampling locations and ages of three historic sea otter samples from California shell middens. B) PCAngsd principal components analysis of three historic California samples (“Anc-CA”, gold stars) and 15 modern sea otter samples based on genotype likelihoods. Each modern population (California (CA), Alaska (AK), Aleutian Islands (AL), and Kuril Islands (KUR), and the Commander Islands (COM)) was downsampled to three individuals to balance the sample size of the three historic samples. C) PCAngsd admixture analysis, based on genotype likelihoods, including the three historic California samples (“Anc-CA”). See also Figure S2 and Table S2.
Figure 3.
Figure 3.. Signals of Extreme Decline Detected in Every Remnant Population Using the Site Frequency Spectrum.
A) The three single-population demographic models that were compared: a 1-Epoch model in which no size change occurs, a 2-Epoch model in which a single contraction occurs, and a 3-Epoch bottleneck model in which a recovery period is modeled. For the 2-Epoch model, a wide variety of contraction durations was explored using a grid search approach (Figure S4B). However, in order to compare the magnitude of decline across populations, results shown have the duration of the contraction fixed to ~35 generations, representing the start of the fur trade ~245 years prior to sampling. B) For California (CA), Alaska (AK), Aleutian Islands (AL), and Kuril Islands (KUR), a 2-Epoch contraction model with parameters inferred using a grid search in ∂a∂i fit the SFS best. Nanc represents the inferred ancestral size and Ncur is the inferred contraction size if the contraction duration is fixed to ~35 generations to be concordant with the timing of the fur trade. The ratio of the inferred post-contraction effective population size to ancestral effective population size is shown as a percentage for each population. For the Commander Islands (COM), a 3-Epoch model with a bottleneck size (Nbot) and recovery size (Nrec) was a significantly better fit to the SFS, but this signal did not appear when mapped to the southern sea otter genome and therefore may be artefactual (Table S7; Supplemental Methods). See also Figures S4 and S5 and Tables S6 and S7.
Figure 4.
Figure 4.. Recessive Genetic Load is Predicted to Increase During Decline and Persist after Recovery.
A) Forward-in-time Wright-Fisher simulations of genetic load (reduction in fitness due to deleterious variation) under the demographic model of recent population decline we inferred for the California sea otter population. The demographic model is shown above, with sizes in diploid individuals and times in generations. The simulation results below the model diagram show an increase in genetic load during the inferred population contraction (contraction occurs at generation 0). The thick line represents the mean of 20 simulation replicates, with individual replicates as faint lines. The contraction duration was increased from 35 to 36 generations to accommodate sampling of load every even-numbered generation in the simulation framework. B) Simulations of genetic load under a model of partial recovery for the California population in which the contraction modeled in (A) is followed by a partial recovery to an effective size of 1000 individuals. The simulation results below the model are as described in (A). The partial recovery occurs at the dashed line. C) A model of serial declines in the south central Alaska population, showing the possible impacts of post-fur trade events such as the Exxon Valdez oil spill or orca predation. The simulation results below the model are as described in (A). The first population contraction occurring at generation 0, followed by a brief recovery (starting at the first dashed line), then another rapid contraction and partial recovery (second and third dashed lines). Results based on alternative distributions of dominance and selection coefficients are shown in Figure S6C-E.
Figure 5.
Figure 5.. Gene Flow May Mitigate Genetic Load.
An isolation-migration model exploring the theoretical benefits of enabling gene flow between California and south central Alaska, based on the joint population histories of the populations we inferred. The simulated populations split 4000 generations ago, then both experience contractions followed by partial recovery, then hypothetical translocations at varying levels of intensity begin 18 generations after the populations have partially recovered from their respective declines. The forward-in-time Wright-Fisher simulations of genetic load under this model show a decrease in recessive genetic load caused by high levels of gene flow between populations. The partial recovery occurs at the first dashed line, and gene flow begins at the second dashed line. Levels of gene flow range from no gene flow (black), one individual per generation (blue), a burst of 25 individuals exchanged for two generations (yellow), or sustained high levels of gene flow of 25 individuals per generation (pink). Each line represents the mean of 20 simulation replicates. Results based on alternative distributions of dominance and selection coefficients are shown in Figure S9.
Figure 6.
Figure 6.. Long-term Low Population Size May Mitigate Recent Bottleneck Effects.
A) More ecologically-realistic non-Wright-Fisher models of the impact of historical population size on genetic load. Values represent effective population sizes, though the model uses carrying capacities (K) (see Table S8 for corresponding K). The yellow (upper) model represents a population with ancestral effective population size based on our demographic inference, and the blue (lower) model is a theoretical population that has a 3x higher ancestral effective size. Each population goes through an extreme decline as in model, then partially recovers. The contraction duration was increased from 35 to 50 generations to account for overlapping generations in the non-Wright-Fisher framework. B) Non-Wright Fisher simulations of genetic load under the models in (A). The yellow line represents the yellow model in (A) based on our inferred demographic parameters, and the blue line represents the blue model in (A) with the 3x larger ancestral size. Recovery occurs at the dashed line. C) The average number of strongly deleterious alleles per individual for each ancestral carrying capacity described in (A). Results based on alternative distributions of dominance and selection coefficients are shown in Figure S10.

Comment in

References

    1. Aguilar A, Jessup DA, Estes J, & Garza JC (2008). The distribution of nuclear genetic variation and historical demography of sea otters. Animal Conservation, 11(1), 35–45. 10.1111/j.1469-1795.2007.00144.x - DOI
    1. Allentoft ME, Sikora M, Sjögren K-G, Rasmussen S, Rasmussen M, Stenderup J, Damgaard PB, Schroeder H, Ahlström T, Vinner L, Malaspinas A-S, Margaryan A, Higham T, Chivall D, Lynnerup N, Harvig L, Baron J, Casa PD, Dąbrowski P, … Willerslev E (2015). Population genomics of Bronze Age Eurasia. Nature, 522(7555), 167–172. 10.1038/nature14507 - DOI - PubMed
    1. Balick DJ, Do R, Cassa CA, Reich D, & Sunyaev SR (2015). Dominance of deleterious alleles controls the response to a population bottleneck. PLOS Genetics, 11(8), e1005436. 10.1371/journal.pgen.1005436 - DOI - PMC - PubMed
    1. Ballachey BE, Bodkin JL, & DeGange AR (1994). An overview of sea otter studies. Marine Mammals and the Exxon Valdez, 47–59.
    1. Beichman AC, Koepfli K-P, Li G, Murphy W, Dobrynin P, Kliver S, Tinker MT, Murray MJ, Johnson J, Lindblad-Toh K, Karlsson EK, Lohmueller KE, & Wayne RK (2019). Aquatic adaptation and depleted diversity: A deep dive into the genomes of the sea otter and giant otter. Molecular Biology and Evolution, 36(12), 2631–2655. 10.1093/molbev/msz101 - DOI - PMC - PubMed

Publication types

LinkOut - more resources