. 2022 Jul;16(14):2632-2657.
doi: 10.1002/1878-0261.13175. Epub 2022 Jan 26.

ABI1-based expression signature predicts breast cancer metastasis and survival

Affiliations

ABI1-based expression signature predicts breast cancer metastasis and survival

Angelina Regua et al. Mol Oncol. 2022 Jul.

Abstract

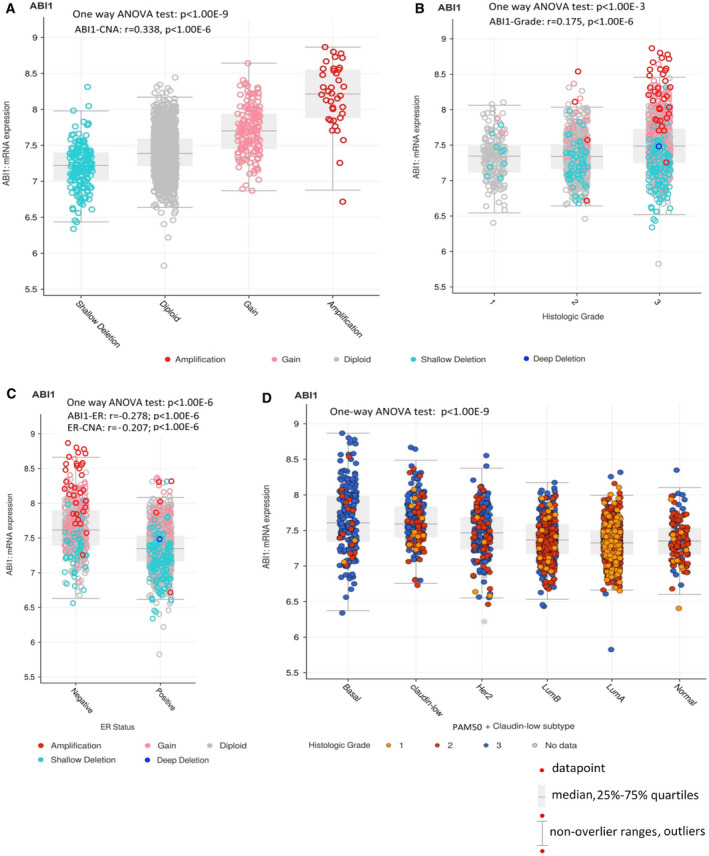
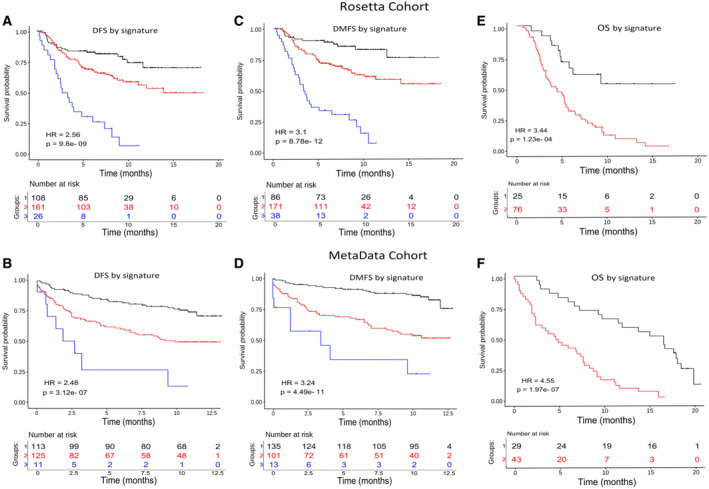
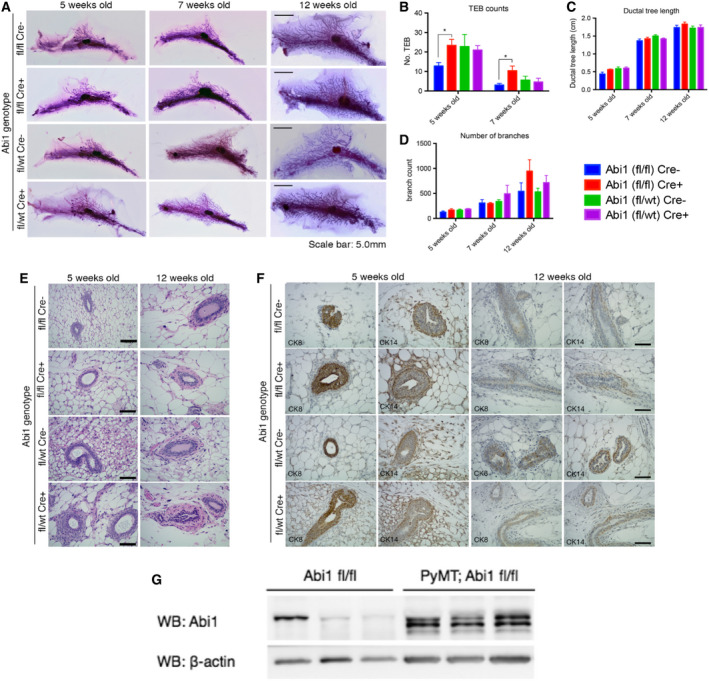
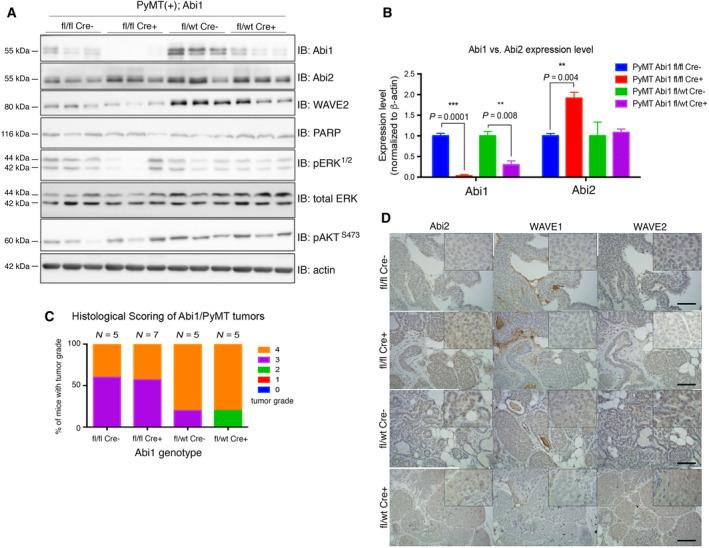
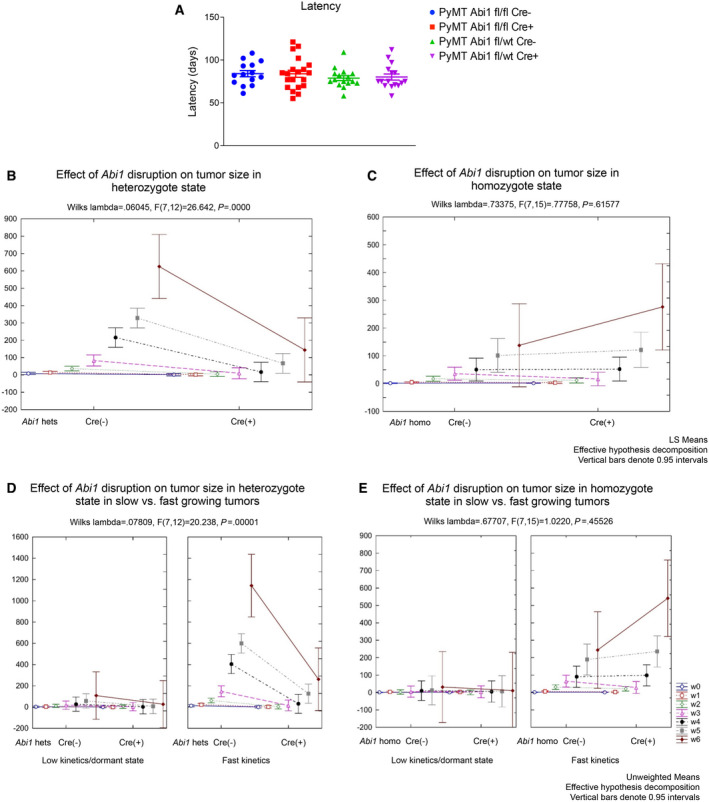
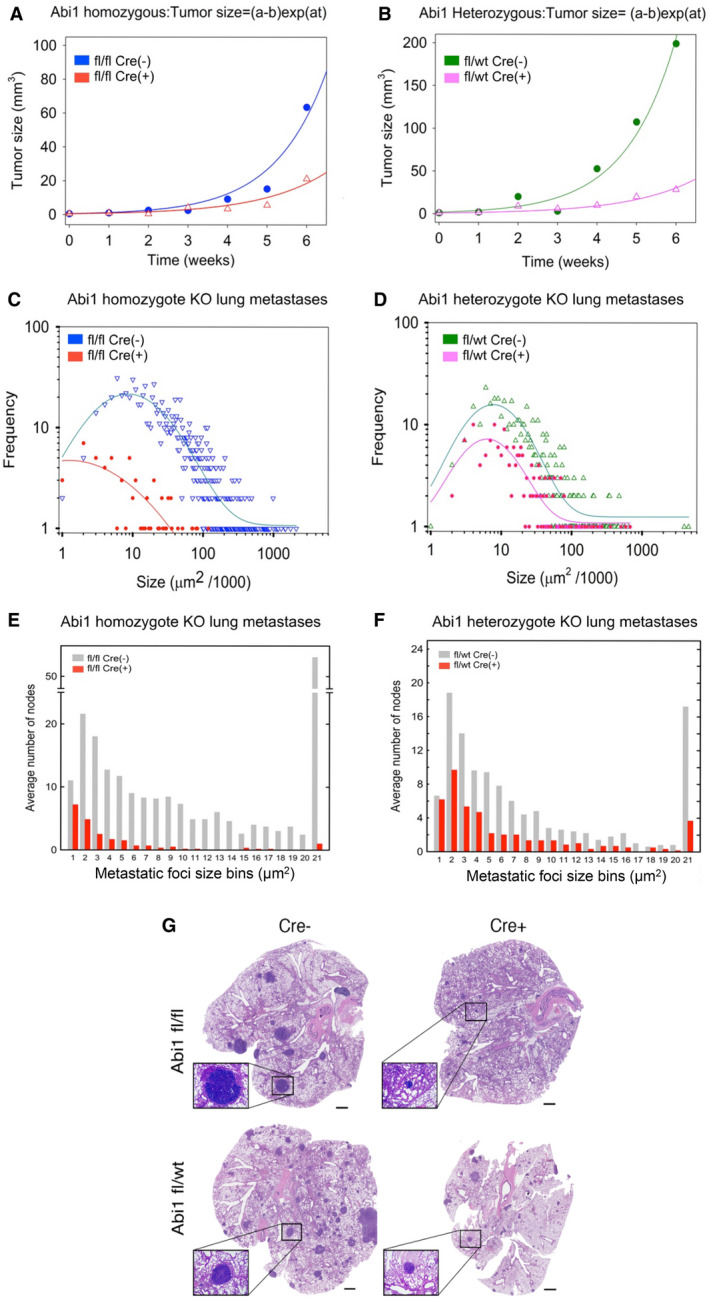
Despite the current standard of care, breast cancer remains one of the leading causes of mortality in women worldwide, thus emphasizing the need for better predictive and therapeutic targets. ABI1 is associated with poor survival and an aggressive breast cancer phenotype, although its role in tumorigenesis, metastasis, and the disease outcome remains to be elucidated. Here, we define the ABI1-based seven-gene prognostic signature that predicts survival of metastatic breast cancer patients; ABI1 is an essential component of the signature. Genetic disruption of Abi1 in primary breast cancer tumors of PyMT mice led to significant reduction of the number and size of lung metastases in a gene dose-dependent manner. The disruption of Abi1 resulted in deregulation of the WAVE complex at the mRNA and protein levels in mouse tumors. In conclusion, ABI1 is a prognostic metastatic biomarker in breast cancer. We demonstrate, for the first time, that lung metastasis is associated with an Abi1 gene dose and specific gene expression aberrations in primary breast cancer tumors. These results indicate that targeting ABI1 may provide a therapeutic advantage in breast cancer patients.

Keywords: Abi1; WAVE; breast cancer; metastasis; preclinical mouse; survival signature.


Conflict of interest statement

The authors declare no conflict of interest.

Figures

Fig. 1
Fig. 1
ABI1 expression alteration is associated with copy number alteration (CNA) and high‐aggressive basal‐like breast cancer. Box Plots: (A) Putative ABI1 DNA copy number alteration (CNA) drives ABI1 transcription level in subpopulations of primary breast cancer patients [42]. The gene expression, CNA, tumor samples, and clinical datasets representing 1904 primary breast cancer samples were downloaded from METABRIC dataset (https://www.cbioportal.org/). CNA categorization is the following: shallow deletion: 1 (n = 166), diploid: 2 (n = 1554), gain: 3 (146), and amplification: 4 (n = 38). One‐way ANOVA test (Statistica 13) showed significant differences in the ABI1 expression between the groups and also in the entire cohort (P < 1.00E‐9). Furthermore, the transcription level of ABI1 is highly significant and positively correlated with CNA ((r = 0.338; P < 1.00E‐6; estimated by Spearman). (B) ABI1 transcription level positively correlated with histologic grades (univariate and bivariate linear regression models testing shown significance at P < 1.00E‐6), however (C) negatively correlated with ER status. Bivariate linear regression models (Statistica 13) showed that both expression ABI1 expression level and CNA are significant (r = −0.278; P < 1.0.00E‐6 and r = −0.207, P < 1.00E‐6 respectively); however, the ABI1 expression provides a major contribution in the bivariate linear regression function). Correlate coefficients in (B) and (C) were calculated by Kendall. (D) ABI1 overexpression is associated with basal‐like and claudin‐low breast cancer subtypes and aggressiveness of breast cancer scoring also by histologic grade. PAM50 (Basal‐like, HER2(+), luminal B, luminal A, normal‐like), and claudin‐low subtypes were ranked‐order according to the trend of decreasing of ABI1 expression. One‐way ANOVA test (Statistica 13) showed significant differences in the ABI1 expression between basal‐like, claudin‐low subtypes and other subtypes (P < 1.00E‐6). ABI1 expression in the HER2 subtype was significantly higher than in luminal B or luminal A tumor subtypes (P < 1.00E‐6) and higher but less significant than in the normal‐like tumor subtype (P = 001). A negative trend in the ABI1 expression across rank‐ordered tumor subtypes was mostly defined by relative overexpression of Basal‐like and claudin‐low tumor subtypes; it was highly significant (one‐way ANOVA; P < 1.00E‐9; Statistica 13).
Fig. 2
Fig. 2
ABI1‐based prognostic signature predicts disease‐free and metastatic‐free survival risks. The disease‐free survival (DFS) and disease metastasis‐free survival (DMFS) of patients stratified based on the ABI1‐associated signature derived by our survival prognostic analysis method (see Methods for details) is shown using Kaplan–Meier survival curves for Rosetta (A, C) and MetaData cohorts (B, D). The Wald statistic P‐value and hazard ratio (HR) associated with the partitioning of the patients into distinct risk groups are also shown (see methods for details). Our method computationally categorizes each covariate (expression level of a gene) as a binarizing risk factor and stratifies each patient according to the multivariate expression pattern of the genes included in the signature (Table S1). In panels A, B, C, and D: black color line = ‘low‐risk’, red = ‘intermediate risk’, blue = ‘high‐risk’ groups. Panels E and F represent the overall survival (OS) time functions for the patients with metastasis detected after diagnostic and following surgical treatment. The black color line is associated with the group of patients with relatively better disease outcomes, while the red color is associated with patients with poor disease outcomes. The tables at the bottom of plots show the number of patients who survived in the predicted groups more than the given time point.
Fig. 3
Fig. 3
Abi1 loss does not impact the long‐term development of healthy mouse mammary glands. (A) Whole‐mount analysis of the inguinal mammary gland stained with Carmine Alum reveals no gross changes in gland anatomy at 5, 7, or 12 weeks of age after CRE‐mediated deletion of Abi1. Morphometry of whole mounts reveals a significant increase in the number of terminal end buds in homozygous ABI1 null glands (B); however, this does not affect the elongation of the ductal tree (C) or the number of ductal branches (D). Scale bar, 5.0 mm. (E) Histological staining of mammary gland sections reveals no changes in tissue organization after CRE‐mediated loss of Abi1. Scale bar, 100 μm. (F) Immunostaining of mammary sections using markers for luminal epithelial cells (CK8) and myoepithelial cells (CK14) reveals sustained organization of the ductal epithelium in both control and ABI1 null mammary glands. Scale bar, 50 μm. Error bars indicate SEM. (* indicates P < 0.05, Student’s t‐test; n = 5 animals/genotype). (G) WB analysis indicates enhanced expression of Abi1 in mammary epithelium of Abi1(fl;fl) PyMT mice vs. Abi1 floxed mice Abi1 (fl;fl). Each lane represents one mammary gland (Abi1 fl;fl) or tumor [PyMT: Abi1(fl/fl)], (n = 3 mice).
Fig. 4
Fig. 4
Abi1 KO severely impacts WAVE complex gene expression dynamics. (A) Western blot analysis of primary mammary tumors from Abi1 KO PyMT mice shows significant depletion of ABI1 protein, but only in the homozygote Abi1 null is there significant upregulation of ABI2 protein as indicated by densitometry (B). Each lane represents one mammary tumor isolated from one animal of that genotype. Error bars indicate SEM. (P < 0.05, t‐test; n = 3 animals/genotype). (C) Analysis of primary tumor histology reveals no significant changes in tumor grade between controls and Abi1 knockouts, (P > 0.05, t‐test; n ≥ 5 mice per genotype of age between 20 and 22 weeks were used for analysis, Table S8). Error bars indicate SEM). (D) Immunostaining with antibodies against WAVE complex proteins supports our findings that ABI2 is upregulated only in ABI1 null breast tumors. WAVE1 retained its low expression, while WAVE2 was concomitantly depleted with ABI1, in agreement with WB data, above. 20× magnification; inset, 40× magnification, Scale bar, 50 μm.
Fig. 5
Fig. 5
Primary tumor growth kinetics analysis indicates Abi1 gene dose effect in heterozygous mice. (A) Primary tumor latency in PyMT animals is not significantly affected upon Abi1 KO. The X‐axis of a panel (a) represents latency time comparison of the tumors in four treatment conditions defined on the upright corner of the panel (Abi1 fl/fl Cre‐, n = 14 mice; Abi1 fl/fl Cre+, n = 20 mice, Abi1 fl/wt Cre‐, n = 16; Abi1 fl/wt Cre+, n = 16 mice). (B‐E) Treatment effects of Abi1 disruption (fw Cre(+) vs fw Cre(‐) and tumor kinetics of tumor size in heterozygous or homozygous miceGraphical tools of Statistica‐13 were used. Each plot on panels (B‐E) shows tumor size at seven‐time points (w0, w1, w3, w3, w4, w5, and w6 (see Methods)) (for Abi1 fl/fl Cre+, or Cre‐, n = 13 mice were used; for Abi1 fl/wt Cre+, or Cre‐, n = 11 mice were used). The line connects start (Cre(‐)) with the endpoint (Cre(+)) tumor size datasets allowing the comparison of tumor kinetic observations to be easily followed; mean values of tumor size are linked by direct lines at the same detection time point. Wilks lambda statistics and Fisher test were used for estimation of treatment significance. Panels (B) and (C) represent a visualization of the treatment effect (Cre(‐) v.s. Cre(+)) of Abi1 on tumor size in observed time points. Vertical bars indicate 0.95 intervals, CI. An effective decomposition method of Statistica‐13 was used. The primary tumor size comparison in fastly growing mouse groups shows the exponential growth kinetics. (Methods, Table S10). To compare gene dosage effects within heterozygote and homozygote groups, mean values in 7 observed time points were compared (see Table S10 for details). Our results showed that in the cases of fast kinetics datasets, differences between the paired sample mean values were not significant for homozygote (t‐test, P > 0.15) but significant for heterozygote state (t‐test, P = 0.017). (See Methods and Table S10).
Fig. 6
Fig. 6
Abi1 gene knockout reduces metastatic burden in heterozygous and homozygous mice. Representative tumor kinetics of primary (panels a‐b) vs metastatic tumors (panels c‐d). Panel (A) Comparison of the primary tumor volume kinetics in Abi1 homozygous KO mouse (fl/fl; Cre+) (G209, data: red triangle; best‐fit function: red line) and the control Abi1 (fl/fl Cre‐) mouse (G184, data: blue circle; best‐fit function: blue line). (B) Comparison of the primary tumor kinetics of Abi1 KO heterozygous (fl/wt Cre+) mouse (G251, data: pink triangle; best‐fit function: pink line) and the Abi1 control (fl/wt; Cre‐) mouse (G202, data: green circle; best‐fit function: green line). Kinetics of mean values (A and B) were fitted by exponential curve f (t; a, b) = (a − b) * exp(at), where t is time, constant a is the rate of cell population growth and constant (a − b) is the initial tumor population size. Each kinetic dataset includes seven time points (see also Table S10). The estimated parameters in Abi1 fl/fl Cre (‐) tumors: a = 0.77 +/− 0.159, t‐test, P = 0.0047, b = 0.2 +/− 0.678, t‐test, P > 0.1 and in Abi1 fl/fl Cre (+) a = 0.60 +/− 0.153, t‐test, P = 0.0039), b = 0.1 +/− 0.586, t‐test, P > 0.1. Estimated parameters in Abi1 fl/wt Cre (‐) tumors: a = 0.79 +/− 0.091, t‐test, P = 0.001), b =−1.00 +/− 0.964, t‐test, P > 0.1, and in Abi1 fl/wt Cre (+) a = 0.589 +/− 0.110, t‐test, P = 0.0031, b =−0.30 +/− 0.66, t‐test, P > 0.1. According to these results, differences between mean values of the tumor sizes in the studied groups in time are not significant. While primary tumor volume kinetics was not significantly different in these mice vs. their corresponding controls, (A, homozygous ABI1 KO vs. control) and (B, heterozygous KO vs. control), the difference in metastatic tumor burden of the same mice within each mouse genotype was significant (C) and (D). Panels (C) and (D) show the frequency distributions of a lung metastatic foci size in the heterozygous and homozygous mice, which primary tumors kinetics showed on panels (A) and (B), respectively. Each Y‐axis value shown in the histograms (C‐D) represents a count of metastatic foci within a metastatic size normalized interval (a bin). The bin was defined by rounding the metastatic size divided by 1000 to the nearest integer, and the number of metastatic foci in each bin was counted. Based on our findings, the metastases size frequency distribution in the lung has skewed form with the long right tail. To provide a visualization of such frequency distribution, we used log10 − log10 plot. We used the same color for dots of the empirical distributions and the fitting function lines, as was indicated in the figures. Such empirical frequency distribution was modeled and parameterized using the shifted log‐normal distribution function: f(x;y0,x0,a,b)=y0+aexp(0.5(ln(x/x0)/b)2), where x is the node size and y 0, x 0, a, b unknown parameters. We estimated the parameters using the nonlinear curve fitting option of SigmaPlot‐13 software. Datasets and detailed results of the parameterization of this function are presented in Table S9. (E‐F) show histogram bar plots for the distribution of the average number of metastases foci size in the lungs of Abi1 KO mice in comparison to their genetic controls. X‐axis indicates binning for every 5000 μm2 metastasis colony area size, with bin 1 representing 0–5000 μm2 and bin 21 representing 100001 μm2 and larger; Y‐axis: count of the samples within given binning interval (+/− SEM). The size stratification of individual metastatic colonies shows that mice lacking ABI1 still have relatively small metastatic colonies but they grow slowly or/and stay at dormant state and appear unable to establish macrometastases when compared to our controls (P < 0.001; Wilcoxon signed‐rank test). Lung metastasis quantification was performed following fixation, paraffin embedding and sectioning: three 5μm sections (sectioned every 50μm) were collected from each mouse (Abi1 fl/fl, Cre‐, n = 7; Abi1 fl/fl, Cre+, n = 6; Abi1 fl/wt, Cre‐, n = 6; Abi1 fl/wt, Cre+, n = 6; animals per genotype, age 18–22 weeks), were stained with hematoxylin and eosin, and imaged using Omnyx digital pathology scanner (GE Healthcare). Images were quantified using ImageJ software (NIH). Results of panels (E) and (F) support the results presented in (C) and (D). (G) Histological staining of representative lung sections reveals severely diminished metastasis upon deletion of the Abi1 gene. Scale bar, 1 mm. Inset, 4× magnification.

References

    1. Siegel RL, Miller KD, Jemal A. Cancer statistics, 2020. CA Cancer J Clin. 2020;70:7–30. 10.3322/caac.21590. - DOI - PubMed
    1. Redig AJ, McAllister SS. Breast cancer as a systemic disease: a view of metastasis. J Intern Med. 2013;274:113–26. 10.1111/joim.12084. - DOI - PMC - PubMed
    1. Spence HJ, Timpson P, Tang HR, Insall RH, Machesky LM. Scar/WAVE3 contributes to motility and plasticity of lamellipodial dynamics but not invasion in three dimensions. Biochem J. 2012;448:35–42. 10.1042/BJ20112206. - DOI - PMC - PubMed
    1. Yokotsuka M, Iwaya K, Saito T, Pandiella A, Tsuboi R, Kohno N, et al. Overexpression of HER2 signaling to WAVE2‐Arp2/3 complex activates MMP‐independent migration in breast cancer. Breast Cancer Res Treat. 2011;126:311–8. 10.1007/s10549-010-0896-x. - DOI - PubMed
    1. Chen Z, Borek D, Padrick SB, Gomez TS, Metlagel Z, Ismail AM, et al. Structure and control of the actin regulatory WAVE complex. Nature. 2010;468:533–8. 10.1038/nature09623. - DOI - PMC - PubMed

Publication types

Substances