Review
. 2022 Feb 8;94(5):2434-2443.
doi: 10.1021/acs.analchem.1c04174. Epub 2021 Dec 30.

Quantitative Accuracy and Precision in Multiplexed Single-Cell Proteomics

Affiliations
Review

Quantitative Accuracy and Precision in Multiplexed Single-Cell Proteomics

Claudia Ctortecka et al. Anal Chem. .

Abstract

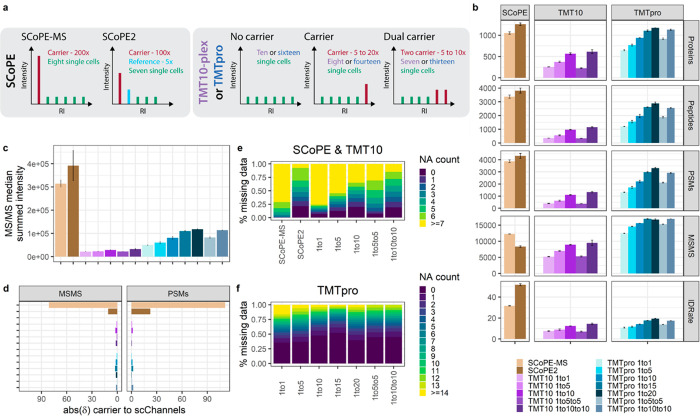
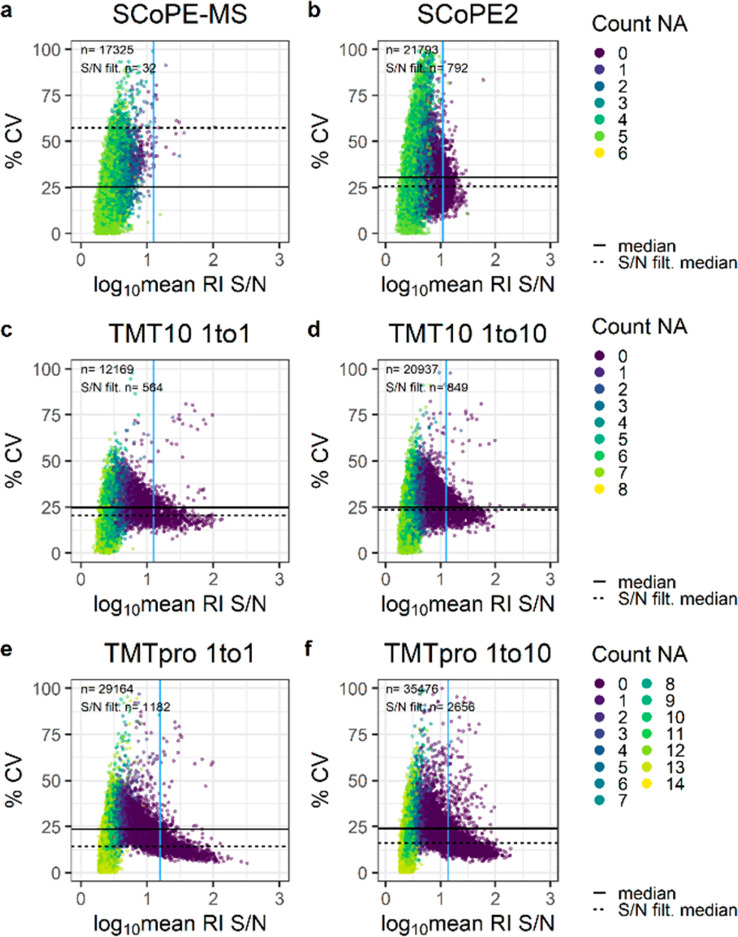
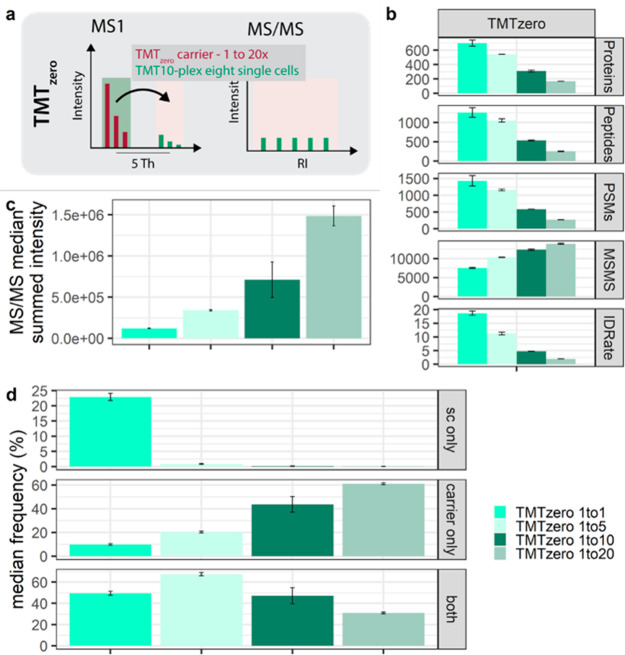
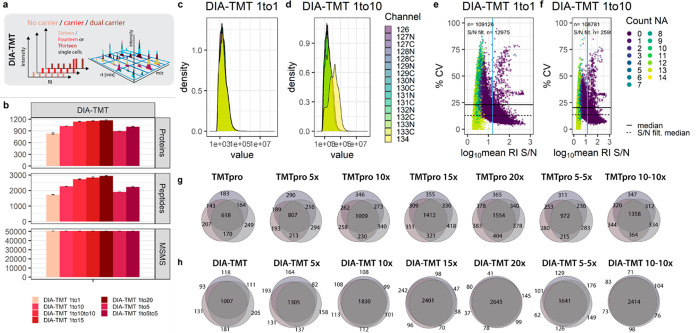
Single-cell proteomics workflows have considerably improved in sensitivity and reproducibility to characterize as-yet unknown biological phenomena. With the emergence of multiplexed single-cell proteomics, studies increasingly present single-cell measurements in conjunction with an abundant congruent carrier to improve the precursor selection and enhance identifications. While these extreme carrier spikes are often >100× more abundant than the investigated samples, the total ion current undoubtably increases but the quantitative accuracy possibly is affected. We here focus on narrowly titrated carrier spikes (i.e., <20×) and assess their elimination for a comparable sensitivity with superior accuracy. We find that subtle changes in the carrier ratio can severely impact the measurement variability and describe alternative multiplexing strategies to evaluate data quality. Lastly, we demonstrate elevated replicate overlap while preserving acquisition throughput at an improved quantitative accuracy with DIA-TMT and discuss optimized experimental designs for multiplexed proteomics of trace samples. This comprehensive benchmarking gives an overview of currently available techniques and guides the conceptualization of the optimal single-cell proteomics experiment.


Conflict of interest statement

The authors declare no competing financial interest.

Figures

Figure 1
Figure 1
Characterization of TMT multiplexed carrier titrations. (a) Graphical illustration of experimental setups and carrier compositions. (b) Identified proteins, peptide groups, PSMs, number of MS/MS scans, and ID-rates. (c) Median summed MS/MS intensity. (d) δ-Value between expected and acquired carrier to “single-cell” ratio across all MS/MS scans or PSMs for SCoPE (brown), TMT10 (purple), and TMTpro (blue) samples at the indicated carrier spikes. Median and median absolute deviation (mad) are shown. Percent of missing quantitative data in (e) SCoPE and TMT10 and (f) TMTpro carrier titrations per PSM.
Figure 2
Figure 2
Quantification accuracy of various carrier titrations. Percent CV across “single-cell” channels and log10 mean RI S/N for (a and b) SCoPE, (c and d) TMT10, and (e and f) TMTpro samples at the given carrier ratios. The horizontal solid and dashed lines indicate the median S/N across all MS/MS scans and post-S/N filtering, respectively. The vertical blue line specifies the S/N filter cutoff. Colors reflect the number of missing “single-cell” RIs per MS/MS scan.
Figure 3
Figure 3
Measurement variability with intercarrier spikes using TMTzero. (a) Graphical illustration of the TMTzero triggering strategy. (b) Protein groups, peptide groups, PSMs, MS/MS scans, and ID rates. (c) Median summed MS/MS intensity. (d) Percent median frequency of MS/MS scans across “single-cell” RIs (sc only), only carrier RI (carrier only), and coisolation of carrier and “single-cell” precursors within one MS/MS scan (both) at indicated carrier spikes. Median and mad are shown.
Figure 4
Figure 4
Impact of intentional coisolation on “single-cell” variability and accuracy. (a) Graphical illustration of DIA-TMT acquisition strategies with carrier titrations. (b) Protein groups, peptide groups, and MS/MS scans of DIA-TMT samples at indicated carrier spikes. Median and mad are shown. (c and d) RI intensity distributions across all MS/MS scans and (e and f) %CV against log10 mean RI S/N for DIA-TMT samples at indicated carrier spikes. The horizontal solid and dashed lines indicate the median S/N across all MS/MS scans and post-S/N filtering, respectively. The vertical blue line indicates the S/N filter cutoff. Colors indicate the number of missing single-cell RIs. Replicate overlap of (g) DDA and the corresponding (h) DIA-TMT samples based on unique peptides.
Figure 5
Figure 5
Cumulative comparison of measurement accuracy, variance, and reproducibility across all experimental setups. (a) Identified proteins groups; (b) S/N-filtered protein groups (of note, the DIA-TMTpro panel is not included as single MS/MS scans do not give rise to protein identifications); (c) δ-carrier to “single-cell” intensities (optimal value of 0); (d) percent of MS/MS scans with “single-cell” RI within ±50% of expected carrier ratio (of note, TMTzero is not included for panels c and d as the “single-cell” carrier ratio cannot be determined within one MS/MS scan); and (e) percent replicate overlap across triplicates based on unique peptides for SCoPE (brown), TMT10 (purple), TMTpro (blue), TMTzero (turquoise), and DIA-TMT (red). Bar graphs display the median, and error bars indicate the mad.

References

    1. Zhu Y.; Scheibinger M.; Ellwanger D. C.; Krey J. F.; Choi D.; Kelly R. T.; Heller S.; Barr-Gillespie P. G. Single-Cell Proteomics Reveals Changes in Expression during Hair-Cell Development. eLife 2019, 8, e5077710.7554/eLife.50777. - DOI - PMC - PubMed
    1. Izar B.; Tirosh I.; Stover E. H.; Wakiro I.; Cuoco M. S.; Alter I.; Rodman C.; Leeson R.; Su M.-J.; Shah P.; Iwanicki M.; Walker S. R.; Kanodia A.; Melms J. C.; Mei S.; Lin J.-R.; Porter C. B. M.; Slyper M.; Waldman J.; Jerby-Arnon L.; Ashenberg O.; Brinker T. J.; Mills C.; Rogava M.; Vigneau S.; Sorger P. K.; Garraway L. A.; Konstantinopoulos P. A.; Liu J. F.; Matulonis U.; Johnson B. E.; Rozenblatt-Rosen O.; Rotem A.; Regev A. A Single-Cell Landscape of High-Grade Serous Ovarian Cancer. Nat. Med. 2020, 26 (8), 1271–1279. 10.1038/s41591-020-0926-0. - DOI - PMC - PubMed
    1. Lombard-Banek C.; Moody S. A.; Nemes P. Single-Cell Mass Spectrometry for Discovery Proteomics: Quantifying Translational Cell Heterogeneity in the 16-Cell Frog (Xenopus) Embryo. Angew. Chem., Int. Ed. 2016, 55 (7), 2454–2458. 10.1002/anie.201510411. - DOI - PMC - PubMed
    1. Thul P. J.; Åkesson L.; Wiking M.; Mahdessian D.; Geladaki A.; Blal H. A.; Alm T.; Asplund A.; Björk L.; Breckels L. M.; Bäckström A.; Danielsson F.; Fagerberg L.; Fall J.; Gatto L.; Gnann C.; Hober S.; Hjelmare M.; Johansson F.; Lee S.; Lindskog C.; Mulder J.; Mulvey C. M.; Nilsson P.; Oksvold P.; Rockberg J.; Schutten R.; Schwenk J. M.; Sivertsson Å.; Sjöstedt E.; Skogs M.; Stadler C.; Sullivan D. P.; Tegel H.; Winsnes C.; Zhang C.; Zwahlen M.; Mardinoglu A.; Pontén F.; von Feilitzen K.; Lilley K. S.; Uhlén M.; Lundberg E. A Subcellular Map of the Human Proteome. Science 2017, 356 (6340), aal3321.10.1126/science.aal3321. - DOI - PubMed
    1. Cong Y.; Motamedchaboki K.; Misal S. A.; Liang Y.; Guise A. J.; Truong T.; Huguet R.; Plowey E. D.; Zhu Y.; Lopez-Ferrer D.; Kelly R. T. Ultrasensitive Single-Cell Proteomics Workflow Identifies > 1000 Protein Groups per Mammalian Cell. Chem. Sci. 2021, 12, 1001.10.1039/D0SC03636F. - DOI - PMC - PubMed

Publication types