. 2022 Jan 11;119(2):e2110166119.
doi: 10.1073/pnas.2110166119.

Hemochromatosis drives acute lethal intestinal responses to hyperyersiniabactin-producing Yersinia pseudotuberculosis

Affiliations

Hemochromatosis drives acute lethal intestinal responses to hyperyersiniabactin-producing Yersinia pseudotuberculosis

Shreya Das et al. Proc Natl Acad Sci U S A. .

Abstract

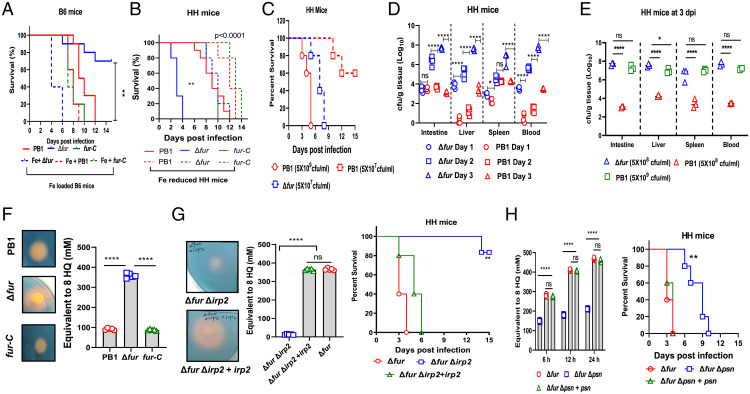
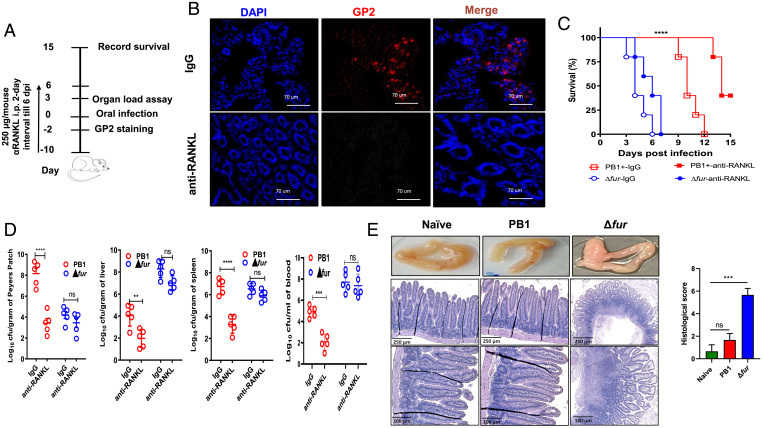
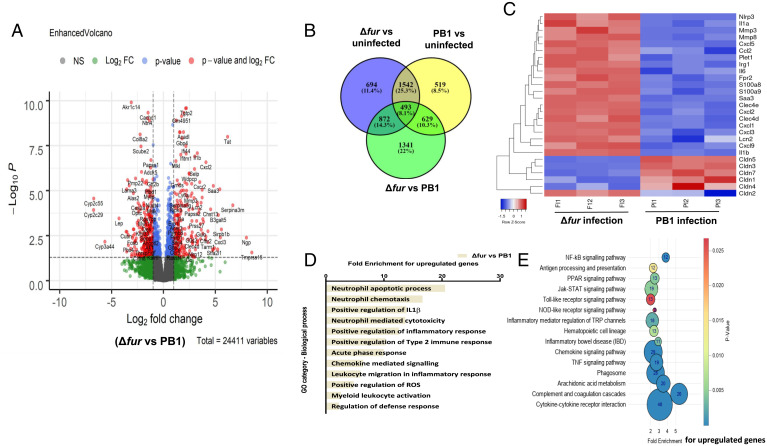
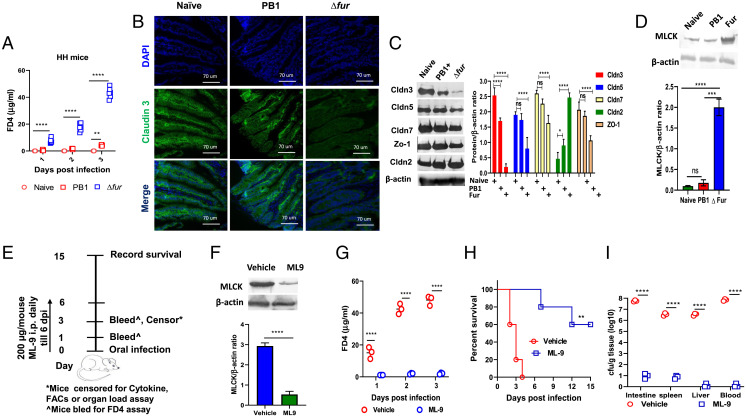
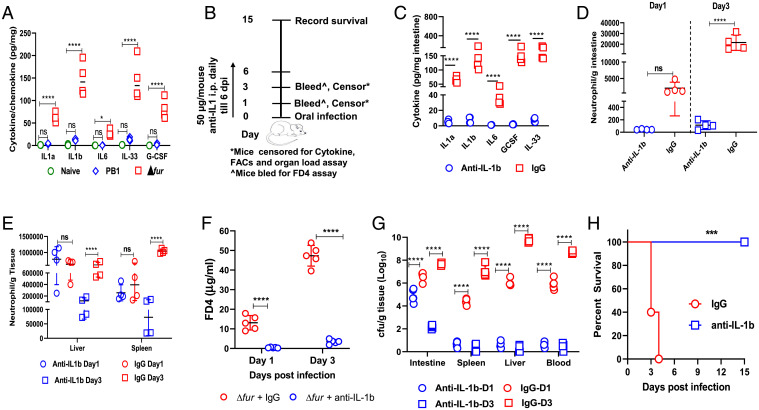
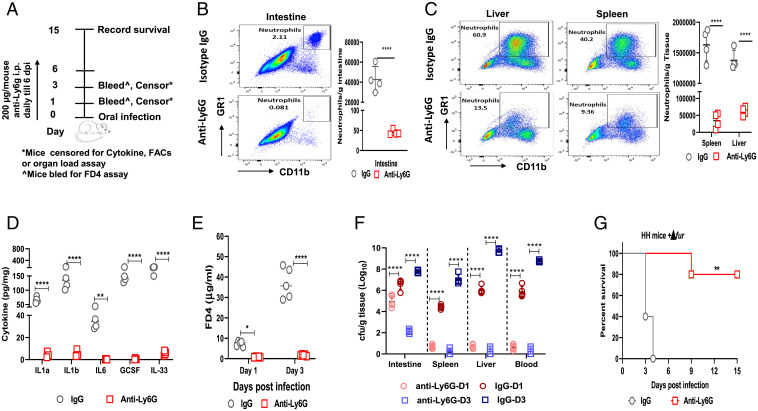
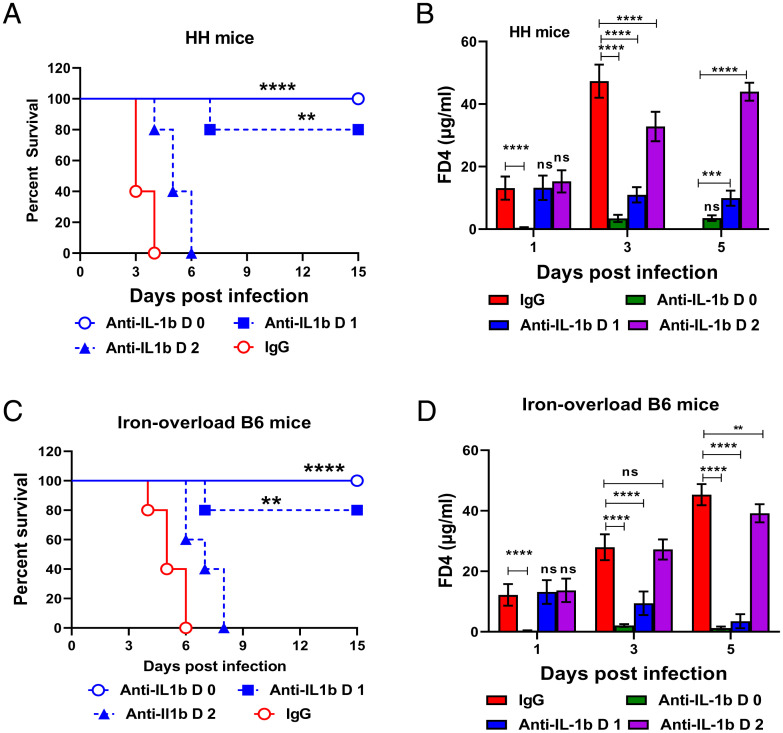
Hemachromatosis (iron-overload) increases host susceptibility to siderophilic bacterial infections that cause serious complications, but the underlying mechanisms remain elusive. The present study demonstrates that oral infection with hyperyersiniabactin (Ybt) producing Yersinia pseudotuberculosis Δfur mutant (termed Δfur) results in severe systemic infection and acute mortality to hemochromatotic mice due to rapid disruption of the intestinal barrier. Transcriptome analysis of Δfur-infected intestine revealed up-regulation in cytokine-cytokine receptor interactions, the complement and coagulation cascade, the NF-κB signaling pathway, and chemokine signaling pathways, and down-regulation in cell-adhesion molecules and Toll-like receptor signaling pathways. Further studies indicate that dysregulated interleukin (IL)-1β signaling triggered in hemachromatotic mice infected with Δfur damages the intestinal barrier by activation of myosin light-chain kinases (MLCK) and excessive neutrophilia. Inhibiting MLCK activity or depleting neutrophil infiltration reduces barrier disruption, largely ameliorates immunopathology, and substantially rescues hemochromatotic mice from lethal Δfur infection. Moreover, early intervention of IL-1β overproduction can completely rescue hemochromatotic mice from the lethal infection.

Keywords: Yersinia pseudotuberculosis; hemochromatosis; hyperinflammation; lethal infection; siderophore.


Conflict of interest statement

The authors declare no competing interest.

Figures

Fig. 1.
Fig. 1.
The high Ybt-producing Y. pseudotuberculosis Δfur mutant is hypervirulent to iron-overloaded mice. (A) Survival of WT B6 or iron-loaded B6 mice (n = 5 per group) infected with PB1, Δfur, or fur-C. (B) Survival of HH- or iron-reduced mice (n = 5 per group) infected as in B. (C) Survival of HH mice (n = 5 per group) infected with PB1 or Δfur. (D) Bacterial burden in PB1- or Δfur-infected HH mice (n = 5 per group) over the course of infection. (E) Bacterial burden in HH mice (n = 5 per group) infected with different dose of PB1 at 3 dpi. (F) Secretion of Ybt by PB1, Δfur, and Δfur complemented with fur (termed fur-C) grown to an OD600 of 0.8 in 5 mL LB broth at 28 °C. (G) Comparison of Ybt released by Δfur, ΔfurΔirp2, and ΔfurΔirp2 complemented with irp2 (termed ΔfurΔirp2+irp2) grown to an OD600 of 0.8 in 5 mL LB broth at 28 °C and their virulence in HH mice (n = 5 per group). (H) Comparison of Ybt released by Δfur, ΔfurΔpsn, and ΔfurΔpsn complemented with psn (termed ΔfurΔpsn+psn) (0.1 OD600 each bacterial culture) grown in 5 mL LB for the indicated period of time, and their virulence in HH mice (n = 5 per group). ns, no significance; *P < 0.05; **P < 0.01; ****P < 0.0001.
Fig. 2.
Fig. 2.
The hypervirulence of Δfur is independent of M-cell translocation. (A) Schematic of M-cell depletion by administering anti-RANKL antibodies. (B) Immunofluorescence staining of GP2+ M cells from ileal PPs from HH mice treated with anti-RANKL or IgG (n = 5 per group). Cell nuclei were stained with DAPI. Representative images from each group are shown. (C) Survival of anti-RANKL– and IgG-treated HH mice (n = 5 per group) infected with 5 × 10⁸ CFU of PB1 or Δfur. (D) Bacterial burden in the tissues and blood of HH mice (n = 5 per group) infected as described in C at 3 dpi. (E) Representative gross pathology and histopathology images (H&E stain) and histological scoring of the intestine sections from HH mice infected as described in C at 3 dpi (n = 3 per group). The intestine sections of naïve mice served as uninfected controls. The H&E-stained intestine sections were blindly assessed and scored by three individuals, as described earlier (60). ns, no significance; **P < 0.01; ***P < 0.001; ****P < 0.0001.
Fig. 3.
Fig. 3.
Transcriptome of the small intestine from infected HH mice. RNA-seq analysis of gene alterations in naïve, Δfur- or PB1-infected HH mice at 3 dpi (n = 3 per group). (A) Volcano plot showing DEGs. (B) Venn diagram of DEGs from naïve vs. PB1 vs. Δfur. (C) Heat map of selected host transcripts based on the DESeq2 analysis. Color coding is based on the rlog transformed read count values. (D) KEGG pathway analysis of up-regulated gene targets in the Δfur-infected mouse transcriptome. (E) GO functional clustering of genes that were up-regulated for biological processes (the most significantly affected categories are listed).
Fig. 4.
Fig. 4.
Disruption of the intestinal TJ and increase in MLCK in Δfur-infected HH mice. (A) Serum FD4 levels were assessed at 4-h following oral administration in naïve, PB1-, and Δfur-infected HH mice (n = 6 per group). (B) Immunofluorescence staining of claudin-3 in the small intestine of mice (n = 3 per group) described in A at 3 dpi. Representative images from each group are shown. Cell nuclei were stained with DAPI. (C) Representative immunoblot analysis of small intestine homogenates from infected HH mice (n = 3 per group) as described in A at 3 dpi. β-Actin was used as a loading control. The protein levels of the indicated claudins and ZO-1 in the small intestine of uninfected or infected mice (n = 3) were quantified by ImageJ software and normalized to the level of β-actin. (D) Analysis of the level of MLCK (n = 3 per group) by immunoblot as described in C. (E) Schematic of the inhibition of MLCK by administering ML-9. (F) Detection of MLCK in the small intestine of ML-9– or vehicle-treated Δfur-infected mice (n = 3 per group) at 3 dpi by immunoblot. (G) The serum FD4 level at 3 dpi (n = 3 per group). (H) Survival (n = 5 per group) of Δfur-infected mice treated with ML-9 or the vehicle. (I) Bacterial load in different tissues (n = 3 per group) at 3 dpi as in F. ns, no significance; *P < 0.05; **P < 0.01; ***P < 0.001; ****P < 0.0001.
Fig. 5.
Fig. 5.
Blockage of IL-1β prevents TJ disruption and rescues Δfur-infected HH mice. (A) Cytokine analysis of the small intestine from naïve-, Δfur-, or PB1-infected HH mice (n = 4 per group) at 3 dpi. (B) Schematic of the neutralization of IL-1β in Δfur-infected HH mice. (C) Cytokines in the small intestine of Δfur-infected mice (n = 4 per group) treated with anti–IL-1β or IgG at 3 dpi. (D and E) Quantification of neutrophils (CD11b+ Ly6G+) in the small intestine (D), liver, or spleen (E) from Δfur-infected mice (n = 4 per group) treated with anti–IL-1β or IgG at 1 and 3 dpi using flow cytometry. (F) Serum FD4 levels in infected mice (n = 5 per group) at 3 dpi as described in B. (G) Bacterial load in different tissues of infected mice (n = 5 per group). (G) Survival of Δfur-infected mice (n = 5 per group) treated with anti–IL-1β or IgG. ns, no significance; *P < 0.05; ***P < 0.001; ****P < 0.0001.
Fig. 6.
Fig. 6.
Inhibition of neutrophilia prevents TJ disruption and rescues Δfur-infected HH mice. (A) Schematic of neutrophil depletion in Δfur-infected HH mice. (B and C) Quantification of neutrophils (CD11b+ Ly6G+ GR1+) in the small intestine (B), liver, or spleen (C) from Δfur-infected mice (n = 4 per group) treated with anti-Ly6G or the isotype control at 3 dpi using flow cytometry. (D) Cytokines in the small intestine homogenates at 3 dpi from infected mice (n = 4) as in B. (E) Serum FD4 levels in infected mice (n = 5 per group) at 3 dpi as described in B. (F) Bacterial load in different tissues of infected mice (n = 5 per group) at 3 dpi as described in B. (G) Survival of Δfur-infected mice (n = 5 per group) treated with anti-Ly6G or IgG. ns, no significance; *P < 0.05; **P < 0.01; ****P < 0.0001.
Fig. 7.
Fig. 7.
Anti–IL-1β treatment ameliorates the susceptibility of iron-overloaded mice to Δfur infection. Δfur-infected hemochromatotic mice were treated with anti–IL-1β or IgG at 1 and 2 dpi, respectively. (A) Survival of HH mice (n = 5 per group). (B) Analysis of FD4 in serum from HH mice (n = 5 per group). (C) Survival of iron-overloaded B6 mice (n = 5 per group). (D) Analysis of FD4 in serum from iron-overloaded B6 mice (n = 5 per group). ns, no significance; **P < 0.01; ***P < 0.001; ****P < 0.0001.

References

    1. Cassat J. E., Skaar E. P., Iron in infection and immunity. Cell Host Microbe 13, 509–519 (2013). - PMC - PubMed
    1. Rakin A., Schneider L., Podladchikova O., Hunger for iron: The alternative siderophore iron scavenging systems in highly virulent Yersinia. Front. Cell. Infect. Microbiol. 2, 151 (2012). - PMC - PubMed
    1. Khan F. A., Fisher M. A., Khakoo R. A., Association of hemochromatosis with infectious diseases: Expanding spectrum. Int. J. Infect. Dis. 11, 482–487 (2007). - PubMed
    1. Pietrangelo A., Hereditary hemochromatosis: Pathogenesis, diagnosis, and treatment. Gastroenterology 139, 393–408, 408 e1–2 (2010). - PubMed
    1. Emanuele D., Tuason I., Edwards Q. T., HFE-associated hereditary hemochromatosis: Overview of genetics and clinical implications for nurse practitioners in primary care settings. J. Am. Assoc. Nurse Pract. 26, 113–122 (2014). - PubMed

Publication types

MeSH terms