

Higher-order effects, continuous species interactions, and trait evolution shape microbial spatial dynamics
- PMID: 34969851
- PMCID: PMC8740587
- DOI: 10.1073/pnas.2020956119
Higher-order effects, continuous species interactions, and trait evolution shape microbial spatial dynamics
Abstract
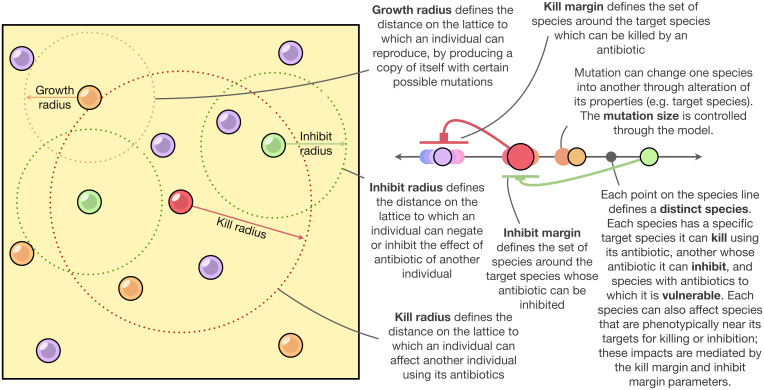
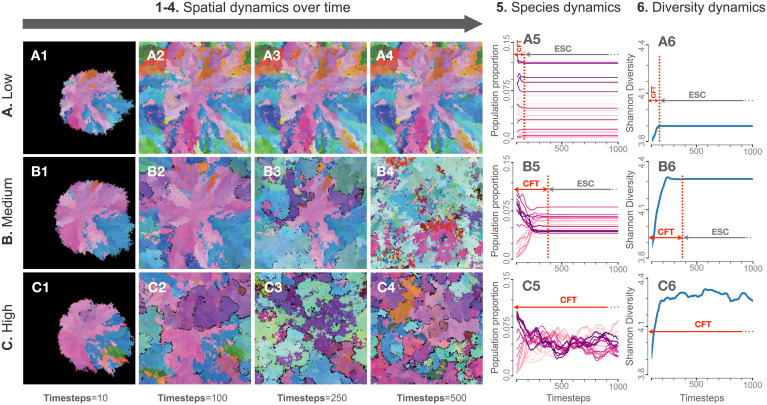
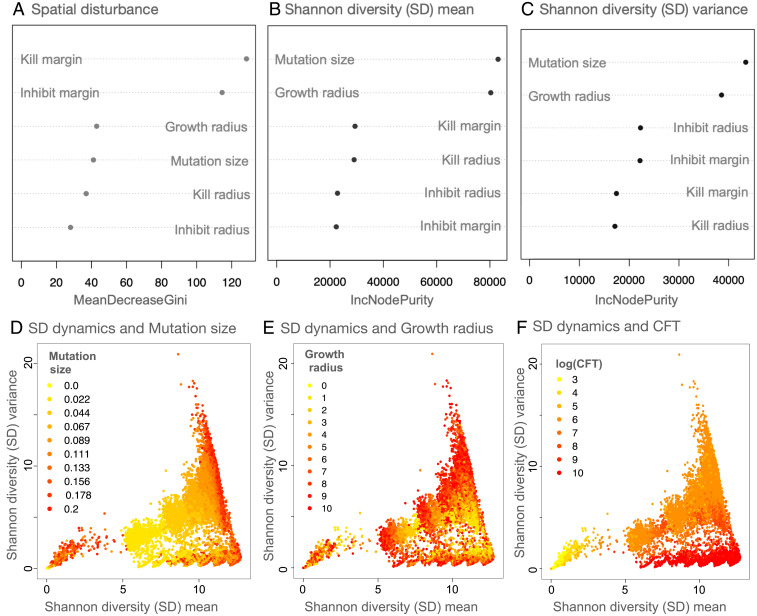
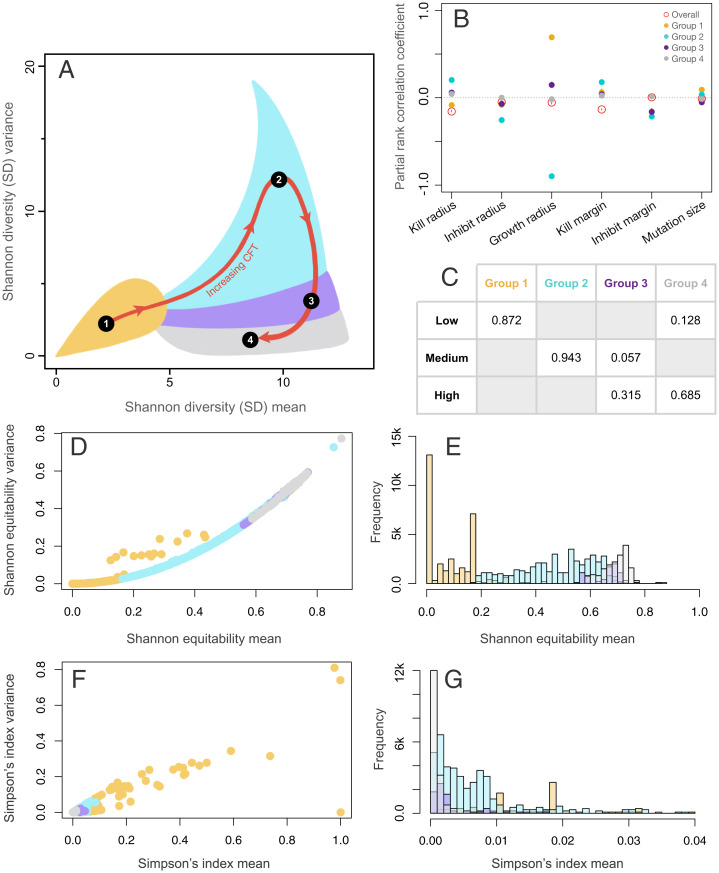
The assembly and maintenance of microbial diversity in natural communities, despite the abundance of toxin-based antagonistic interactions, presents major challenges for biological understanding. A common framework for investigating such antagonistic interactions involves cyclic dominance games with pairwise interactions. The incorporation of higher-order interactions in such models permits increased levels of microbial diversity, especially in communities in which antibiotic-producing, sensitive, and resistant strains coexist. However, most such models involve a small number of discrete species, assume a notion of pure cyclic dominance, and focus on low mutation rate regimes, none of which well represent the highly interlinked, quickly evolving, and continuous nature of microbial phenotypic space. Here, we present an alternative vision of spatial dynamics for microbial communities based on antagonistic interactions-one in which a large number of species interact in continuous phenotypic space, are capable of rapid mutation, and engage in both direct and higher-order interactions mediated by production of and resistance to antibiotics. Focusing on toxin production, vulnerability, and inhibition among species, we observe highly divergent patterns of diversity and spatial community dynamics. We find that species interaction constraints (rather than mobility) best predict spatiotemporal disturbance regimes, whereas community formation time, mobility, and mutation size best explain patterns of diversity. We also report an intriguing relationship among community formation time, spatial disturbance regimes, and diversity dynamics. This relationship, which suggests that both higher-order interactions and rapid evolution are critical for the origin and maintenance of microbial diversity, has broad-ranging links to the maintenance of diversity in other systems.
Keywords: community assembly; continuous species model; cyclic dominance; eco-evolutionary dynamics; higher-order interactions.
Copyright © 2021 the Author(s). Published by PNAS.
Conflict of interest statement
The authors declare no competing interest.
Figures
References
-
- Hutchinson G. E., The paradox of the plankton. Am. Nat. 95, 137–145 (1961).
-
- May R. M., Will a large complex system be stable? Nature 238, 413–414 (1972). - PubMed
-
- Chesson P., Mechanisms of maintenance of species diversity. Annu. Rev. Ecol. Syst. 31, 343–366 (2000).
-
- McCann K. S., The diversity-stability debate. Nature 405, 228–233 (2000). - PubMed
Publication types
MeSH terms
LinkOut - more resources
Full Text Sources
