. 2022 Jan 4;119(1):e2023328119.
doi: 10.1073/pnas.2023328119.

Sod1 integrates oxygen availability to redox regulate NADPH production and the thiol redoxome

Affiliations

Sod1 integrates oxygen availability to redox regulate NADPH production and the thiol redoxome

Claudia Montllor-Albalate et al. Proc Natl Acad Sci U S A. .

Abstract

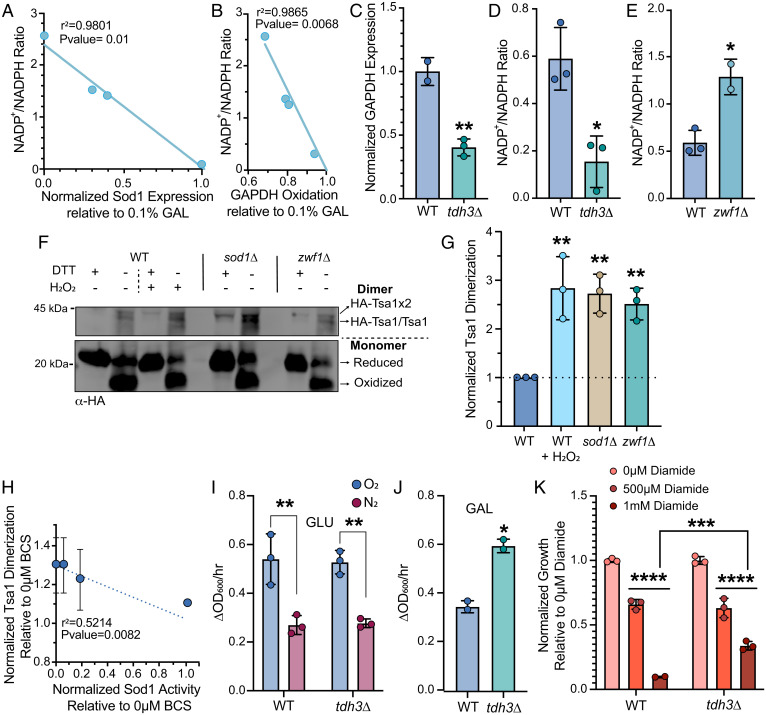
Cu/Zn superoxide dismutase (Sod1) is a highly conserved and abundant antioxidant enzyme that detoxifies superoxide (O2•-) by catalyzing its conversion to dioxygen (O2) and hydrogen peroxide (H2O2). Using Saccharomyces cerevisiae and mammalian cells, we discovered that a major aspect of the antioxidant function of Sod1 is to integrate O2 availability to promote NADPH production. The mechanism involves Sod1-derived H2O2 oxidatively inactivating the glycolytic enzyme, GAPDH, which in turn reroutes carbohydrate flux to the oxidative phase of the pentose phosphate pathway (oxPPP) to generate NADPH. The aerobic oxidation of GAPDH is dependent on and rate-limited by Sod1. Thus, Sod1 senses O2 via O2•- to balance glycolytic and oxPPP flux, through control of GAPDH activity, for adaptation to life in air. Importantly, this mechanism for Sod1 antioxidant activity requires the bulk of cellular Sod1, unlike for its role in protection against O2•- toxicity, which only requires <1% of total Sod1. Using mass spectrometry, we identified proteome-wide targets of Sod1-dependent redox signaling, including numerous metabolic enzymes. Altogether, Sod1-derived H2O2 is important for antioxidant defense and a master regulator of metabolism and the thiol redoxome.

Keywords: glycolysis; oxygen sensing; pentose phosphate pathway; redox signaling; superoxide dismutase.


Conflict of interest statement

The authors declare no competing interest.

Figures

Fig. 1.
Fig. 1.
Cytosolic Sod1 interacts with and regulates glycolysis via the redox regulation of GAPDH. (A) Glucose consumption per cell for WT and sod1Δ cells grown aerobically (O2) or anaerobically (N2). The data are derived from the slope of the linear regions of plots measuring extracellular glucose as a function of culture density (SI Appendix, Fig. S1A). The data represent the average ± SD from two biological replicates. See also SI Appendix, Fig. S1B. (B and C) Time-resolved intracellular pH measurements of glucose starved cells upon pulsing WT, sod1Δ, or pma1-tap cells expressing a GFP-based pH sensor, pHluorin, with 2% or 0% glucose (GLU) (B). The cytosolic acidification rate, a proxy for glycolytic activity (phase 1), and the rate of realkalization of the cytosol, a proxy for Pma1 activity (phase 2), is shown for the indicated strains (C). The data represent the average ± SD from triplicate cultures. See also SI Appendix, Fig. S1C. (D and E) Analysis of Sod1-dependent GAPDH oxidation as assessed by labeling reduced GAPDH with thiol reactive mPEG-mal. (D) Representative immunoblot of GAPDH–mPEG-mal adducts in sod1Δ cells expressing yeast Sod1 (SOD1) or EV cultured in 2% GLU. (E) The difference in GAPDH oxidation in the indicated strains as assessed by quantifying the ratio of unlabeled GAPDH (oxidized GAPDH) to total GAPDH, both labeled (reduced GAPDH) and unlabeled GADPH. n = 17 from 6 independent experimental trials. (F) Measurements of GAPDH enzymatic activity in sod1Δ cells expressing SOD1 or EV. Data represent the average ± SD from quadruplicate cultures. See SI Appendix, Fig. S3 A and B for representative kinetics traces. (G) Lysates from tdh1Δ tdh2Δ tdh3Δ cells expressing HA-Tdh3 or Tdh3 were subjected to IP using α-HA antibody and the IP material was analyzed by immunoblot (IB) using α-HA or α-Sod1 antibody. The data are representative of three independent trials with another replicate shown in SI Appendix, Fig. S2I. Experimental details are presented in SI Appendix, SI Materials and Methods. (H) Assessment of GAPDH oxidation in sod1Δ cells expressing yeast Sod1 (SOD1), mitochondrial IMS targeted Sod1 (Sco2-SOD1), or EV. See SI Appendix, Fig. S3 F and G for representative mPEG-mal immunoblots and quantification of percent GAPDH oxidation. Data represent the average ± SD from three independent trials. The statistical significance is indicated by asterisks using two-tailed Student’s t tests for pairwise comparisons (E and F) or by one-way ANOVA for multiple comparisons with Dunett’s post hoc test (A, C and H): **P < 0.01, ***P < 0.001, ****P < 0.0001, n.s., not significant.
Fig. 2.
Fig. 2.
Aerobic GAPDH oxidation is dependent on and rate-limited by Sod1 and requires Yno1 and mitochondrial respiration as superoxide sources. (A) Analysis of GAPDH oxidation as assessed by mPEG-mal labeling of GAPDH in WT, rho0, yno1Δ, and sod1Δ cells cultured in 2% GLU. See SI Appendix, Fig. S4 A and B for representative mPEG-mal immunoblots and quantification of GAPDH oxidation. Data represent the average ± SD from three independent trials. (B and C) Assessment of the Sod1-dependence on the aerobic oxidation of GAPDH. (B) Relative Sod1 activity to assess aerobic and anaerobic Sod1 maturation in sod1Δ cells expressing EV, WT SOD1, or the P144S sod1 mutant. See SI Appendix, Fig. S4G for representative SOD activity gels and quantification of Sod1 activity. Data represent the average ± SD from three independent cultures. (C) Analysis of GAPDH oxidation as assessed by mPEG-mal labeling of GAPDH in aerobic or anaerobic sod1Δ cells expressing EV, WT SOD1, or the P144S sod1 mutant. See SI Appendix, Fig. S4 H and I for representative mPEG-mal immunoblots and quantification of GAPDH oxidation. Data represent the average ± SD from two or three independent trials. (D and E) Analysis of GAPDH oxidation in WT or sod1Δ cells expressing GAL-driven SOD1 cultured with increasing concentrations of galactose (GAL) (0%, 0.005%, 0.0075%, 0.01% and 0.1% GAL). (D) Titration of SOD1 reveals a positive correlation between Sod1 expression and GAPDH oxidation from two independent trials. (E) Representative mPEG-mal and Sod1 immunoblot from which the Sod1-dependence of GAPDH oxidation was assessed. In D, GAPDH oxidation was normalized to that of the WT cells and the linear regression analysis of the two trials gives coefficients of determination (r2) of 0.81 and 0.77, with P values of 0.01 and 0.02, respectively. See also SI Appendix, Fig. S4J. The statistical significance relative to WT (A) is indicated by asterisks using ordinary one-way ANOVA with Dunett’s post hoc test for the indicated pairwise comparison in A, **P < 0.01. The statistical significance relative to the aerobic SOD1 expressing cells is indicated by asterisks using two-way ANOVA for multiple comparisons with Tukey’s post hoc test for the indicated pairwise comparisons in B and C: *P < 0.05, **P < 0.01, ***P < 0.001, ****P < 0.0001, n.s., not significant.
Fig. 3.
Fig. 3.
Sod1-mediated oxidative inactivation of GAPDH results in increased NADPH production and resistance to oxidative stress. (A and B) Sod1 expression positively correlates with GAPDH oxidation (A) and NADPH production (B). See SI Appendix, Fig. S5A for representative immunoblots assessing Sod1 expression and GAPDH oxidation by mPEG-mal labeling in sod1Δ cells expressing GAL-driven SOD1 cultured with increasing concentrations of galactose (GAL) (0.005%, 0.0075%, 0.01%, and 0.1% GAL). The NADP+/NADPH ratio inversely correlates with normalized Sod1 expression (A) and GAPDH oxidation (B), with linear regression analysis in A and B giving coefficient of determinations (r2) of 0.98 and 0.99 and P values of 0.01 and 0.007, respectively. See also SI Appendix, Fig. S5 B–G for representative correlation plots between Sod1 expression or GAPDH oxidation and NADP+/NADPH ratio and NADPH concentration. (C and D) Depletion of intracellular GAPDH decreases the NADP+/NADPH ratio. (C) GAPDH expression is reduced by ∼60% in tdh3Δ cells as assessed by immunoblot analysis (see SI Appendix, Fig. S5H for representative GPADH immunoblots). (D) Measurements of the NADP+/NADPH ratio in WT and tdh3Δ. Data represent the average ± SD from triplicate cultures. (E) Ablation of G6PD (Zwf1) increases the cellular NADP+/NADPH ratio. Data represent the average ± SD from triplicate cultures. (F and G) Ablation of Sod1 and Zwf1 increases DTT-reversible disulfide oxidation and dimerization of peroxiredoxin (HA-Tsa1x2). Representative immunoblot of HA-Tsa1 in WT, both treated and untreated with H2O2 or DTT, sod1Δ, and zwf1Δ cells. Tsa1 proteoforms identified include oxidized and reduced monomer and disulfide oxidized dimer (F). Quantification of the fraction of disulfide oxidized Tsa1 dimer over the total amount of Tsa1 from three independent trials (G). Data represent the average ± SD. Assignment of HA-Tsa1 proteoforms are derived from SI Appendix, Fig. S6. (H) Sod1 activity inversely correlates w+ith Tsa1 disulfide dimerization. Sod1 activity, as titrated using the copper chelator, BCS, negatively correlates with disulfide dimerized HA-Tsa1. Representative Sod1 activity gel and HA-Tsa1 immunoblot analysis are shown in SI Appendix, Fig. S7 F and G. (I–K) Aerobic and anerobic growth rates in 2% glucose media (I), aerobic growth rate in 2%GAL media (J), and diamide sensitivity (K) of WT and tdh3Δ cells. In K, growth after 9 h of exposure to diamide is reported. See SI Appendix, Fig. S7 H and I for complete growth curves. Data represent the average ± SD from triplicate cultures. The statistical significance relative to WT is indicated by asterisks using two-tailed Student’s t test for pairwise comparisons in C, D, E, and J: *P < 0.05, ***P < 0.001. The statistical significance relative to WT (I) is indicated by asterisks using ordinary one-way ANOVA with Dunett’s post hoc test for the indicated pairwise comparison in I, *P < 0.05. The statistical significance relative to the aerobic growth rate (I) or 0 µM diamide (K) is indicated by asterisks using two-way ANOVA for multiple comparisons with Dunett’s or Tukey’s post hoc test for the indicated pairwise comparisons in I and K, respectively; **P < 0.01, ***P < 0.001, ****P < 0.0001.
Fig. 4.
Fig. 4.
Redox proteomics identifies additional putative targets of Sod1 redox regulation. (A) SILAC-TMT redox proteomics workflow. SILAC labels distinguish the cellular origin of each peptide. Cysteine-reactive and isobaric iodo-TMT reporters, undetectable during the first MS stage (MS1) and released during peptide fragmentation in MS2, enable unique cysteine %oxidation calculation in WT and sod1Δ cells. (B) Plot of aggregated average cysteine oxidation difference relative to protein expression difference in sod1Δ vs. WT cells. Points near the origin (0,0) undergo less change in relative abundance and cysteine oxidation compared to points further from the origin. Cysteine coverage indicates the fraction of cysteine residues detected for each protein. (C) Volcano plot of −log10(P value) relative to protein expression difference [log2(sod1Δ/WT)] calculated from aggregate SILAC data. Proteins above −log10(P value) 1.3 are significantly different in abundance between the two strains (P < 0.05). Positive and negative values of log2(sod1Δ/WT) indicate proteins that are more expressed in sod1Δ and WT, respectively. Proteins with a single detected label are indicated as ± infinity. (D) Subset of data from C, showing expression change for proteins associated with bioprocesses functionally associated with loss of SOD1. See also SI Appendix, Fig. S9B. (E) Median FE values for GO bins observed for proteins undergoing greater than twofold change in abundance between sod1Δ and WT cells. (F) Volcano plot of −log10(P value) relative to protein expression difference [%Oxsod1Δ − %OxWT] calculated from iodo-TMT data aggregated at the cysteine level. −Log10(P value) of 1.3 or above indicate significantly different cysteine oxidation between the two strains (P < 0.05). See also SI Appendix, Fig. S10A. (G) Kyoto Encyclopedia of Genes and Genomes (KEGG) Brite and Pathway enrichment analysis for the 96 proteins harboring oxidation sites that change significantly in the absence of SOD1. Number of associated proteins shown in parentheses. See also SI Appendix, Fig. S9D. (H) Median FE values for GO bins observed for proteins with at least one cysteine undergoing >5% difference in oxidation between WT and sod1Δ. (I) Rank-ordered plot of cysteine residues from proteins that exhibit statistically significant differences in oxidation between sod1Δ and WT. Statistical outliers in oxidation change between strains (circle size) and with respect to other cysteine residues contained within share bioprocess (blue halo, blue text) are indicated. (J) Deconvoluted oxidation differences for proteins in which a single cysteine was found to be a statistical outlier from other observed cysteine oxidation sites in the same protein. See also SI Appendix, Fig. S10B.
Fig. 5.
Fig. 5.
Proposed model for how Sod1 integrates O2 availability to regulate GAPDH oxidation and balance flux between glycolysis and the oxPPP to produce NADPH.

References

    1. Reddi A. R., Culotta V. C., Regulation of manganese antioxidants by nutrient sensing pathways in Saccharomyces cerevisiae. Genetics 189, 1261–1270 (2011). - PMC - PubMed
    1. Teixeira H. D., Schumacher R. I., Meneghini R., Lower intracellular hydrogen peroxide levels in cells overexpressing CuZn-superoxide dismutase. Proc. Natl. Acad. Sci. U.S.A. 95, 7872–7875 (1998). - PMC - PubMed
    1. Flint D. H., Tuminello J. F., Emptage M. H., The inactivation of Fe-S cluster containing hydro-lyases by superoxide. J. Biol. Chem. 268, 22369–22376 (1993). - PubMed
    1. Liochev S. I., Fridovich I., Superoxide and iron: Partners in crime. IUBMB Life 48, 157–161 (1999). - PubMed
    1. Imlay J. A., Pathways of oxidative damage. Annu. Rev. Microbiol. 57, 395–418 (2003). - PubMed

Publication types

LinkOut - more resources