. 2022 Jan;7(1):48-61.
doi: 10.1038/s41564-021-01020-9. Epub 2021 Dec 30.

A catalogue of 1,167 genomes from the human gut archaeome

Affiliations

A catalogue of 1,167 genomes from the human gut archaeome

Cynthia Maria Chibani et al. Nat Microbiol. 2022 Jan.

Erratum in

Abstract

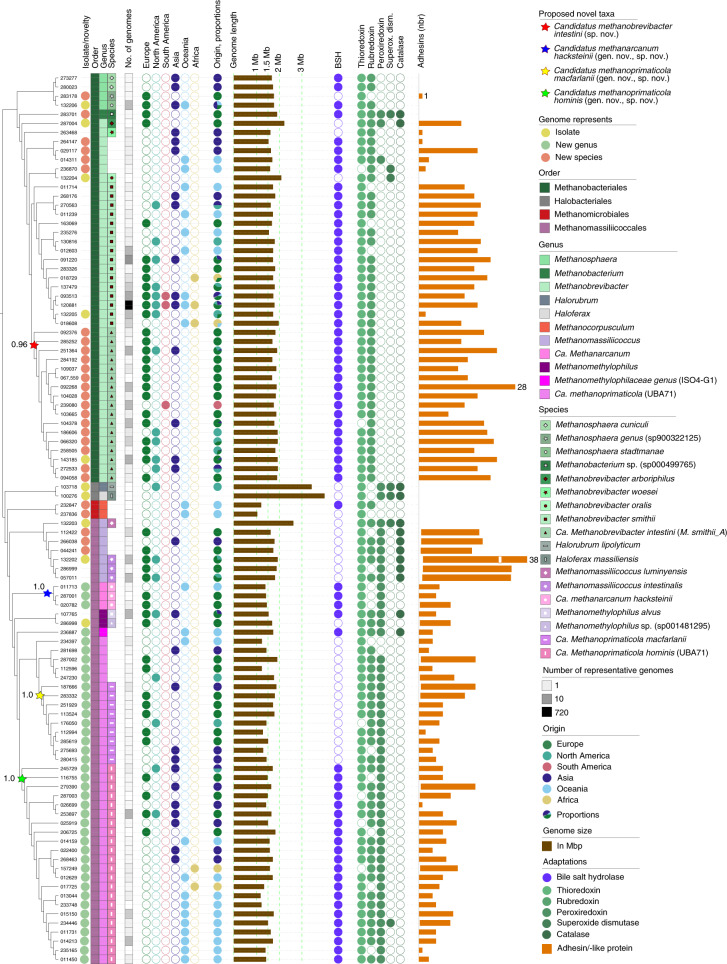
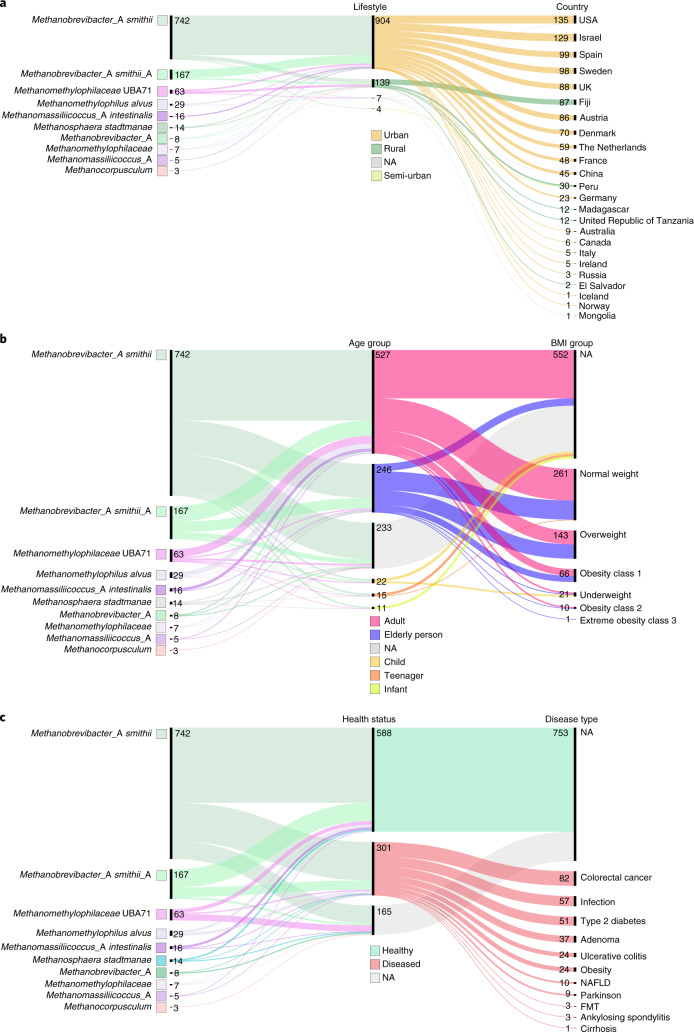
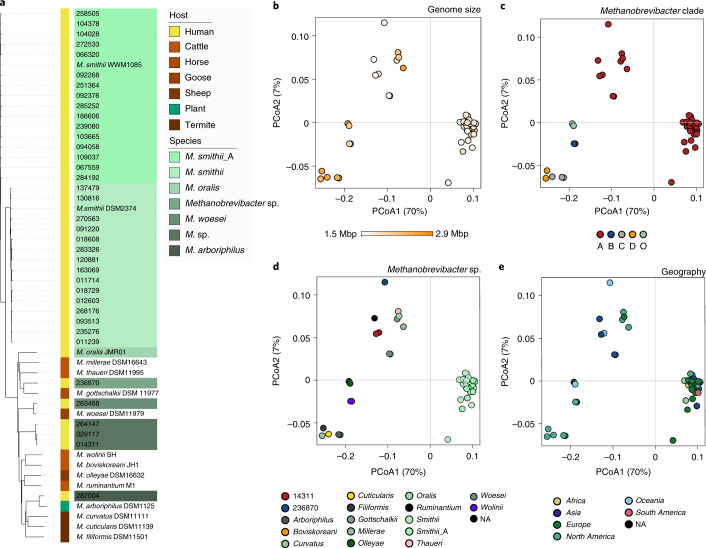
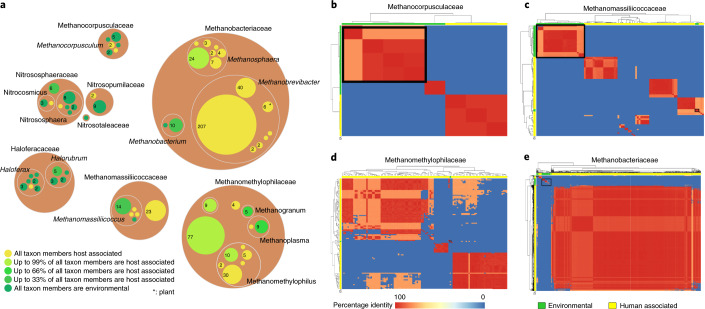
The human gut microbiome plays an important role in health, but its archaeal diversity remains largely unexplored. In the present study, we report the analysis of 1,167 nonredundant archaeal genomes (608 high-quality genomes) recovered from human gastrointestinal tract, sampled across 24 countries and rural and urban populations. We identified previously undescribed taxa including 3 genera, 15 species and 52 strains. Based on distinct genomic features, we justify the split of the Methanobrevibacter smithii clade into two separate species, with one represented by the previously undescribed 'Candidatus Methanobrevibacter intestini'. Patterns derived from 28,581 protein clusters showed significant associations with sociodemographic characteristics such as age groups and lifestyle. We additionally show that archaea are characterized by specific genomic and functional adaptations to the host and carry a complex virome. Our work expands our current understanding of the human archaeome and provides a large genome catalogue for future analyses to decipher its impact on human physiology.


Conflict of interest statement

The authors declare no competing interests.

Figures

Fig. 1
Fig. 1. Archaeal genomes (1,167) from the human GIT reveal taxonomic expansion of the archaeome.
Phylogenetic tree of genomes clustered at 99% similarity (‘strains’), shown with the following characteristics (from left to right): proposed original taxa (indicated by stars on the branch of the phylogenetic tree), including ultrafast bootstrap values. Species representatives are highlighted by bold genome numbers. Isolates, representatives of unknown genera and species are indicated by a coloured dot next to the genome number. Taxonomic affiliation of representative genomes is shown at order, genus and species level. The number of genomes assigned to the strain-level taxon is shown in the grey histogram. The origin displays the origin of the samples from which this genome and its representatives could be assembled. The pie chart displays the proportion of the origins. The respective genome size of the representative genome is displayed in megabases (Mb; brown bars). There is an overview of the absence and presence of genes involved in host interactions: with bile salt hydrolases (blue; BSH) and oxygen resistance genes (green), and the presence of genomes potentially coding for adhesins/adhesin-like/‘Flg_new’ domain proteins (orange). Genomes (strain list) were analysed using MaGe Microscope and genes were counted as present when automatic annotation was positive (‘putative’ annotation was counted as positive).
Fig. 2
Fig. 2. Genome distribution on different metadata categories covering geographic origin, demographics and health aspects.
a,b, Categorical metadata were grouped in three alluvial diagrams referring to geographic origin (a, lifestyle and country) and demographics (b, age and BMI group). Obesity was defined as BMI > 30 kg m−2. Infant: 0–3 years; child: 4–12 years; teenager: 13–18 years; adult: 19–64 years; elderly person: >64 years. c, Health aspects (health status and disease type). NA, no data available. For improved visibility only genomes with a minimum of three representatives according to the GTDB classification are shown. Numbers indicate the amount of genomes in each group (1,054 archaeal genomes in total).
Fig. 3
Fig. 3. Archaeal genomes from the human gut microbiome distribution and the corresponding unified protein catalogue.
a, Unified human archaeal protein catalogue based on protein clustering at 50% sequence identity and 80% coverage using MMseqs2 of all 1,167 archaeal genomes. Heatmap depicts the presence of 3,050 proteins (found in >50 genomes; rows) across the 1,167 archaeal genomes (columns). Heatmap visualization was done using the pheatmap library in R. NA, no data available. b, The taxonomic distinction of Methanomassiliicoccales, Halobacteriales and Methanobacteriales based on the protein profile (a), displayed in a PCoA plot based on Bray–Curtis distances at a depth of 623 archaeal proteins. The PCoA showed five distinct clusters referring to Methanomethylophilaceae, Methanomassiliicoccus, Methanocorpusculum, Methanosphaera and Methanobacteriaceae spp. c, Notably, the clade of Methanobacteriaceae sp. was subdivided into Methanobacterium sp. and a heterogeneous cluster of Methanobrevibacter sp., where Methanobrevibacter smithii and M. smithii_A (later referred to as Ca. M. intestini,), form separate clusters.
Fig. 4
Fig. 4. Characteristics of the Methanobrevibacter genomes.
a, Dendrogram of the Methanobrevibacter clade based on ANI distance. Twelve representative genomes from sources other than humans were included for comparison (further details are given in Supplementary Table 8). Genomes (strain level) from the human GIT are highlighted in green colours (taxon label). M. smithii_A refers to the new species Ca. M. intestini. The bar on the left displays the origin: human (yellow bar), animal (shades of red) and plant (green). be, PCoA plots (Bray–Curtis distance) of protein profiles, according to: genome size (b), Methanobrevibacter clade according to the GTDB (c), assigned species (d) and geographical origin (e). NA, no data available.
Fig. 5
Fig. 5. Comparison of host-associated and environmental relatives.
a, Circle packing plot, displaying the environmental (green) or host-associated (yellow) nature of specific taxa. Analysis was performed on 16S rRNA gene level (Supplementary Table 12). Number of sequences analysed per taxon is indicated by the numbers in the circles and circle size; colours indicate the proportion of host-associated signatures. The largest contribution was observed from M. smithii sequences. Note that the yellow colour (‘host associated’) also includes human, animal and plant (*only M. arboriphilus)-associated taxa. be, ANI heatmap visualization. ANI analysis based on MinHash sequence mapping was performed using fastANI and visualized using the pheatmap library in R. ANI values represented range from 75% to 80% ANI coloured in light orange, 80–90% ANI in darker orange and over >95% ANI in red. Heatmap for genomes assigned to the taxonomic family of Methanocorpusculaceae (b), Methanomassiliicoccaceae (c), Methanomethylophilaceae (d) and Methanobacteriaceae (e). Genomes isolated from the human gut microbiome (labelling on the x and y axes in yellow) can be separated from the genomes isolated from the environment (labelling on the x and y axes in green; Supplementary Table 12). Environmental archaeal genome clustering is marked with a black square.
Fig. 6
Fig. 6. Methanogenic pathways in 23 human gut-associated Methanobacteriales and Methanomassiliicoccales.
The proportion of species with a given protein or protein complex is indicated by pie charts for Methanobrevibacter sp. (n = 7), Methanosphaera sp. (n = 3), Methanomethylophilaceae (n = 8) and Methanomassiliicoccus (n = 5). For clarity, the nature of the electron transporter and some intermediate steps in the electron transfers are not displayed for formate and alcohol utilization. R-CH3 corresponds to methanol, dimethylsulfide, monomethylamine, dimethylamine or TMA. Alcohol could be ethanol or secondary alcohols. The absence of certain enzymes may be due to incompleteness of MAGs. MFR, methanofuran; H4MPT, tetrahydromethanopterin; -CHO, formyl group; -CH, methenyl group; -CH2, methylene group; Fdox/Fdred oxidized/reduced ferredoxin; HS-CoM, coenzyme M; HS-CoB, coenzyme B; CoM-S-S-CoB, heterodisulfide; e-, electrons (without mentioning the transporter).
Extended Data Fig. 1
Extended Data Fig. 1. Methodology.
Flow chart covering the major analysis steps of the study. Colored boxes show the source data (green), main input for the analysis (magenta), downstream analysis (red) and the taxonomic analysis of the presented data set (yellow). Different steps are connected by arrows highlighting a selection of used bioinformatic tools for each step. For details on the genomes, software and databases used, please refer to Supplementary Table 1 and Supplementary Table 14. Figure created with biorender.com.
Extended Data Fig. 2
Extended Data Fig. 2. Overview on the quality of 1,167 genomes summarized in Supplementary Table 1a.
a) Contour plot of genome completeness vs. genome contamination based on CheckM MAGs quality estimates. b) Contour plot of genome length vs. number of contigs. c) Number of predicted tRNAs vs. completeness for each of the 1,167 genomes represented in a scatter plot color coded by taxonomic assignment at the genus level. The size of each data point is relative to genome contamination estimation. Locally Weighted Least Squares Regression (LOESS) method used for smoothing (blue line). d) Growth rate indices (GRiD) of archaeal genomes from the human gut based on 58 GTDB classified genomes. *Candidatus Methanobrevibacter intestini. n = 58 independent genomes, boxplot specifications: colored box de- fines the interquartile range (lower boundry 25th percentile, median 50th percentile and upper boundry 75th percentile), whiskers repre- sent smallest and largest values within 1.5 times of the interquartile range above the 75th percentile and below the 25th percentile re- spectively. Individual dots represent outside values between 1.5 and 3 times of the interquartile range.
Extended Data Fig. 3
Extended Data Fig. 3. Genome dereplication, protein catalogue and protein functionality.
a) Benchmarking different genome clustering thresholds. Number of clusters (that is, strains) identified according to the thresholds used by dRep for ANI and aligned fraction (AF). Vertical line indicates the chosen ANI threshold where the number of clusters begins to stabilize. The 99% ANI threshold was selected to sub-group genomes into a ‘strain’-list. b) Protein catalogue clustering at different percent identities. Line plots representing the number of unique proteins per archaeal family clustering at different percent identities. Drops are observed at 99-95% and 80-50% identity and 80% coverage. c) UpSet plot representing the frequency of COG categories based on the protein catalogue of the unique and shared proteins between the 5 archaeal MAGs taxonomic families (CELLULAR PROCESSES AND SIGNALING: [d] Cell cycle control, cell division, chromosome partitioning, [M] Cell wall/membrane/envelope biogenesis, [N] Cell motility, [O] Post-translational modification, protein turnover, and chaperones, [T] Signal transduction mechanisms, [U] Intracellular trafficking, secretion, and vesicular transport, [V] Defense mechanisms. INFORMATION STORAGE AND PROCESSING: [J] Translation, ribosomal structure and biogenesis, [K] Transcription, [L] Replication, recombination, and repair. METABOLISM: [C] Energy production and conversion, [E] Amino acid transport and metabolism, [F] Nucleotide transport and metabolism, [G] Carbohydrate transport and metabolism, [H] Coenzyme transport and metabolism, [I] Lipid transport and metabolism, [P] Inorganic ion transport and metabolism, [Q] Secondary metabolites biosynthesis, transport, and catabolism. POORLY CHARACTERIZED: [S] Function unknown) – Supplementary Material 1. The numbers in the vertical barplot represent the size of the unique (single dots) and shared proteins (connected dots) between the 5 archaeal taxonomic families while the numbers in the horizontal barplots represent the number of genomes per archaeal family. UpSet plot was done using the library UpSet in R. The 2 pairs of families that shared the higher numbers of protein clusters were Methanomethylophilaceae- Methanomassilliicoccaceae and Methanobacteriaceae- Methanomassilliicoccaceae. Shared protein clusters COG categories are Metabolism, Information, storage and processing, Cellular processes and signaling and have unknown functions. Shared proteins between the different archaeal families d) for all 1167 genomes e) for complete genomes only. Venn diagrams were done by creately (https://app.creately.com).
Extended Data Fig. 4
Extended Data Fig. 4. Predicting metadata values as a function of protein composition by supervised learning methods.
Heatmaps and Receiver Operating Characteristic (ROC) curves of metadata predictions based on the unified archaeal MAG protein catalogue. AUC (area under the curve). Each tested metadata category was downsampled to a minimum of 50 genomes. Continent (a), country (b), age group (c), BMI group (d), health status (e), diseases (f), lifestyle (g).
Extended Data Fig. 5
Extended Data Fig. 5. Predicting metadata values as a function of mapped sequences.
Heatmaps and Receiver Operating Characteristic (ROC) curves of metadata predictions based on mapped reads against the unified archaeal MAG protein catalogue as a reference. AUC (area under the curve). Each tested metadata category was downsampled to a against the unified protein catalogue by supervised learning methods minimum of 50 genomes. Continent (a), country (b), age group (c), BMI group (d), health status (e), diseases (f), lifestyle (g).
Extended Data Fig. 6
Extended Data Fig. 6. Profiles of human- associated Methanosphaera genomes.
For comparison, eleven genomes from animal-associated Methanosphaera were included. PCoA plots (Bray-Curtis distance) of the genomic profiles according to taxonomy (a), geography (b), genome type (c), and host (d) and dendrogram of the genus Methanosphaera with human- and animal-associated representatives (e). Human-associated species are highlighted in green colors. Colored bar displays the origin: human (yellow) and animals (shades of brown). (f): Forest plot showing the outcome of the Wilcoxon rank test comparison of genomes from humans vs. animals (only proteins with FDR < 0.05 are shown), bar displays the odds ratio (OR) (Supplementary Table 7). Arrowheads represent OR that extend beyond the range of the shown X-axis.
Extended Data Fig. 7
Extended Data Fig. 7. Methanobrevibacter smithii Forest plot.
Forest plot showing the outcome of the Wilcoxon rank test comparison of the genomic inventory from M. smithii_A (Cand. M. intestini) vs. M. smithii (only TOP 25 proteins are shown; FDR adjusted P<0.000005); bar displays the odds ratio (OR) (see Supplementary Table 9b).
Extended Data Fig. 8
Extended Data Fig. 8. Number of identified MQ and HQ proviruses and confirmed viral genes.
a) UpSet plot showing the number of viral species color coded by quality (vertical bars, yellow for high-quality; >90% complete, and blue for medium-quality; 50-90% complete), according to the archaeal species where the viral cluster was identified. b) Scatter plot representing prophages length vs. estimated completeness color coded by taxonomic assignment at the genus level of host archaeal genome. The size of each data point is relative to the number of identified viral genes per prophage. Locally Weighted Least Squares Regression (LOESS) method used for smoothing. c) Word cloud of interesting viral genes identified, where the size of each word is relative to its number of occurrences.
Extended Data Fig. 9
Extended Data Fig. 9. Contribution of bacterial-annotated genes in human- (left) and animal- (right) associated Methanobrevibacter and Methanosphaera species: Krona chart proportion in percent indicated by the small circles (the yellow wedge refers to proportion of bacterial annota- tion: human Methanobrevibacter: 2.84%; animal Methanobrevibacter: 6.09%; human Methanosphaera: 2.11%; animal Methanosphaera: 6.74%) and potential bacterial origin (taxa as displayed in the large circles).
Unclassified taxa are whitened out. Only MAGs with 0% contamination and of high quality (taken from ‘strain list’) and genomes from isolates were analyzed (full details are provided in Supplementary Table 11) using eggNOG mapper v2.0.0. Annotated genes were sorted according to their taxonomic affiliation (eggNOG output information: ‘best_tax_level’), and the proportion of archaeal and bacterial genes was calculated.
Extended Data Fig. 10
Extended Data Fig. 10. Functional and metabolic interaction of the archaeome with the gut environment.
a) Archaeal bile salt hydrolase genes (this study) integrated in the bacterial tree of BSHs18. Archaeal genes are highlighted by the colored ring, indicating the respective taxonomic affiliation. b) Geographic distribution of methyl-compound utilization capacity by Methanomasiliicoccales representatives. The presence of mtaBC, mtmBC, mtbBC and mttBC genes needed for methanol, monomethylamine, dimethylamine and, trimethylamine utilization, respectively, as well as pylBCDE genes responsible for the biosynthesis of pyrrolysine (an aminoacid specifically present in methylamine methyltransferases) was searched in all Methanomassiliicoccales. MAGs. Methanomassiliicoccales were separated according to the geographic location (continents) of their host, and the percentage of them having the above mentioned genes is displayed. Average Methanomassiliicoccales MAGs completeness are Africa, 70.1%; Asia, 72.6%; Europe, 79.9%; Oceania, 87.2%.

Comment in

  • The human archaeome in focus.
    Geesink P, Ettema TJG. Geesink P, et al. Nat Microbiol. 2022 Jan;7(1):10-11. doi: 10.1038/s41564-021-01031-6. Nat Microbiol. 2022. PMID: 34969980 No abstract available.

References

    1. Duvallet C, Gibbons SM, Gurry T, Irizarry RA, Alm EJ. Meta-analysis of gut microbiome studies identifies disease-specific and shared responses. Nat. Commun. 2017;8:1784. - PMC - PubMed
    1. Almeida A, et al. A unified catalog of 204,938 reference genomes from the human gut microbiome. Nat. Biotechnol. 2021;39:105–114. - PMC - PubMed
    1. Gregory AC, et al. The gut virome database reveals age-dependent patterns of virome diversity in the human gut. Cell Host Microbe. 2020;28:724–740. - PMC - PubMed
    1. Camarillo-Guerrero LF, Almeida A, Rangel-Pineros G, Finn RD, Lawley TD. Massive expansion of human gut bacteriophage diversity. Cell. 2021;184:1098–1109. - PMC - PubMed
    1. Moissl-Eichinger, C. et al. Archaea are interactive components of complex microbiomes. Trends Microbiol. 26, 70–85 (2018). - PubMed

Publication types