. 2021 Dec 14:15:754585.
doi: 10.3389/fnins.2021.754585. eCollection 2021.

Characterizing the Access of Cholinergic Antagonists to Efferent Synapses in the Inner Ear

Affiliations

Characterizing the Access of Cholinergic Antagonists to Efferent Synapses in the Inner Ear

Choongheon Lee et al. Front Neurosci. .

Abstract

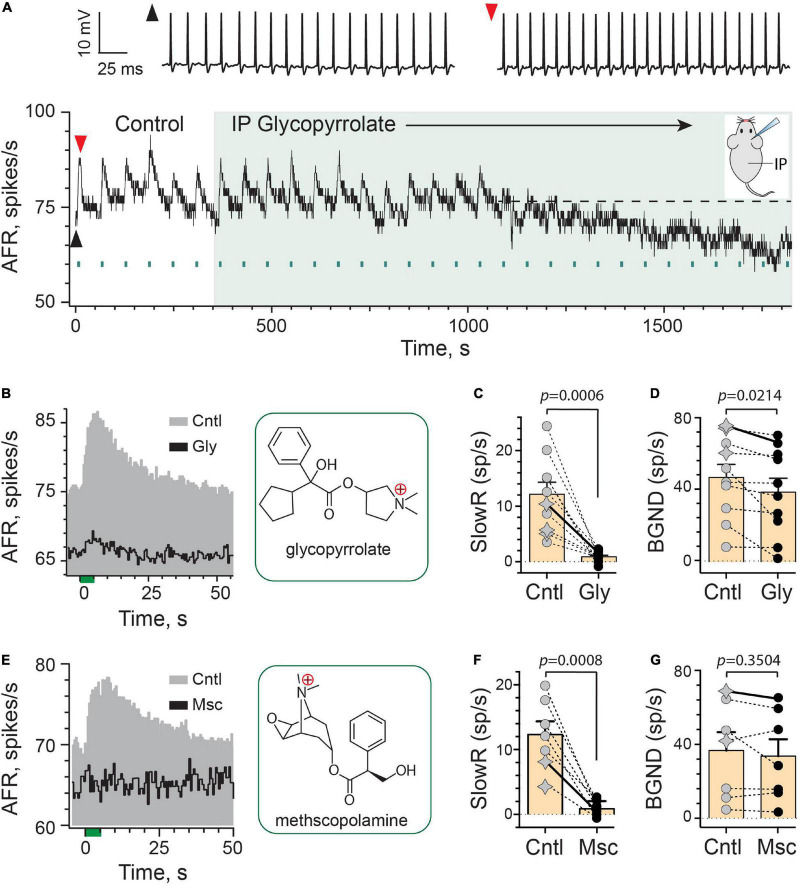
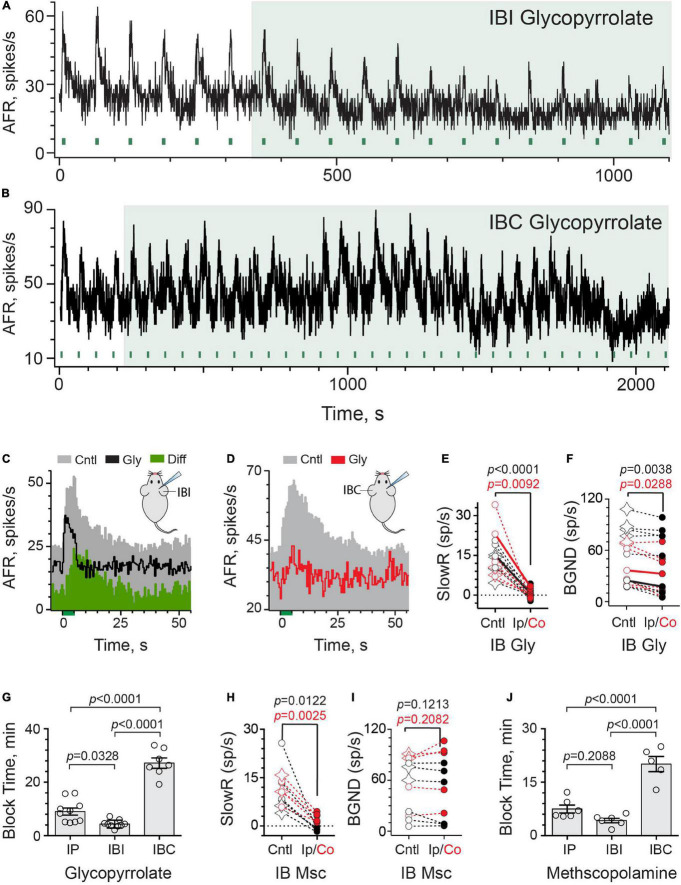
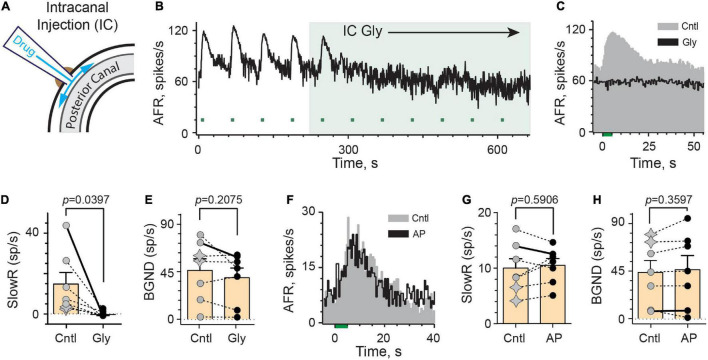
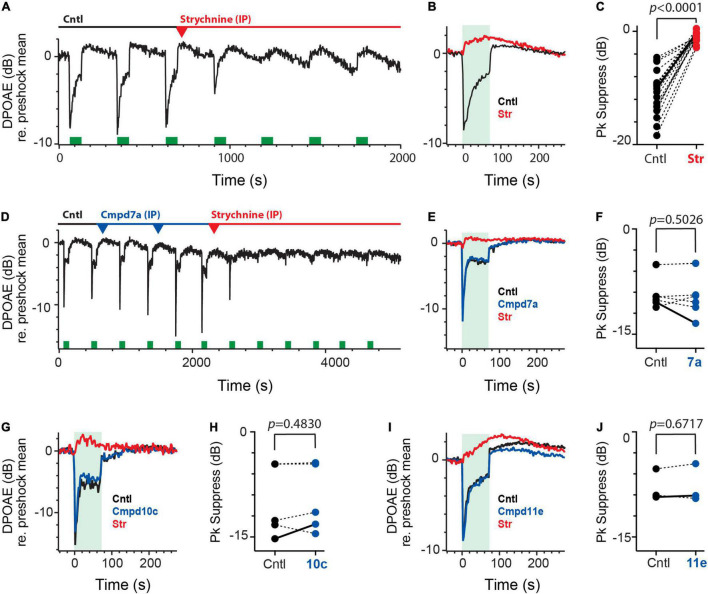
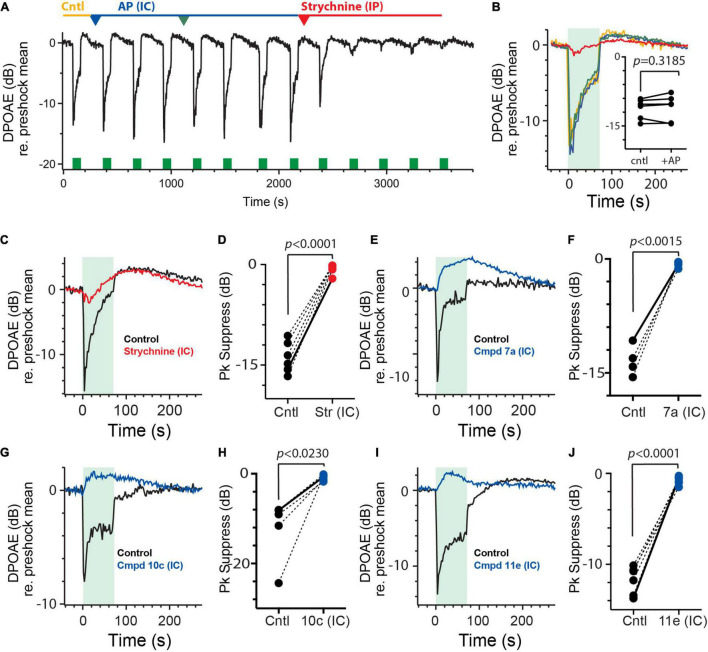
Stimulation of cholinergic efferent neurons innervating the inner ear has profound, well-characterized effects on vestibular and auditory physiology, after activating distinct ACh receptors (AChRs) on afferents and hair cells in peripheral endorgans. Efferent-mediated fast and slow excitation of vestibular afferents are mediated by α4β2*-containing nicotinic AChRs (nAChRs) and muscarinic AChRs (mAChRs), respectively. On the auditory side, efferent-mediated suppression of distortion product otoacoustic emissions (DPOAEs) is mediated by α9α10nAChRs. Previous characterization of these synaptic mechanisms utilized cholinergic drugs, that when systemically administered, also reach the CNS, which may limit their utility in probing efferent function without also considering central effects. Use of peripherally-acting cholinergic drugs with local application strategies may be useful, but this approach has remained relatively unexplored. Using multiple administration routes, we performed a combination of vestibular afferent and DPOAE recordings during efferent stimulation in mouse and turtle to determine whether charged mAChR or α9α10nAChR antagonists, with little CNS entry, can still engage efferent synaptic targets in the inner ear. The charged mAChR antagonists glycopyrrolate and methscopolamine blocked efferent-mediated slow excitation of mouse vestibular afferents following intraperitoneal, middle ear, or direct perilymphatic administration. Both mAChR antagonists were effective when delivered to the middle ear, contralateral to the side of afferent recordings, suggesting they gain vascular access after first entering the perilymphatic compartment. In contrast, charged α9α10nAChR antagonists blocked efferent-mediated suppression of DPOAEs only upon direct perilymphatic application, but failed to reach efferent synapses when systemically administered. These data show that efferent mechanisms are viable targets for further characterizing drug access in the inner ear.

Keywords: DPOAE; auditory efferents; mouse; muscarinic; nicotinic; vestibular efferents.


Conflict of interest statement

The authors declare that the research was conducted in the absence of any commercial or financial relationships that could be construed as a potential conflict of interest.

Figures

FIGURE 1
FIGURE 1
Electrical stimulation of vestibular efferent neurons can elicit three distinct effects on afferent discharge including (A) slow excitation, (B) combined fast and slow excitation, and (C) inhibition. In (A–C), an average response histogram to 7, 6, and 8 efferent shock trains (each 333 shocks/s for 5 s, green column at t = 0–5 s) were constructed for the three different afferents, respectively, from three different animals. Dashed horizontal lines represent the prestimulus baseline afferent firing rate. Binning in all panels is 500 ms.
FIGURE 2
FIGURE 2
Efferent-mediated slow excitation of vestibular afferents is antagonized by peripheral mAChR antagonists. (A) Continuous response histogram from a regular afferent shows changes in afferent firing rate (AFR) during midline efferent stimulation (green bars, 333/s for 5 s every 60 s) before and after administering glycopyrrolate (IP, 2 mg/kg) at t = 360 s (green box). Raw spike data from baseline (black arrowhead) and peak efferent-mediated slow excitation (red arrowhead) are shown above the histogram. Inset: mouse diagram – afferent recording from right ear during IP drug delivery. (B) Corresponding average response histograms from the same afferent in (A) were generated separately for 6 efferent shock trains during control conditions (Cntl) and 10 trials starting at t = 1,150 s during IP glycopyrrolate (Gly). Chemical structure for glycopyrrolate is shown in green box. (C,D) Mean peak slow excitation (SlowR) and background discharge rates (BGND) are plotted for 10 afferents from 10 animals before (Cntl, gray) and after IP glycopyrrolate (Gly, black). Star symbols and filled circles in control column indicate regular and irregular afferents, respectively. Orange bars with error bars reflect the population mean and SEM. Solid line shows values from histograms in (B). Indicated p-values from paired t-test. (E) Average response histograms showing the effects of midline efferent stimulation in an irregular afferent before (Cntl, gray) and after IP administration of 2 mg/kg methscopolamine (Msc, black). Chemical structure for methscopolamine is shown in green box. (F,G) Mean peak slow excitation (SlowR) and background discharge rates (BGND) are plotted for seven afferents from seven animals before (Cntl, gray) and after IP methscopolamine (Msc, black). Orange bars with error bars reflect the population mean and SEM. Solid line shows values from histograms in (E). Indicated p-values from paired t-test. Binning in (A,B,E) is 500 ms.
FIGURE 3
FIGURE 3
Intrabulla application of glycopyrrolate and methscopolamine also blocks efferent-mediated slow excitation in mouse vestibular afferents. (A) Continuous response histogram from an irregular afferent shows changes in afferent firing rate (AFR) during midline efferent stimulation (green bars, 333/s for 5 s every 60 s) before and after the ipsilateral intrabulla delivery of glycopyrrolate (30 μl at 0.5 mM), starting at t = 360 s (green box). (B) Continuous response histogram from an irregular afferent shows changes in afferent firing rate (AFR) during midline efferent stimulation (green bars, 333/s for 5 s every 60 s) before and after the contralateral intrabulla delivery of glycopyrrolate (30 μl at 0.5 mM), starting at t = 220 s (green box). (C) Corresponding average response histograms from the same afferent in (A) were generated separately for 6 efferent shock trains delivered before and after block by ipsilateral IB glycopyrrolate (Gly). The afferent unit displayed both fast and slow excitation and IP glycopyrrolate blocked the slow with no change on the fast. The green difference histogram, had by subtracting the Gly trace from the Cntl trace, reveals the glycopyrrolate-sensitive slow excitation. (D) Corresponding average response histograms from the same afferent in (B) were generated separately for 23 and 5 efferent shock trains, delivered before and after block by contralateral IB glycopyrrolate (Gly), respectively. (E,F) Values of mean peak slow excitation and background rates, respectively, during control (Cntl) and ipsilateral IB (black, Ip) or contralateral IB glycopyrrolate (red, Co). Star symbols and filled circles in control column indicate regular and irregular afferents, respectively. Solid black and red line show values from histograms in (C,D), respectively. Indicated p-values from paired t-test. (G) Times to maximum block for IP, IBI, and IBC glycopyrrolate are compared. Indicated p-values from one-way ANOVA. (H,I) Values of mean peak slow excitation and background rates, respectively, during control (cntl) and ipsilateral IB (black, Ip) or contralateral IB methscopolamine (red, Co). Star symbols and filled circles in control column indicate regular and irregular afferents, respectively. Indicated p-values from paired t-test. (J) Times to maximum block for IP, IBI, and IBC methscopolamine are compared. Indicated p-values from one-way ANOVA. Binning in (A–D) is 500 ms.
FIGURE 4
FIGURE 4
Intracanal application of glycopyrrolate rapidly blocks efferent-mediated slow excitation in mouse vestibular afferents. (A) Our intracanal perilymphatic injection (IC) is made possible by inserting and sealing a small plastic tube within the bony wall of the posterior canal. When connected to a Hamilton syringe, 1–2 μl volumes can be slowly delivered to the perilymph within the posterior canal to then diffuse to the vestibule and cochlea. (B) Continuous response histogram from an irregular afferent shows changes in afferent firing rate (AFR) during midline efferent stimulation (green bars, 333/s for 5 s every 60 s) before and after perilymphatic injection of glycopyrrolate (1 μl at 0.5 mM) through the bony posterior canal wall. Glycopyrrolate was slow injected over 30 s starting at t = 220 s (green box). (C) Corresponding average response histograms from the same afferent in (B) were generated separately for the first four and last five efferent shock trains, delivered before (Cntl) and after IC glycopyrrolate (Gly), respectively. (D,E) Values of mean peak slow excitation (SlowR) and background discharge rates (BGND), respectively, during control (Cntl) and IC glycopyrrolate (Gly). Star symbols and filled circles in control column indicate regular and irregular afferents, respectively. Orange bars with error bars reflect the population mean and SEM. Solid line shows values from histograms in (C). Indicated p-value from paired t-test. (F) Average response histograms for another afferent were generated for efferent shock trains, delivered before (Cntl) and after the IC injection of artificial perilymph (AP). Star symbols and filled circles in control column indicate regular and irregular afferents, respectively. (G,H) Values of mean peak slow excitation (SlowR) and background discharge rates (BGND), respectively, during control (Cntl) and IC artificial perilymph (AP). Orange bars with error bars reflect the population mean and SEM. Solid line shows values from histograms in (F). Indicated p-value from paired t-test. Binning in (B,C,F) is 500 ms.
FIGURE 5
FIGURE 5
Efferent-mediated inhibition of turtle vestibular afferents is antagonized by charged α9α10nAChR blockers. (A) Chemical structures of bis, tris, and tetrakis quaternary ammonium compounds 7a, 10c, and 11e are shown (see also Zheng et al., 2011). (B–D) Average response histograms showing the effects of efferent stimulation in turtle bouton afferents before (Cntl, gray) and during the application of Compound 7a, 10c, or 11e (Black trace), respectively. Efferent-mediated inhibition was recovered after washout (Wash, red trace) with Compounds 7a and 10c. Efferent shock trains (20 shocks at 200/s, green bar at t = 0) were repeated every 3 s and all histograms were based on at least 20 shock train presentations. (E) Mean afferent responses to efferent stimulation (Eff Resp) are plotted for multiple afferents before (Cntl, gray-filled circles) and after the application of Compound 7a, 10c, or 11e (black-filled circles). Negative values indicate inhibition while positive values reveal efferent-mediated excitatory effects. Indicated p-values from comparisons made using a paired t-test. Binning in (B–D) is 50 ms.
FIGURE 6
FIGURE 6
Intraperitoneal administration of charged α9α10nAChR blockers fail to block efferent-mediated suppression of mice DPOAEs. (A) Continuous recording of mouse DPOAEs during midline stimulation of MOC efferent neurons (green bars, 200 shock/s for 70 s), before (Cntl) and after IP administration of strychnine at t = 700 s. (red arrowhead, 6 mg/kg). (B) Mean responses, from (A), showing the effect of midline efferent stimulation (70-s duration @ 200 shocks/s, green box) on DPOAE amplitude before (Cntl, black trace) and after IP administration of strychnine (Str, red). (C) Peak values of efferent-mediated DPOAE suppression (Pk Suppress) are plotted for multiple animals before (Cntl, black) and after the application of strychnine (Str, red). Solid line shows values from mean traces in (B). (D) Continuous recording of mouse DPOAEs during midline stimulation of MOC efferent neurons (green bars, 200 shock/s for 70 s), before (Cntl) and after two IP doses of Cmpd7a (2.5 mg/kg each, blue arrowheads) and subsequent IP strychnine (6 mg/kg, red arrowhead). (E) Mean responses, from (D), showing the effect of midline efferent stimulation (70-s duration @ 200 shocks/s, green box) on DPOAE amplitude before (Cntl, black trace) and after IP delivery of Cmpd7a (blue trace) and then strychnine (red trace). (F,H,J) Peak values of efferent-mediated DPOAE suppression (Pk Suppress) are plotted for multiple animals before (Cntl, black) and after the application of Cmpd7a, 10c, or 11e (blue). Solid line shows values from corresponding traces in (E,G,I). (G,I) Mean responses showing the effect of midline efferent stimulation (70-s duration @ 200 shocks/s, green box) on DPOAE amplitude before (Cntl, black trace) and after IP delivery of Cmpd10c (2.5 mg/Kg, blue trace) or Cmpd11e (2.5 mg/kg, blue trace), respectively. Both are then followed by IP strychnine (6 mg/Kg, red trace). Indicated p-values in (C,F,H,J) were computed using a paired t-test. Binning in (A,B,D,E,G,I) is 2.3 s.
FIGURE 7
FIGURE 7
Intracanal administration of charged α9α10nAChR antagonists blocks efferent-mediated suppression of mice DPOAEs. (A) Continuous recording of mouse DPOAEs during midline stimulation of MOC efferent neurons (green bars, 200 shock/s for 70 s), before (Cntl) and after two IC injections of artificial perilymph (AP, 1–1.5 μl each, blue and green arrowheads) and subsequent IP strychnine (6 mg/Kg, red arrowhead). (B) Mean responses, from (A), showing the effect of midline efferent stimulation (70-s duration @ 200 shocks/s, green box) on DPOAE amplitude before (Cntl, yellow trace) and after two IC injections of artificial perilymph (AP, blue and green traces) and subsequent strychnine (red trace). Inset: peak values of efferent-mediated DPOAE suppression are plotted for multiple animals before (Cntl) and after the IC injection of AP (+AP). Indicated p-values were computed using a paired t-test. (C,E,G,I) Mean responses showing the effect of midline efferent stimulation (70-s duration @ 200 shocks/s, green box) on DPOAE amplitude before (Cntl, black trace) and after IC injection of strychnine (1.5 μl @1.6 mM, red trace), Cmpd7a (1 μl @ 5 mM, blue trace), Cmpd10c (3 μl @ 2.5 mM, blue trace), or Cmpd11e (1.5 μl @ 3 mM, blue trace), respectively. (D,F,H,J) Peak values of efferent-mediated DPOAE suppression (Pk Suppress) are plotted for multiple animals before (Cntl, black) and after IC injection of strychnine, Cmpd7a, Cmpd10c, or Cmpd11e (red or blue trace), respectively. Solid line shows values from corresponding traces in (C,E,G,I). Indicated p-values were computed using a paired t-test. Binning in (A–C,E,G,I) is 2.3 s.

Similar articles

Cited by

References

    1. Bath A. P., Walsh R. M., Bance M. L., Rutka J. A. (1999). Ototoxicity of topical gentamicin preparations. Laryngoscope 109 1088–1093. - PubMed
    1. Boettcher F. A., Bancroft B. R., Salvi R. J. (1990). Concentration of salicylate in serum and perilymph of the chinchilla. Arch. Otolaryngol. Head Neck Surg. 116 681–684. 10.1001/archotol.1990.01870060039005 - DOI - PubMed
    1. Brichta A. M., Goldberg J. M. (2000a). Morphological identification of physiologically characterized afferents innervating the turtle posterior crista. J. Neurophysiol. 83 1202–1223. 10.1152/jn.2000.83.3.1202 - DOI - PubMed
    1. Brichta A. M., Goldberg J. M. (2000b). Responses to efferent activation and excitatory response-intensity relations of turtle posterior-crista afferents. J. Neurophysiol. 83 1224–1242. 10.1152/jn.2000.83.3.1224 - DOI - PubMed
    1. Brulet R., Zhu J., Aktar M., Hsieh J., Cho K. O. (2017). Mice with conditional NeuroD1 knockout display reduced aberrant hippocampal neurogenesis but no change in epileptic seizures. Exp. Neurol. 293 190–198. 10.1016/j.expneurol.2017.04.005 - DOI - PMC - PubMed

LinkOut - more resources