. 2021 Dec 14:12:770524.
doi: 10.3389/fphar.2021.770524. eCollection 2021.

Study on the Molecular Basis of Huanglian Jiedu Decoction Against Atopic Dermatitis Integrating Chemistry, Biochemistry, and Metabolomics Strategies

Affiliations

Study on the Molecular Basis of Huanglian Jiedu Decoction Against Atopic Dermatitis Integrating Chemistry, Biochemistry, and Metabolomics Strategies

Jing Chen et al. Front Pharmacol. .

Abstract

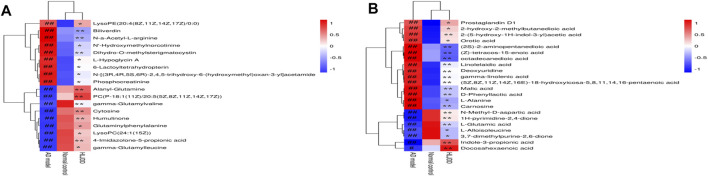
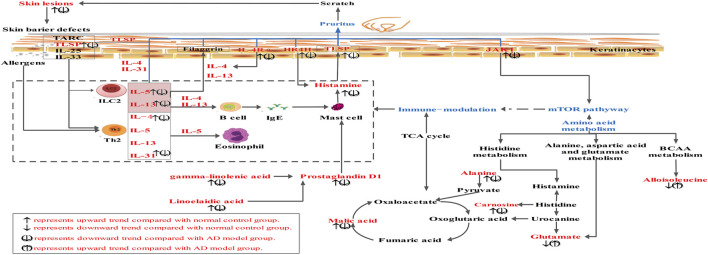
Atopic dermatitis (AD) is a common chronic relapsing skin inflammation, which severely affect the quality of life of patients. Inhibiting itching and enhancing immunity to mitigate scratching are key elements in the fight against AD. Huanglian Jiedu decoction (HLJDD) has multiple pharmacological effects in the treatment of AD. However, the effective ingredients and underlying molecular mechanisms have not yet been fully explored. Thus, this study integrates chemistry, biochemistry, and metabolomics strategies to evaluate the active substance basis of HLJDD against AD. First, HLJDD was split to five fractions (CPF, 40AEF, 90AEF, PEF and WEF) and 72 chemical components were identified. NSD (Non-similarity degree) among the different fractions showed significant chemical differences (>81%). Interleukin IL-13, IL-17A, IL-3, IL-31, IL-33, IL4, IL-5, TSLP, IgE, and histamine in the serum, and IL-4Rα, JAK1, and HRH4 levels in skin, participating in inhibiting itching and regulating immunity signaling, were found to be restored to varying degrees in AD treating with HLJDD and its fractions, especially 40AEF and CPF. Untargeted metabolomics analysis demonstrated that forty metabolites were differential metabolites in plasma between the HLJDD-treated group and the AD group, involving in histidine metabolism, arginine biosynthesis, pyrimidine metabolism, and so on. Further, targeted metabolomics analysis revealed that eleven differential metabolites, associating with physiological and biochemical indices, were significant improved in the HLJDD and its fractions groups. In conclusion, HLJDD exhibited anti-AD effects by inhibiting itching and enhancing immunity, which in turn regulating the levels of relative metabolites, and CPF and 40AEF were considered the most important components of HLJDD.

Keywords: atopic dermatitis (AD); huanglian jiedu decoction; mechanism; metabolomics; molecular basis.


Conflict of interest statement

The authors declare that the research was conducted in the absence of any commercial or financial relationships that could be construed as a potential conflict of interest.

Figures

FIGURE 1
FIGURE 1
The atopic dermatitis animal model and HLJDD and its fractions treatment. (a) normal control group, (b) AD model group, (c) HLJDD group, (d) CPF group, (e) 40AEF group, (f) 90AEF group, (g) WEF group, (h) PEF group. Date was mean ± SEM (n = 8). # p < 0.05, ## p < 0.01 vs. normal group; *p < 0.05, **p < 0.01 vs. AD model group. (A–H) Clinical features of dorsal skin lesions in each group; (I) The score of dorsal skin lesions in each group; (J) The difference in thickness of left and right ears of mice in each group.
FIGURE 2
FIGURE 2
Hematoxylin and eosin (H&E) staining. (A) normal control group, (B) AD model group, (C) HLJDD group, (D) CPF group, (E) 40AEF group, (F) 90AEF group, (G) WEF group, (H) PEF group.
FIGURE 3
FIGURE 3
The atopic dermatitis animal model and HLJDD and its fractions treatment (A–J). (a) normal group, (b) AD model group, (c) WD group, (d) CPF (300 mg/kg) group, (e) 40AEF group, (f) 90AEF group, (g) WEF group, (h) PEF group. Date was mean ± SEM (n = 8). ##p < 0.01 vs. normal group; *p < 0.05, **p < 0.01 vs. AD model group.
FIGURE 4
FIGURE 4
Effects of HLJDD and its fractins on mRNA expression of HRH4 (A), IL-4Rα (B), and JAK1 (C) in the mice. (a) normal control group, (b) AD model group, (c) HLJDD group, (d) CPF group, (e) 40AEF group, (f) 90AEF group, (g) WEF group, (h) PEF group. Date was mean ± SEM (n = 8). # p < 0.05, ## p < 0.01 vs. normal group; *p < 0.05, **p < 0.01 vs. AD model group.
FIGURE 5
FIGURE 5
Effects of HLJDD and its fractions on protein expression of HRH4, IL-4Rα, JAK1, and p-JAK1 in dorsal skin tissues. The protein expression of HRH4, IL-4Rα, JAK1, and p-JAK1 were detected by Western blotting, and quantified by densitometry (E). Relative expressions of HRH4, IL-4Rα, JAK1 and p-JAK1 were normalized to GAPDH internal control (A–D). Data were presented as the means ± SEM, ##p < 0.01 vs. normal group; *p < 0.05, **p < 0.01 vs. AD model group. (a) normal group, (b) AD model group, (c) WD group, (d) CPF group, (e) 40AEF group, (f) 90AEF group, (g) WEF group, (h) PEF group.
FIGURE 6
FIGURE 6
PLS-DA score chart of mice serum samples in positive and negative modes. (A) PLS-DA score plots in positive mode, (B) PLS-DA score plots in negative mode, (C) permutation plots of the PLS-DA models in positive mode, (D) permutation plots of the PLS-DA models in negative mode.
FIGURE 7
FIGURE 7
Hierarchical clustering results of 40 metabolites in ESI+ (A) and ESI− (B) mode. Note: The standard concentration was the abscissa, with the metabolites name regarded as the ordinate. Each of lattice represents a concentration in corresponding sample. The color ranges from blue to red and the shades of color represent different concentration magnitudes. # p < 0.05, ## p < 0.01 vs. normal group; *p < 0.05, **p < 0.01 vs. AD model group.
FIGURE 8
FIGURE 8
Pathway analysis of 40 potential biomarkers with MetPA. 1. Nitrogen metabolism, 2. Biosynthesis of unsaturated fatty acids, 3. Caffeine metabolism, 4. Aminoacyl-tRNA biosynthesis, 5. Butanoate metabolism, 6. Pantothenate and CoA biosynthesis, 7. Selenocompound metabolism, 8. Folate biosynthesis, 9. Glyoxylate and dicarboxylate metabolism, 10. Glutathione metabolism, 11. Glycerophospholipid metabolism, 12. Tryptophan metabolism, 13. Amino sugar and nucleotide sugar metabolism, 14. beta-Alanine metabolism, 15. Porphyrin and chlorophyll metabolism, 16. Arginine and proline metabolism, 17. Arginine biosynthesis, 18. Histidine metabolism, 19. Pyrimidine metabolism, 20. Alanine, aspartate and glutamate metabolism, 21. D-Glutamine and D-glutamate metabolism.
FIGURE 9
FIGURE 9
Standard curves of 14 different metabolites of DL-Malic acid, Glutaric acid, N-Methyl-D-aspartic acid, linolelaidic acid, γ-Linolenic acid, L-Alloisoleucine, L-Carnosine, phosphocreatinine, L-Alanine, 2′-Deoxyuridine, Prostaglandin D1, 1H-pyrimidine-2,4-dione, L-Alanyl-L-Glutamine, and Biliverdine.
FIGURE 10
FIGURE 10
Hierarchical clustering results of 14 metabolites in target metabolomics. Note: The standard concentration was the abscissa, with the metabolites name regarded as the ordinate. Each of lattice represents a concentration in corresponding sample. The color ranges from blue to red and the shades of color represent different concentration magnitudes. # p < 0.05, ## p < 0.01 vs. normal group; *p < 0.05, **p < 0.01 vs. AD model group.
FIGURE 11
FIGURE 11
Classical univariate and multivariate ROC curve analyses. (A), 1H-pyrimidine-2,4-dione (AUC = 1); (B), biliverdine (AUC = 0.828); (C), carnosine (AUC = 0.844); (D), deoxyuridine (AUC = 0.953); (E), DL-malic acid (AUC = 0.953); (F), gamma-linolenic acid (AUC = 1); (G), glutaric acid (AUC = 0.906); (H), L-alanine (AUC = 0.875); (I), L-alanyl-L-glutamine (AUC = 0.906); (J), L-alloisoleucine (AUC = 1); (K), linolelaidic acid (AUC, 0.922); (L), N-methyl-D-aspartic acid (AUC, 1); (M), Phosphocreatine (AUC = 0.891); (N), prostaglandin D1 (AUC = 0.781); (O), multivariate ROC curve analyses.
FIGURE 12
FIGURE 12
The amelioration mechanism of HLJDD and its fractions in AD. Compared with normal control group, “↑” represents upward trend in normal group, “↓” represents downward trend in normal group. Compared with AD model group, “(↑)” represents upward trend in HLJDD group and its fractions groups, “(↓)” represents downward trend in HLJDD group and its fractions groups.

Similar articles

Cited by

References

    1. Abdel-Gawad T. A., El-Hodhod M. A., Ibrahim H. M., Michael Y. W. (2009). Gastroesophageal Reflux in Mechanically Ventilated Pediatric Patients and its Relation to Ventilator-Associated Pneumonia. Crit. Care 13 (Suppl. 1), R164. 10.1186/cc8134 - DOI - PMC - PubMed
    1. Amagai Y., Oida K., Matsuda A., Jung K., Kakutani S., Tanaka T. (2015). Dihomo-γ-linolenic Acid Prevents the Development of Atopic Dermatitis through Prostaglandin D1 Production in NC/Tnd Mice. J. Dermatol. Sci. 79 (1), 30–37. 10.1016/j.jdermsci.2015.03.010 - DOI - PubMed
    1. Blume-Peytavi U., Bagot M., Tennstedt D., Saint Aroman M., Stockfleth E., Zlotogorski A., et al. (2019). Dermatology Today and Tomorrow: from Symptom Control to Targeted Therapy. J. Eur. Acad. Dermatol. Venereol. 33 Suppl, 3–36. 10.1111/jdv.15335 - DOI - PubMed
    1. Bonamonte D., Filoni A., Vestita M., Romita P., Foti C., Angelini G. (2019). The Role of the Environmental Risk Factors in the Pathogenesis and Clinical Outcome of Atopic Dermatitis. Biomed. Res. Int. 2019 (2), 1–11. 10.1155/2019/2450605 - DOI - PMC - PubMed
    1. Cao W., Wang X., Li H., Shi X., Fan W., Zhao S., et al. (2015). Studies on Metabolism of Total Glucosides of Paeony from Paeoniae Radix Alba in Rats by UPLC-Q-TOF-MS/MS. Biomed. Chromatogr. : BMC. 29 (11), 1769–1779. 10.1002/bmc.3493 - DOI - PubMed