. 2021 Dec 14:12:775680.
doi: 10.3389/fphar.2021.775680. eCollection 2021.

Brusatol Inhibits Proliferation and Invasion of Glioblastoma by Down-Regulating the Expression of ECM1

Affiliations

Brusatol Inhibits Proliferation and Invasion of Glioblastoma by Down-Regulating the Expression of ECM1

Zhang'an Dai et al. Front Pharmacol. .

Abstract

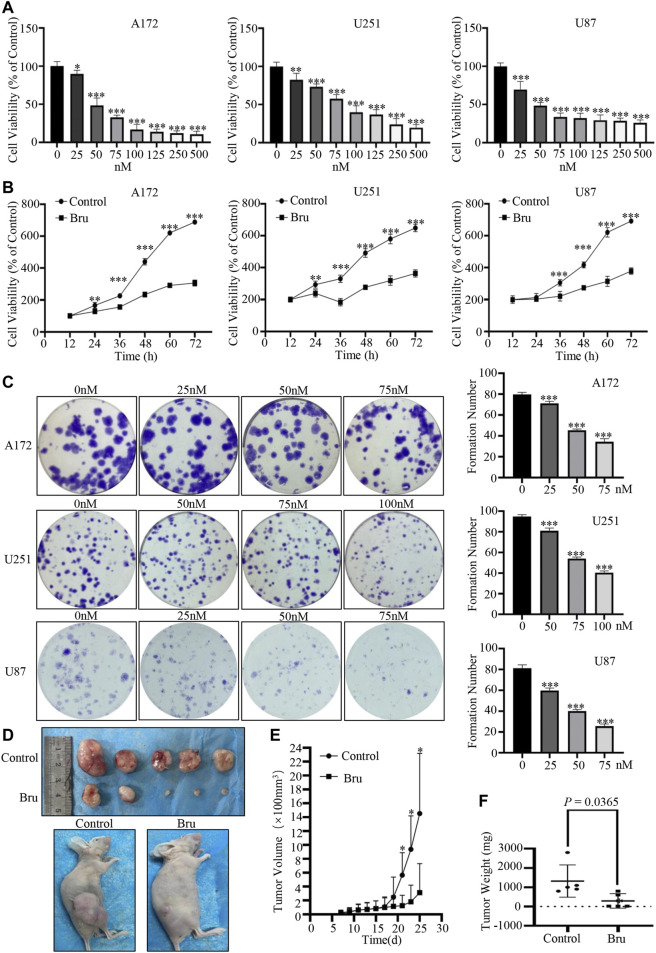
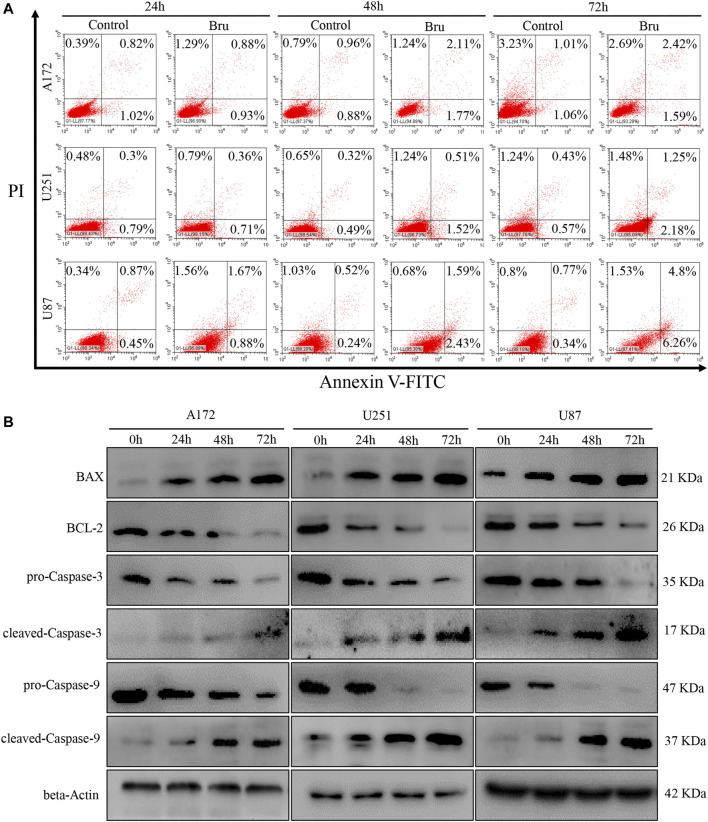
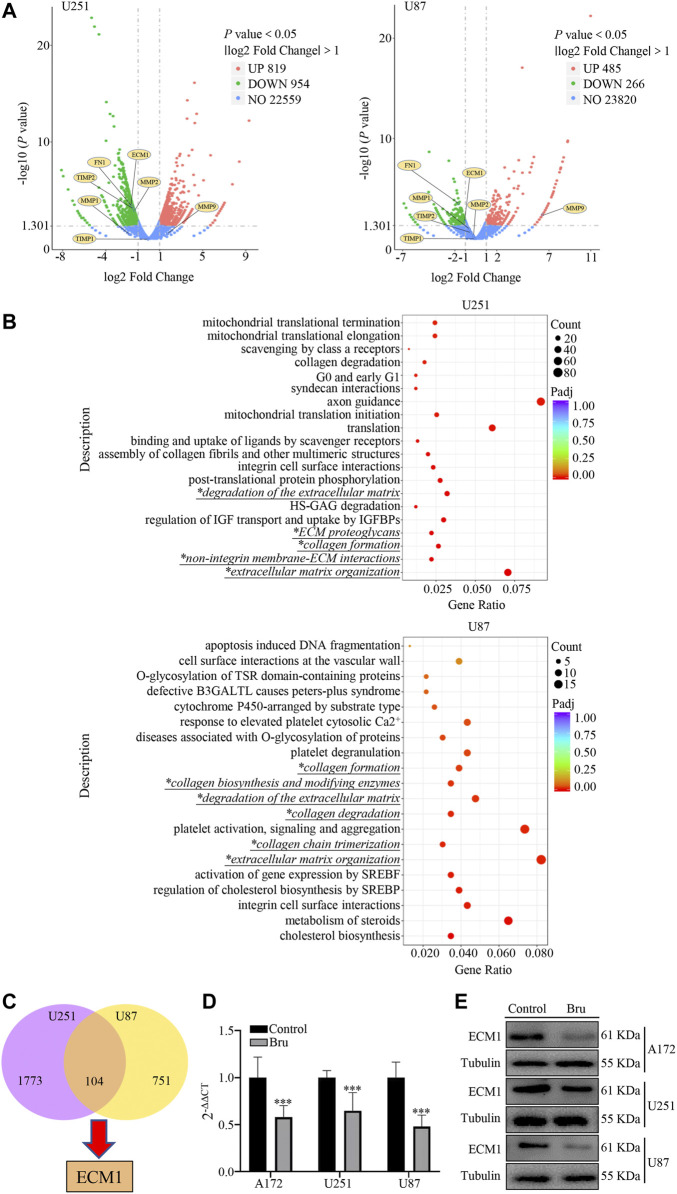
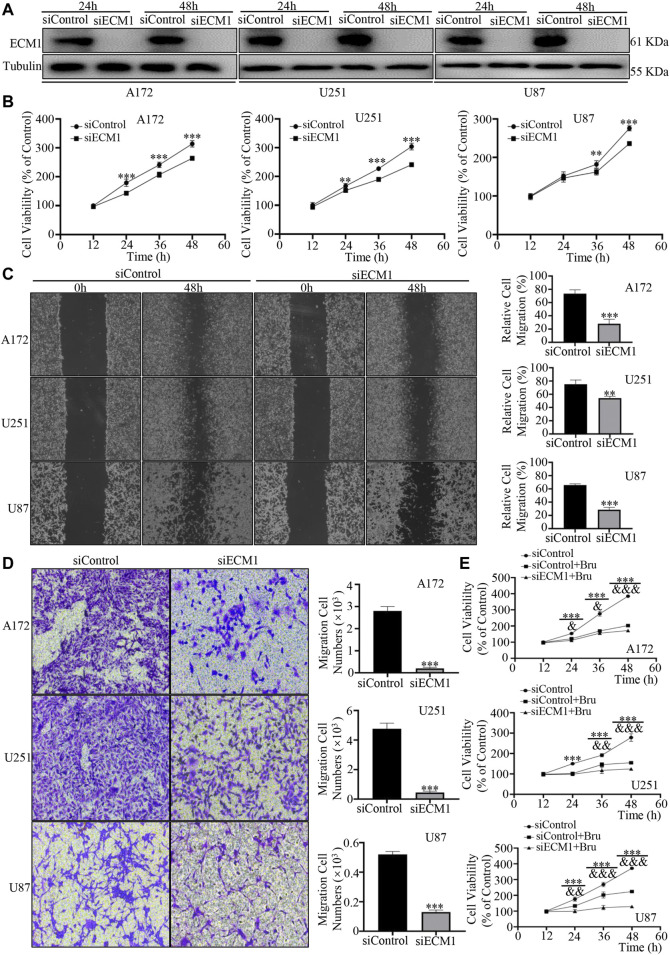
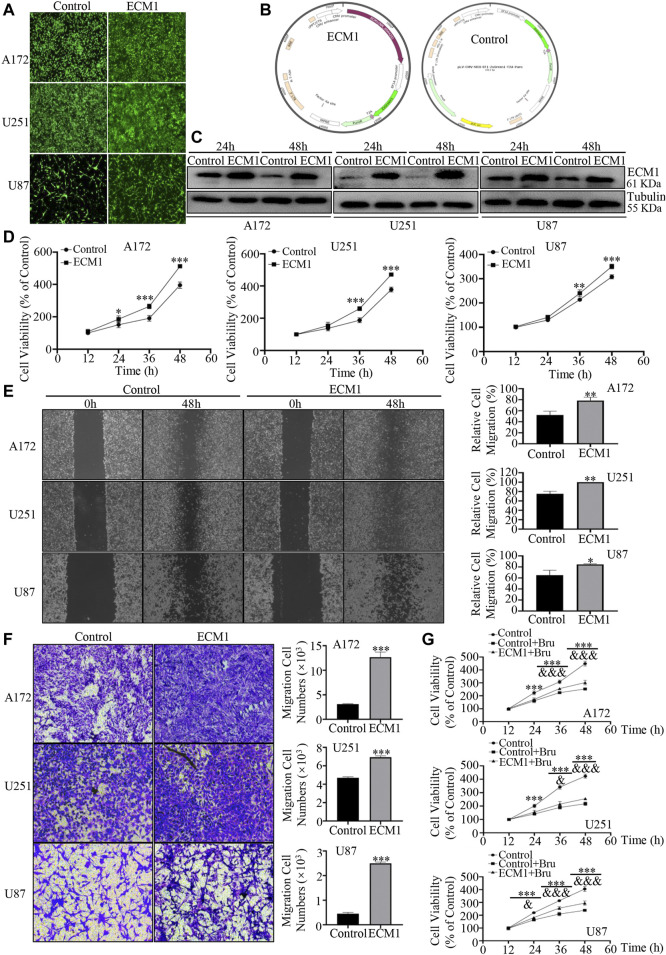
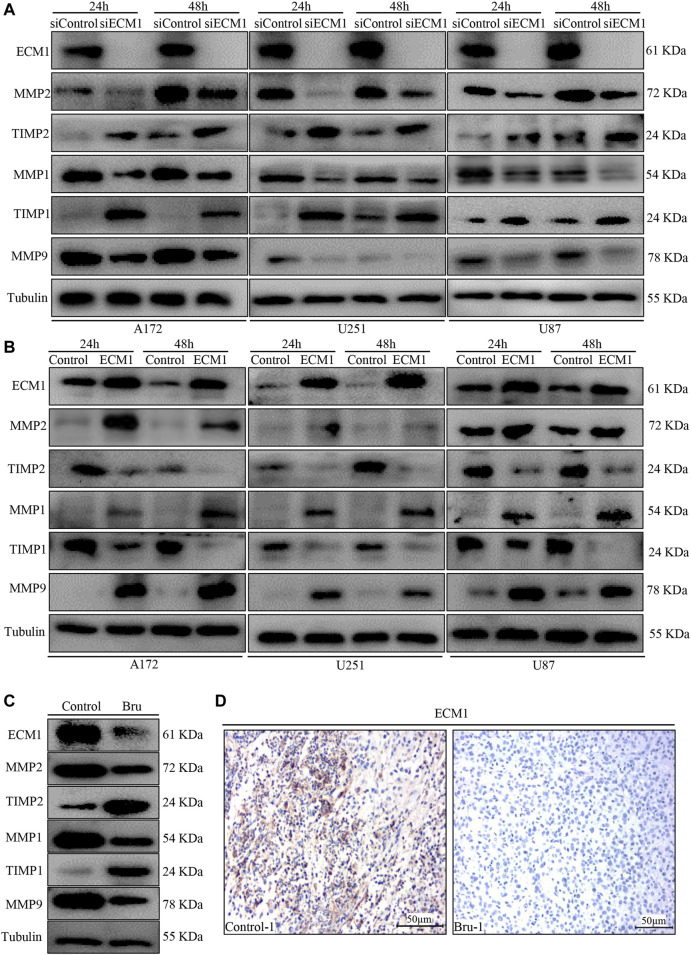
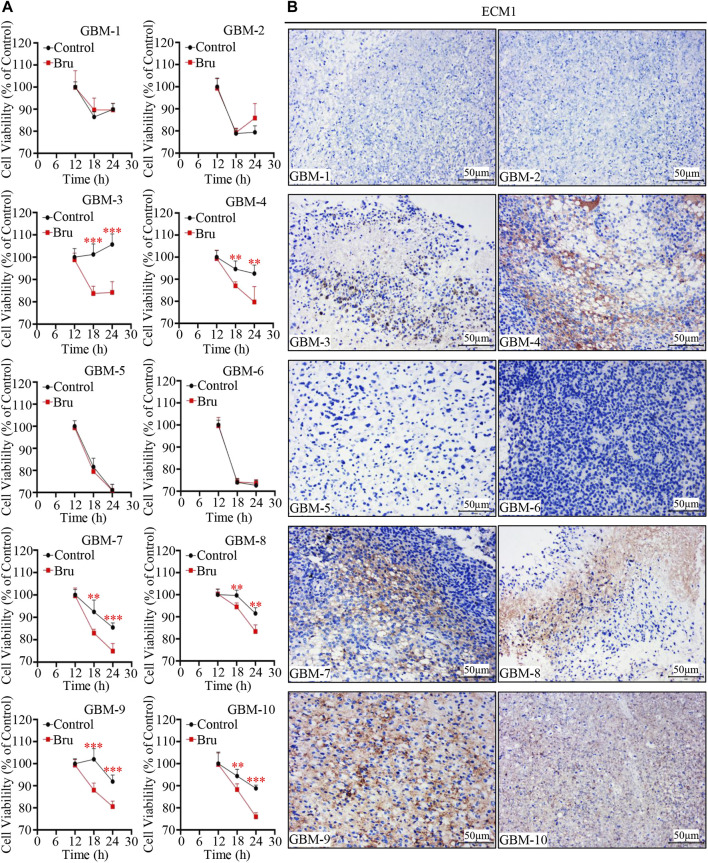
Brusatol (Bru), a Chinese herbal extract, has a variety of anti-tumor effects. However, little is known regarding its role and underlying mechanism in glioblastoma cells. Here, we found that Bru could inhibit the proliferation of glioblastoma cells in vivo and in vitro. Besides, it also had an inhibitory effect on human primary glioblastoma cells. RNA-seq analysis indicated that Bru possibly achieved these effects through inhibiting the expression of extracellular matrix protein 1 (ECM1). Down-regulating the expression of ECM1 via transfecting siRNA could weaken the proliferation and invasion of glioblastoma cells and promote the inhibitory effect of Bru treatment. Lentivirus-mediated overexpression of ECM1 could effectively reverse this weakening effect. Our findings indicated that Bru could inhibit the proliferation and invasion of glioblastoma cells by suppressing the expression of ECM1, and Bru might be a novel effective anticancer drug for glioblastoma cells.

Keywords: brusatol; extracellular matrix protein 1; glioblastoma; invasion; proliferation.


Conflict of interest statement

The authors declare that the research was conducted in the absence of any commercial or financial relationships that could be construed as a potential conflict of interest.

Figures

FIGURE 1
FIGURE 1
Bru inhibited GBM cells proliferation in vivo and in vitro. (A) The proliferation-suppressive effect of Bru was determined by cell viability assay. As Bru concentration increased, the viability of three GBM cell lines A172 cells [ (A), left], U251 cells [ (A), middle], and U87 cells [ (A), right] significantly decreased. (B) The inhibitory effect of Bru on three GBM cell lines increased significantly over time, which was determined by cell viability assay. A172 cells [(B), left, 50 nM], U251 cells [(B), middle, 75 nM], and U87 cells [(B), right, 50 nM] were treated with Bru for 12–72 h and then subjected to cell viability assay. (C) The clone formation assay of three GBM cell lines. Bru treatment resulted in the inhibition of cell colonies. (D) Bru treatment (2 mg/kg, daily by oral gavage) inhibited the growth of subcutaneously transplanted U87 cell tumors in nude mice. Representative images of xenograft tumors from nude mice were shown in Panel (D). (E) Assessment of the tumor growth curves in nude mice after Bru treatment. (F) The weight of xenograft tumors from nude mice were shown in Panel (F). *p < 0.05, **p < 0.01, ***p < 0.001 vs, 0 nM group or Control group.
FIGURE 2
FIGURE 2
Bru induced apoptotic cell death of glioblastoma cells. (A) The cell apoptosis of A172 cells, U251 cells, and U87 increased obviously after treatment with Bru by flow cytometry analysis. The results revealed that Bru indeed rendered A172 cells, U251 cells, and U87 to undergo apoptosis. (B) A172, U251, and U87 cells were treated with Bru as indicated, and apoptosis-associated proteins were analyzed by Western blot using antibodies against Bax, Bcl-2, pro-Caspase-3, cleaved-Caspase-3, pro-Caspase-9, and cleaved-Caspase-9. Beta-Actin was used to control the consistency of protein loading.
FIGURE 3
FIGURE 3
The expression of ECM1 was involved in Bru-treated GBM cells. (A) The volcano plots of RNAs in U251 and U87 cells. The Log2 absciss presented the differences existing in Control and Bru-treated group. The vertical axis showed the p value, which represented the significance of the difference. The expression of ECM1 and other related genes were shown as volcano plots to indicate the location of these genes. (B) Reactome enrichment analysis of the gene expression profiles in U251 and U87 cells. 20 pathways were shown to be significantly regulated in Control and Bru-treated group. Italic Script with * represented collagen and extracellular matrix related pathways. (C) Venn diagram analysis of the gene expression profiles in U251 and U87 cells. There were 104 genes co-expressed in these two GBM cell lines. (D, E) The cells were treated with Bru for 48 h and then subjected to qRT-PCR analysis and western blot assay to verify the expression of ECM1. *p < 0.05, **p < 0.01, ***p < 0.001 vs., Control group.
FIGURE 4
FIGURE 4
ECM1 silencing inhibited proliferation, migration and invasion of GBM cells. (A) The effect of ECM1 knockdown via siRNA silencing. Western blot analysis was used to measure the expression level of ECM1 in GBM cell lines transfected with siRNA for 24–48 h. (B) ECM1 knockdown via siRNA silencing inhibited the proliferation of A172 (left), U251 (middle), and U87 (right) cells. The cells were transfected with siControl or siECM1 for 12–60 h and then subjected to cell viability assay by CCK-8. (C) ECM1 knockdown suppressed the migration abilities of GBM cells. As described, the cells were subjected to cell migration assay by wound healing assay. The representative images for GBM cells were shown in Panel (C) (left), and data from three independent experiments were showed in the histogram (right). (D) ECM1 knockdown suppressed the invasive abilities of GBM cells. The cells were transfected with siControl or siECM1 for 48 h and then subjected to cell invasion assay. The representative images for GBM cell lines were shown in Panel (D) (left), and data from three independent experiments were shown in the histogram (right). (E) GBM cell lines were transfected with siECM1 for 24h, subsequently treated with Bru for 48–96h, and then subjected to cell proliferation assay by CCK-8. *p < 0.05, **p < 0.01, ***p < 0.001 vs., siControl group. & p < 0.05, && p < 0.01, &&& p < 0.001 vs., siControl + Bru group.
FIGURE 5
FIGURE 5
Overexpression of ECM1 promoted proliferation, migration and invasion of GBM cells. (A) After transfecting with lentivirus for 96h, the transfection efficiency of lentivirus in GBM cells was observed. (B) The structures of the plasmid overexpressing ECM1 (pLV-CMV-ECM1-EF1-ZsGreen1-T2A-Puro) and the Control plasmid (pLV-CMV-MCS-EF1-ZsGreen1-T2A-Puro) were shown in Panel (B). (C) Western blot analysis was used to detect the expression level of ECM1 in GBM cells transfected with pLV-vector (Control) or pLV-ECM1 (ECM1). (D) Overexpression of ECM1 promoted the proliferation of A172 (left), U251 (middle), and U87 (right) cells. The cells were transfected with pLV-vector (Control) or pLV-ECM1 (ECM1) for 12–60h, and cell viability was determined by CCK-8. (E) Overexpression of ECM1 promoted the migration abilities of GBM cells. The wound-healing assay was used to detect the migration abilities of GBM cells. The images of GBM cell migration were shown in Panel (E) (left), and data from three independent experiments were shown in the histogram (right). (F) Overexpression of ECM1 was sufficient for the invasive abilities of GBM cells. The cells were transfected with lentivirus for 48 h and subjected to cell invasion assay. The images of GBM cell invasion were shown in Panel (F) (left), and data from three independent experiments were shown in the histogram (right). (G) GBM cell lines were infected with pLV-ECM1 for 24 h, treated with Bru for 48–96 h, and then subjected to cell proliferation assay by CCK-8. *p < 0.05, **p < 0.01, ***p < 0.001 vs., Control group. & p < 0.05, && p < 0.01, &&& p < 0.001 vs, Control + Bru group.
FIGURE 6
FIGURE 6
The effect of ECM1 on invasion-related biomarkers. (A) Cells were transfected with siControl or siECM1 for 24–48 h and subjected to immunoblot analysis for measuring the expression of indicated proteins. (B) Cells were infected with pLV-vector (Control) or pLV-ECM1 (ECM1) for 24–48 h and then subjected to immunoblot analysis for measuring the expression of indicated proteins. (C) Immunoblot analyses showing ECM1, MMP2, TIMP2, MMP1, TIMP1 and MMP9 expression levels in xenograft tumors. The blots shown here were representatives of the average of five subcutaneously transplanted tumors in nude mice. (D) Representative images of IHC staining showed that Bru decreased the levels of ECM1 in subcutaneously transplanted xenograft tumors ().
FIGURE 7
FIGURE 7
Cytotoxic effect of Bru on human primary GBM cells. (A) 10 human primary GBM cell samples were treated with 50 nM Bru. Cell viability was measured at the indicated time points by CCK-8 assay. Bru decreased viable cells significantly in six of 10 human primary GBM cell samples. (B) Representative images of IHC staining showed that ECM1 expression was high in the majority of Bru-treated sensitive human primary GBM cell samples. *p < 0.05, **p < 0.01, ***p < 0.001 vs, Control group.

Similar articles

Cited by

References

    1. Abdel Salam R., El-Badry N., Rizk A., El-Sedfy A., Kamel N., El-Abd E. (2015). Expression of ECM1 and MMP-2 in Follicular Thyroid Lesions Among Egyptians. Cancer Biomark 15, 441–458. 10.3233/cbm-150481 - DOI - PubMed
    1. Bovilla V. R., Kuruburu M. G., Bettada V. G., Krishnamurthy J., Sukocheva O. A., Thimmulappa R. K., et al. (2021). Targeted Inhibition of Anti-inflammatory Regulator Nrf2 Results in Breast Cancer Retardation In Vitro and In Vivo . Biomedicines 9, 1119. 10.3390/biomedicines9091119 - DOI - PMC - PubMed
    1. Cai S. J., Liu Y., Han S., Yang C. (2019). Brusatol, an NRF2 Inhibitor for Future Cancer Therapeutic. Cell Biosci. 9, 45. 10.1186/s13578-019-0309-8 - DOI - PMC - PubMed
    1. Chen H., Jia W.-D., Li J.-S., Wang W., Xu G.-L., Ma J.-L., et al. (2011). Extracellular Matrix Protein 1, a Novel Prognostic Factor, Is Associated with Metastatic Potential of Hepatocellular Carcinoma. Med. Oncol. 28, 318–325. 10.1007/s12032-010-9763-1 - DOI - PubMed
    1. Chen H. M., Lai Z. Q., Liao H. J., Xie J. H., Xian Y. F., Chen Y. L., et al. (2018). Synergistic Antitumor Effect of Brusatol Combined with Cisplatin on Colorectal Cancer Cells. Int. J. Mol. Med. 41, 1447–1454. 10.3892/ijmm.2018.3372 - DOI - PMC - PubMed