. 2021 Dec 14:12:783798.
doi: 10.3389/fimmu.2021.783798. eCollection 2021.

Galactose-Binding C-Type Lectin Promotes Cellular Aggregation of Coelomocytes in Sea Cucumber

Affiliations

Galactose-Binding C-Type Lectin Promotes Cellular Aggregation of Coelomocytes in Sea Cucumber

Mizuki Taguchi et al. Front Immunol. .

Abstract

Echinoderms have a large coelomic cavity containing coelomocytes. When the coelomic fluid is removed from the cavity, the cells aggregate immediately. We found that a fraction or an extract of the intestine of the sea cucumber, Apostichopus japonicus, markedly accelerated cellular movement and aggregation on a glass slide, and this effect was clearly inhibited by galactose. We successfully purified the aggregation-promoting factor, a 16 kDa protein, from the intestine. TOF-MS analysis followed by de novo sequencing revealed that the protein is a C-type lectin. RNA-seq data and cDNA cloning demonstrated the factor to be a novel lectin, named AjGBCL, consisting of 158 aa residues in the mature form. Microscopic observation revealed that most of the aggregating cells moved toward aggregates and not to an intestinal fragment, suggesting that AjGBCL is not a chemoattractant but a cellular aggregation-inducing factor that may induce aggregates to release chemoattractant. We report, for the first time, an endogenous molecule that promotes coelomocyte aggregation in echinoderms.

Keywords: cell migration; cellular aggregation; coelomocytes; lectin; sea cucumber.


Conflict of interest statement

The authors declare that the research was conducted in the absence of any commercial or financial relationships that could be construed as a potential conflict of interest.

Figures

Figure 1
Figure 1
Fluorescence microscopy of the cleavage site of the intestine. Images taken 3 h after autotransplantation of labeled coelomocytes to the eviscerated animal. Left panel: Differential interference contrast. Right panel: Image showing the fluorescence. Full line: Serosa. Dotted line: Cleavage site. →: cellular aggregates. Scale bars = 200 μm.
Figure 2
Figure 2
Time-lapse observation of the movement of cells toward a piece of intestine. Images were acquired every 15 min. Magenta line: A piece of intestine. Arrow: Cells moved toward the growing aggregates. Arrowhead: Cells moved toward the piece of intestine. Scale bars = 200 µm.
Figure 3
Figure 3
Microscopic observation of cellular aggregates with (Int+) or without (Int-) an intestinal piece on a glass slide. (A) Aggregates formed in the presence and absence of the intestine at 30 min. Scale bars = 100 μm. (B) Comparison of the total area of cell aggregates. *P < 0.05 (mean ± SD, n = 5).
Figure 4
Figure 4
Aggregation-promoting activity of the tissue extracts. Total area of the aggregates, 30 min after the addition of the extracts to the coelomic fluid. P < 0.05 (mean ± SD, n = 5). Different letters show significant differences.
Figure 5
Figure 5
Aggregation-promoting activity of the treated extracts of the intestine. (A) untreated extract. (B) heat-treated extract. (C, D) >5 kDa and <5 kDa fractions of the extract separated by ultrafiltration. (E) control (coelomic fluid only). Scale bars = 200 μm.
Figure 6
Figure 6
Purification of the aggregation-promoting factor from the crude protein fraction of the intestinal extract. (A) Chromatogram after anion-exchange chromatography on a POROS HQ/20 column. The fraction with the activity is shaded. (B) Chromatogram after gel-filtration chromatography on a Superdex 200 column. The shaded fraction in Figure 4A was applied. A fraction with the activity is shaded. (C) SDS-PAGE of the shaded fraction in Figure 4B . A 15% polyacrylamide gel was used and was visualized by staining with coomassie brilliant blue. M, marker.
Figure 7
Figure 7
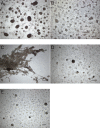
Inhibitory effect of galactose on cellular aggregation. Microscopic observation. Coelomic fluid was supplemented with (A) the intestinal extract, (B) PBS, or (C–M) the intestinal extract premixed with 0.1 M sugar solution (in PBS). (C) D (+)-glucose. (D) D (+)-mannose. (E) D (+)-galactose. (F) D (+)-xylose. (G) L (−)-fucose. (H) L (+)-rhamnose. (I) N-acetyl-D-glucosamine. (J) N-acetyl-D-galactosamine. (K) D (+)-maltose. (L) D (+)-lactose. (M) D (+)-sucrose. Scale bars = 200 μm.
Figure 8
Figure 8
Purification of the aggregation-promoting factor from the intestinal extract by galactose-affinity chromatography. (A) SDS-PAGE. Lanes: 1, molecular mass maker; 2, Intestinal extract; 3, non-adsorbed; 4, rinse-off; 5, galactose-binding protein. (B) Aggregation-promoting effects of each fraction. The numbers on the panels correspond to the number of the lanes in Figure 7A .Microscopic observation. Scale bars = 200 μm.
Figure 9
Figure 9
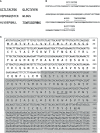
Identification of the aggregation-promoting factor. (A) Peptide sequences obtained by de novo sequencing of the 16 kDa protein purified by anion-exchange and gel-filtration chromatography ( Figure 5C ). The sequences obtained by de novo sequencing of the protein purified by galactose-affinity chromatography ( Figure 7A ), as well, are underlined. (B) A sequence found in RNA-seq data that is highly identical to the peptide sequences. (C) cDNA sequence and deduced amino acid sequence of AjGBCL. The sequence obtained by RNA-seq is boxed. The sequence of partial and 3′-RACE amplified cDNA confirmed by sequencing in shaded. An EPN motif is double underlined.
Figure 10
Figure 10
Reverse transcription-PCR analysis of AjGBCL expression in different tissues. β-actin was used as a loading control. M, marker; BW, body wall; TE, tentacles; PV, Polian vesicle; IN, intestine; RT, respiratory tree; CC, coelomocytes; NC, negative control (without the reverse transcription of RNA).
Figure 11
Figure 11
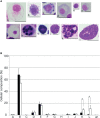
Cellular composition of the aggregates. (A) The coelomocytes of A. japonicus classified based on MG staining. a to l indicate Type-A to Type-L, respectively.  Un, unidentified. Scale bars are 5 (e and f) or 10 mm (a, b, c, d, g, h, i, j, k, and l). (B) Comparison of cellular composition of aggregates formed in the presence or absence of the intestinal extract. opened bar; absence, closed bar; intestinal extract. *P < 0.05 (mean ± SD, n = 5).

References

    1. Holland LZ, Giese AC, Phillips JH. Studies on the Perivisceral Coelomic Fluid Protein Concentration During Seasonal and Nutritional Changes in the Purple Sea Urchin. Comp Biochem Physiol (1967) 21:361–71. doi: 10.1016/0010-406X(67)90798-0 - DOI - PubMed
    1. Ramirez-Gomez FJ, Garcia-Arraras JE. Echinoderm Immunity. ISJ Invertebr Surviv J (2010) 7:211–20.
    1. D’Andrea-Winslow L, Radke DW, Utecht T, Kaneko T, Akasaka K. Sea Urchin Coelomocyte Arylsulfatase: A Modulator of the Echinoderm Clotting Pathway. Integr Zool (2012) 7:61–73. doi: 10.1111/j.1749-4877.2011.00279.x - DOI - PubMed
    1. Johnson PT. The Coelomic Elements of Sea Urchins (Stongylocentrotus) III. In Vitro Reaction to Bacteria. J Invertebr Pathol (1969) 13:42–62. doi: 10.1016/0022-2011(69)90237-7 - DOI - PubMed
    1. Arizza V, Giaramita FT, Parrinello D, Cammarata M, Parrinello N. Cell Cooperation in Coelomocyte Cytotoxic Activity of Paracentrotus lividus Coelomocytes. Comp Biochem Physiol (2007) 147A:389–94. doi: 10.1016/j.cbpa.2007.01.022 - DOI - PubMed

LinkOut - more resources