. 2021 Dec 14:9:796960.
doi: 10.3389/fcell.2021.796960. eCollection 2021.

Differentiation of Human iPS Cells Into Sensory Neurons Exhibits Developmental Stage-Specific Cryopreservation Challenges

Affiliations

Differentiation of Human iPS Cells Into Sensory Neurons Exhibits Developmental Stage-Specific Cryopreservation Challenges

Rui Li et al. Front Cell Dev Biol. .

Abstract

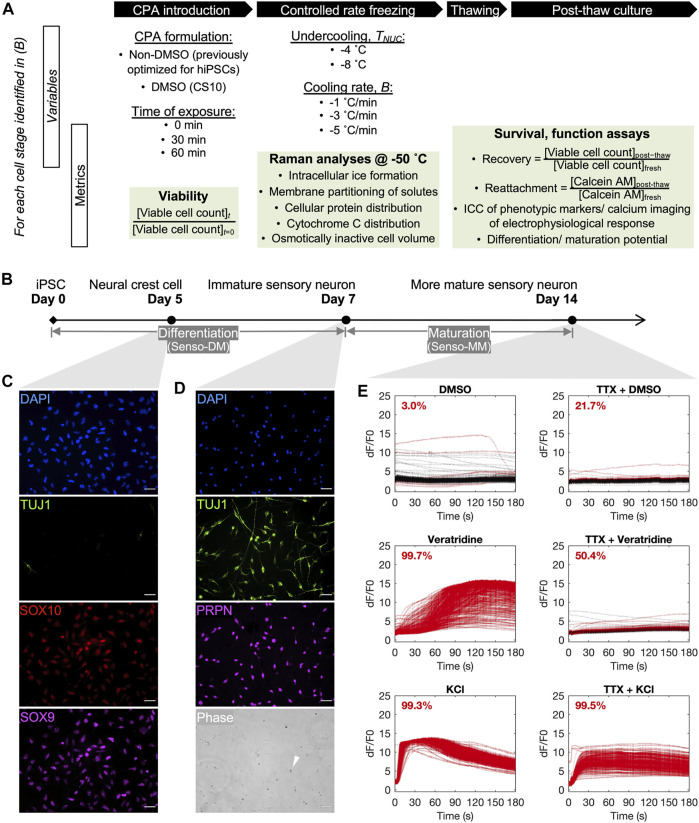
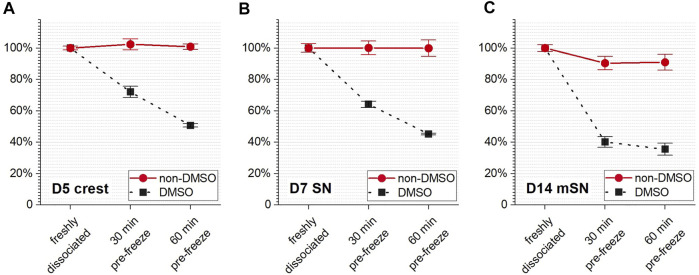
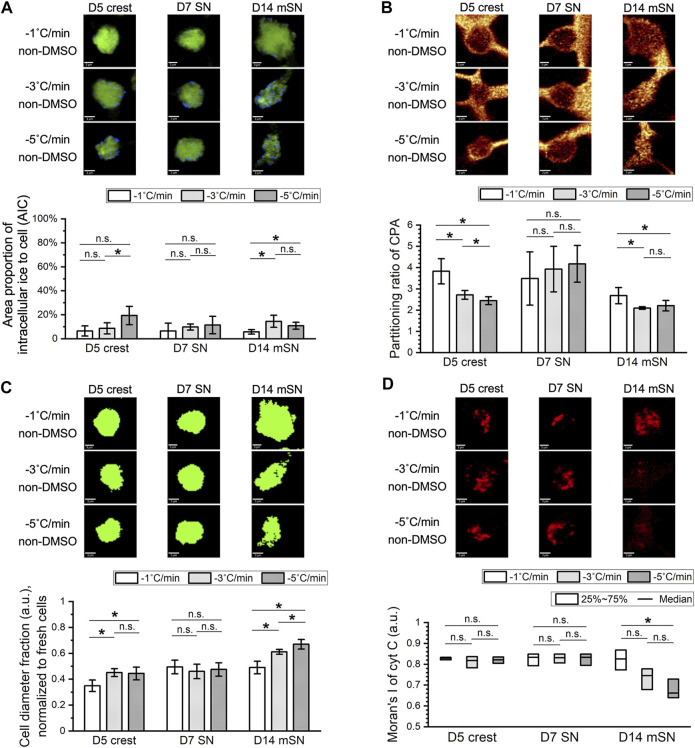
Differentiation of human induced pluripotent stem cells (hiPSCs) generates cell phenotypes valuable for cell therapy and personalized medicine. Successful translation of these hiPSC-derived therapeutic products will rely upon effective cryopreservation at multiple stages of the manufacturing cycle. From the perspective of cryobiology, we attempted to understand how the challenge of cryopreservation evolves between cell phenotypes along an hiPSC-to-sensory neuron differentiation trajectory. Cells were cultivated at three different stages to represent intermediate, differentiated, and matured cell products. All cell stages remained ≥90% viable in a dimethyl sulfoxide (DMSO)-free formulation but suffered ≥50% loss in DMSO before freezing. Raman spectroscopy revealed higher sensitivity to undercooling in hiPSC-derived neuronal cells with lower membrane fluidity and higher sensitivity to suboptimal cooling rates in stem cell developmental stages with larger cell bodies. Highly viable and functional sensory neurons were obtained following DMSO-free cryopreservation. Our study also demonstrated that dissociating adherent cultures plays an important role in the ability of cells to survive and function after cryopreservation.

Keywords: Raman spectroscopy; controlled rate freezing; cryobiology; cryoprotective agents; differentiation; induced pluripotent stem cell; sensory neurons.


Conflict of interest statement

AH has an issued patent # 10314302, and authors RL and AH have an international patent application # PCT/US2020/029847 related to this work and owned by Regents of the University of Minnesota. The remaining authors declare that the research was conducted in the absence of any commercial or financial relationships that could be construed as a potential conflict of interest.

Figures

FIGURE 1
FIGURE 1
Overview of the cryobiological investigation along a human induced pluripotent stem cell (hiPSC)-to-sensory neuron trajectory. (A) Outline of variables and metrics for the analysis, per neuronal cell stage, of cryoprotective agent (CPA) cytotoxicity before freezing, cell response to variation in nucleation temperature (T NUC ) and cooling ratio (B) during freezing, and cell survival and function after thawing. (B) A 14-day differentiation and maturation timeline for cultivating the three developmental stages of neuronal cells of interest for this investigation. (C) Immunocytochemistry of day-5 neural crest cells (D5 crest) replated at 100,000 cells/cm2, 98.4% TUJ1− SOX9 + SOX10 +. Scale bar: 50 µm. (D) Phase contrast and immunocytochemistry of day-7 sensory neurons (D7 SN) replated at 50,000 cells/cm2, 98.8% TUJ1 + PRPN + excluding dead cells by morphology (example indicated by white arrow in phase). Scale bar: 50 µm. (E) Calcium imaging of day-14 sensory neurons (D14 mSN), seeded at 50,000 cells/cm2 on day 7, showing minimal response to dimethyl sulfoxide (DMSO), strong and tetrodotoxin (TTX)-sensitive response to veratridine, and strong response to potassium chloride (KCl). Lines are color-coded red for responder cells and black for nonresponder cells. Proportion of responder cell population indicated per graph.
FIGURE 2
FIGURE 2
Cell survival rate during CPA incubation prior to cryopreservation as monitored over time of exposure to the non-DMSO CPA solution vs. the DMSO-based solution for (A) D5 crest, (B) D7 SN, and (C) D14 mSN, respectively. Data are represented as mean ± 95% confidence interval. n = 4.
FIGURE 3
FIGURE 3
Membrane fluidity and cell size fluctuation along hiPSC derivation to sensory neurons. (A) Cell membrane fluidity at different stages of the sensory neuron differentiation and maturation process with all statistically significant pairwise differences. Data are represented as mean ± 95% confidence interval. n = 9. *p < 0.05. (B) Diameter of D5 crest vs. D7 SN vs. D14 mSN dissociated from culture and suspended in growth medium. Data are represented as mean ± 95% confidence interval. Range of n: 60–98. *p < 0.05.
FIGURE 4
FIGURE 4
Effects of undercooling on freezing behaviors of D5 crest, D7 SN, and D14 mSN, respectively, as observed by low-temperature Raman spectroscopy, comparing different ice nucleation temperatures between −4°C and −8°C. Data are represented as mean ± 95% confidence interval. n = 10, except for striped columns representing measurements of subset population n = 5 for D7 SN and n = 7 for D14 mSN due to interference of intracellular ice. n-D, non-DMSO; D, DMSO. n.s.: p > 0.05; *p < 0.05 (see Supplementary Figure S2 for method illustration of each metric.). (A) Intracellular ice formation (blue) significantly increased with greater undercooling only in the case of D7 SN in the DMSO solution and D14 mSN in both non-DMSO and DMSO solutions; no significant change otherwise. (B) Membrane partitioning of non-DMSO CPA significantly decreased in D14 mSN subject to greater undercooling, partitioning of DMSO lower than that of non-DMSO CPA across all three cell stages. (C) Cellular integrity in terms of spatial autocorrelation of the amide I signal of protein decreased significantly for D14 mSN with greater undercooling and decreased further in the DMSO solution; no significant loss of integrity in D5 crest or D7 SN. (D) Significant cytochrome C (cyt C) release was observed for D14 mSN in the DMSO solution but not for any cell stage in the non-DMSO CPA. Kruskal–Wallis ANOVA performed for non-normal distribution of cyt C Moran’s I values.
FIGURE 5
FIGURE 5
Effects of cooling rate on freezing behaviors of D5 crest, D7 SN, and D14 mSN, as observed by low-temperature Raman spectroscopy, comparing different cooling rates between −1°C/min, −3°C/min, and −5°C/min, respectively. Data are represented as mean ± 95% confidence interval. n = 10. n.s.: p > 0.05; *p < 0.05 (see Supplementary Figure S2 for method illustration of each metric.) (A) Intracellular ice formation (blue) increased with the faster cooling rates in D5 crest and D14 mSN; no significant difference across cooling rates in D7 SN. (B) Membrane partitioning of non-DMSO CPA significantly decreased in D5 crest and D14 mSN with the faster cooling rates; no significant difference across cooling rates in D7 SN. (C) Loss of cell volume as a result of freezing intensified with the faster cooling rates for D5 crest and D14 mSN; no significant difference across cooling rates in D7 SN. (D) Significant cytochrome C (cyt C) release was observed for D14 mSN with the faster cooling rates but not for D5 crest or D7 SN at any of the cooling rates. Kruskal–Wallis ANOVA performed for non-normal distribution of cyt C Moran’s I values.
FIGURE 6
FIGURE 6
Post-thaw survival and function of cryopreserved D5 crest under varying nucleation temperatures and cooling rates. *p < 0.05; n.s.: p > 0.05. Red box: best-case parameters tested with the highest recovery and reattachment. (A) Post-thaw recovery of D5 crest showing no significant change with greater undercooling but trending significantly lower with faster cooling rate. n = 4. (B) Post-thaw reattachment of D5 crest showing similar trends as recovery but more distinct cell damage with cooling rates of −3°C/min and −5°C/min. n = 4. (C) Immunocytochemistry 48 h after re-culture of dissociated (fresh) or cryopreserved (best-case) D5 crest showing <1% TUJ1+, PRPN+ (white arrowheads) neuron differentiation, and a vast majority of resulted cell population with crest-like morphology and low-level, cytoplasmic TUJ1 and PRPN staining. Scale bar: 100 µm.
FIGURE 7
FIGURE 7
Post-thaw survival and function of cryopreserved D7 SN under varying nucleation temperatures and cooling rates. Data are represented as mean ± 95% confidence interval. *p < 0.05; n.s.: p > 0.05. Red box: best-case parameters tested with the highest recovery and reattachment. (A) Post-thaw recovery of D7 SN showing no significant change with greater undercooling and the best cooling rate at −3°C/min with statistical significance. n = 4. (B) Post-thaw reattachment of D7 SN showing similar trends as recovery but more distinct cell damage with lower nucleation temperature (−8°C). n = 4. (C) Calcein AM-stained culture 24 h after replating dissociated (fresh) or cryopreserved (best-case) D7 SN showing high confluence and normal morphology of immature neurons. Scale bar: 100 µm. (D) Calcium imaging of post-thaw culture after 7-day maturation of D7 SN cryopreserved with −4°C nucleation and −3°C/min cooling rate, showing little to no response to 0.1% DMSO (negative control), positive response to 1 µM veratridine that was inhibited by TTX, and positive response to 30 mM KCl that was unaffected by TTX. Red line: responder cell; black line: nonresponder cell. Proportion of responder cell population indicated per graph. Range of n = 417–662.
FIGURE 8
FIGURE 8
Post-thaw survival and function of cryopreserved D14 mSN under varying nucleation temperatures and cooling rates. Data are represented as mean ± 95% confidence interval. *p < 0.05; n.s.: p > 0.05. (A) Post-thaw recovery of D14 mSN showing no significant change with greater undercooling but trending significantly lower with faster cooling rate. n = 4. Red box: best-case parameters tested with the highest recovery. (B) Post-thaw reattachment of D14 mSN, normalized to reattachment of dissociated fresh cell control, showing no significant difference between any of the test conditions. n = 4. Crossed-out columns denoting insensitive post-thaw assay due to poor outcome of control cells. (C) Calcein AM-stained culture 24 and 48 h after replating dissociated (fresh) or cryopreserved (best-case) D14 mSN, showing a vast majority of live (calcein AM positive) cell population nonadherent or with rounded morphology in the first 24 h that was more sparsely distributed in the post-thaw culture, as well as subsequent nearly complete cell loss in both conditions at 48 h. Scale bar: 100 µm.

References

    1. Adam M., Potter A. S., Potter S. S. (2017). Psychrophilic Proteases Dramatically Reduce Single Cell RNA-Seq Artifacts: A Molecular Atlas of Kidney Development. Development 144, 3625–3632. 10.1242/dev.151142 - DOI - PMC - PubMed
    1. Beier A. F., Schulz J. C., Zimmermann H. (2013). Cryopreservation with a Twist - towards a Sterile, Serum-free Surface-Based Vitrification of hESCs. Cryobiology 66, 8–16. 10.1016/J.CRYOBIOL.2012.10.001 - DOI - PubMed
    1. Best B. P. (2015). Cryoprotectant Toxicity: Facts, Issues, and Questions. Rejuvenation Res. 18, 422–436. 10.1089/rej.2014.1656 - DOI - PMC - PubMed
    1. Blesbois E., Grasseau I., Seigneurin F. (2005). Membrane Fluidity and the Ability of Domestic Bird Spermatozoa to Survive Cryopreservation. Reproduction 129, 371–378. 10.1530/rep.1.00454 - DOI - PubMed
    1. Brownjohn P. W., Smith J., Portelius E., Serneels L., Kvartsberg H., De Strooper B., et al. (2017). Phenotypic Screening Identifies Modulators of Amyloid Precursor Protein Processing in Human Stem Cell Models of Alzheimer's Disease. Stem Cel Rep. 8, 870–882. 10.1016/J.STEMCR.2017.02.006 - DOI - PMC - PubMed

LinkOut - more resources