. 2022 Jan 18;94(2):975-984.
doi: 10.1021/acs.analchem.1c03850. Epub 2021 Dec 31.

Label-Free Plasmonic Biosensor for Rapid, Quantitative, and Highly Sensitive COVID-19 Serology: Implementation and Clinical Validation

Affiliations

Label-Free Plasmonic Biosensor for Rapid, Quantitative, and Highly Sensitive COVID-19 Serology: Implementation and Clinical Validation

Olalla Calvo-Lozano et al. Anal Chem. .

Abstract

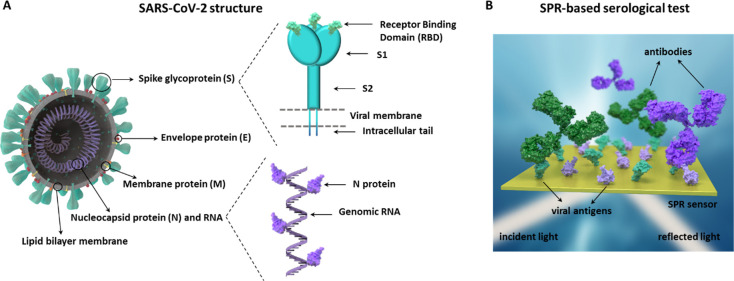
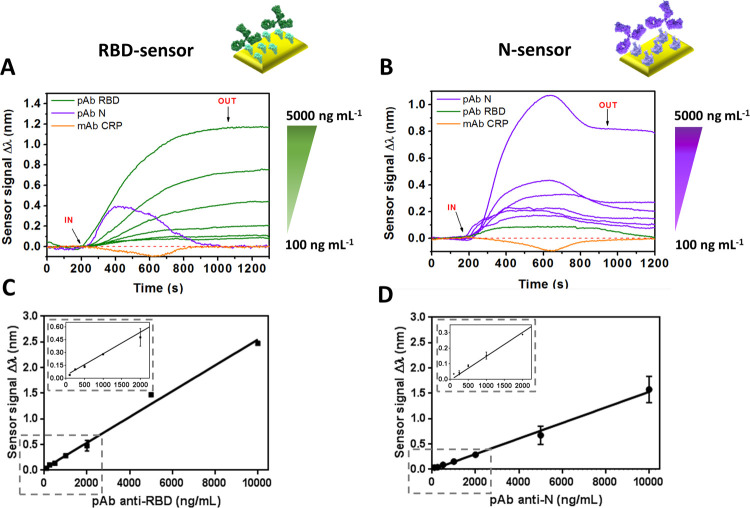
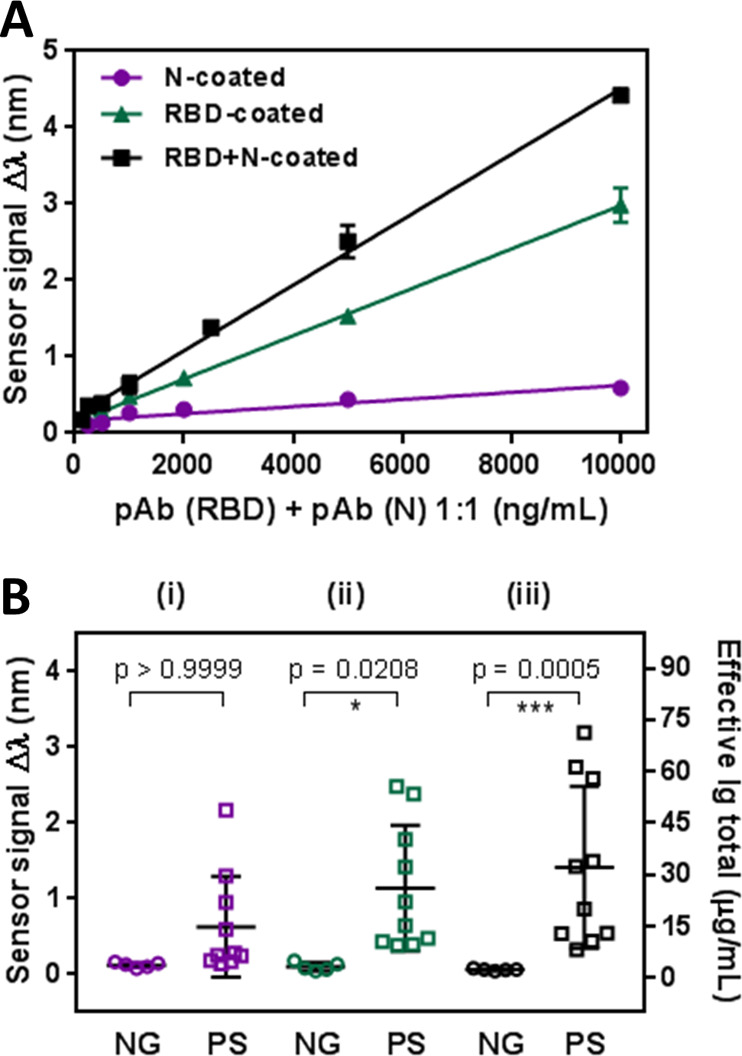
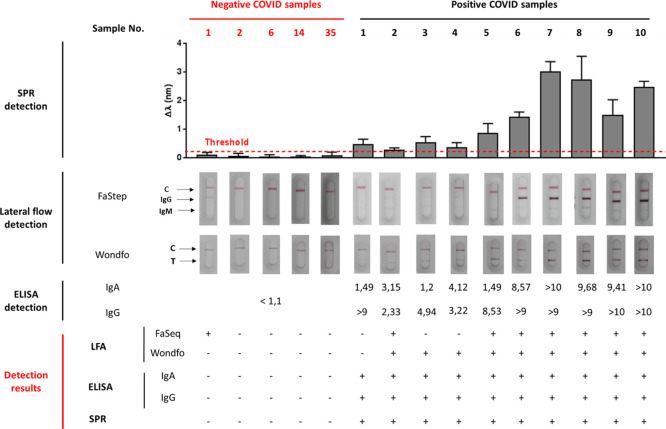
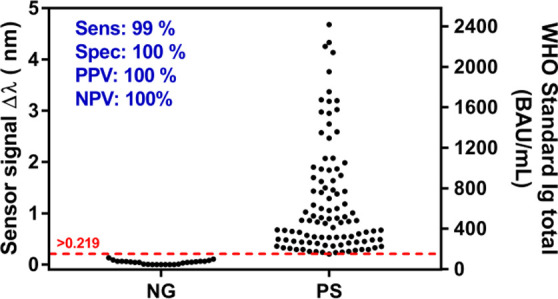
Serological tests are essential for the control and management of COVID-19 pandemic (diagnostics and surveillance, and epidemiological and immunity studies). We introduce a direct serological biosensor assay employing proprietary technology based on plasmonics, which offers rapid (<15 min) identification and quantification of severe acute respiratory syndrome coronavirus 2 (SARS-CoV-2) antibodies in clinical samples, without signal amplification. The portable plasmonic device employs a custom-designed multiantigen (RBD peptide and N protein) sensor biochip and reaches detection limits in the low ng mL-1 range employing polyclonal antibodies. It has also been implemented employing the WHO-approved anti-SARS-CoV-2 immunoglobulin standard. A clinical validation with COVID-19 positive and negative samples (n = 120) demonstrates its excellent diagnostic sensitivity (99%) and specificity (100%). This positions our biosensor as an accurate and easy-to-use diagnostics tool for rapid and reliable COVID-19 serology to be employed both at laboratory and decentralized settings for the disease management and for the evaluation of immunological status during vaccination or treatment.


Conflict of interest statement

The authors declare no competing financial interest.

Figures

Figure 1
Figure 1
(A) SARS-CoV-2 virus structure and details of the spike (S) and nucleocapsid (N) proteins; (B) scheme of the two-antigen coimmobilized sensor biochips employed in the SPR biosensor for COVID-19 serology.
Figure 2
Figure 2
Real-time sensorgrams for different antibody concentrations over a (A) RBD-coated sensor chip and (B) N-coated sensor chip, in standard buffer conditions. Calibration curves in standard buffer for (C) RBD-coated sensors chips and (D) N-coated sensor chips, using the corresponding pAb. Each signal corresponds to the mean ± SD of triplicate measurements. Nonspecific antibodies were measured at a concentration of 2000 ng mL–1. IN (time ∼ 200 s) and OUT (time ∼ 1100 s) arrows indicate the start and end time of the injection, respectively.
Figure 3
Figure 3
(A) Calibration curves with pAb-N and pAb-RBD in 10% diluted commercial serum using three different biofunctionalized surfaces (N, RBD and RBD + N). Sensor response represents the mean ± SD of three measurements. (B) Statistical comparison between the positive (PS) and negative (NG) clinical samples: (i) N-coated sensor chips; (ii) RBD-coated sensor chips; (iii) RBD + N-coated sensor chip. Kurskal–Wallis test (p = 0.05). Total Ig concentration calculated from the WHO standard anti-SARS-CoV-2 immunoglobulin calibration curve is shown in the right axis.
Figure 4
Figure 4
Performance comparison of different COVID-19 serological assays. SPR-biosensor assay, LFA tests, and ELISA tests are shown for positive and negative serum samples. LFA tests were considered as positive after the appearance of a colored band with regular (2) or strong (3) intensity in the IgG and/or IgM line, and negative for very weak (1) or noncolored bands (0). ELISA tests were considered positive for numeric values of IgG and/or IgA cutoff index (COI) > 1.1. SPR biosensor assays were considered positive for samples above the set threshold (red dotted line) calculated, as described in the Experimental section. Detection result rows show the numbers of positive (+) and negative (−) samples for each serological methodology.
Figure 5
Figure 5
Sensor signal distribution of 100 COVID-19 positive (PS) and 20 negative (NG) clinical samples. Total Ig concentration calculated from the WHO standard calibration curve is shown in the right axis. Sensitivity, specificity, PPV, NPV, and threshold are also shown.
Figure 6
Figure 6
Correlation outcome severity vs antibody concentration. Sensor signal of 40 COVID-19 positive samples from individuals with different degrees of severity (mild, moderate, and severe symptoms). Spearman test (p = 0.05). Total Ig concentration calculated from the WHO standard calibration curve is shown in the right axis.

References

    1. COVID-19 Map—Johns Hopkins Coronavirus Resource Center https://coronavirus.jhu.edu/map.html (accessed December 15, 2021).
    1. Hu B.; Guo H.; Zhou P.; Shi Z. L. Characteristics of SARS-CoV-2 and COVID-19. Nature Reviews Microbiology. Nat. Rev. Microbiol. 2021, 141–154. 10.1038/s41579-020-00459-7. - DOI - PMC - PubMed
    1. Wu D.; Wu T.; Liu Q.; Yang Z. The SARS-CoV-2 outbreak: What we know. Int. J. Infect. Dis. 2020, 94, 44.10.1016/j.ijid.2020.03.004. - DOI - PMC - PubMed
    1. Wiersinga W. J.; Rhodes A.; Cheng A. C.; Peacock S. J.; Prescott H. C. Pathophysiology, Transmission, Diagnosis, and Treatment of Coronavirus Disease 2019 (COVID-19): A Review. JAMA 2020, 324, 782–793. 10.1001/jama.2020.12839. - DOI - PubMed
    1. Zhang N.; Wang L.; Deng X.; Liang R.; Su M.; He C.; Hu L.; Su Y.; Ren J.; Yu F.; Du L.; Jiang S. Recent advances in the detection of respiratory virus infection in humans. J. Med. Virol. 2020, 92, 408–417. 10.1002/jmv.25674. - DOI - PMC - PubMed

Publication types

Substances