. 2022 Feb 1;163(2):bqab263.
doi: 10.1210/endocr/bqab263.

FOXO Transcription Factors Are Required for Normal Somatotrope Function and Growth

Affiliations

FOXO Transcription Factors Are Required for Normal Somatotrope Function and Growth

Caitlin E Stallings et al. Endocrinology. .

Abstract

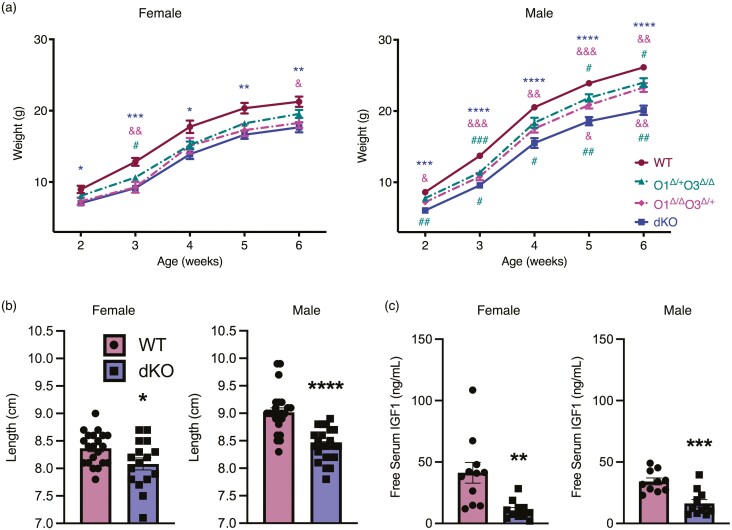
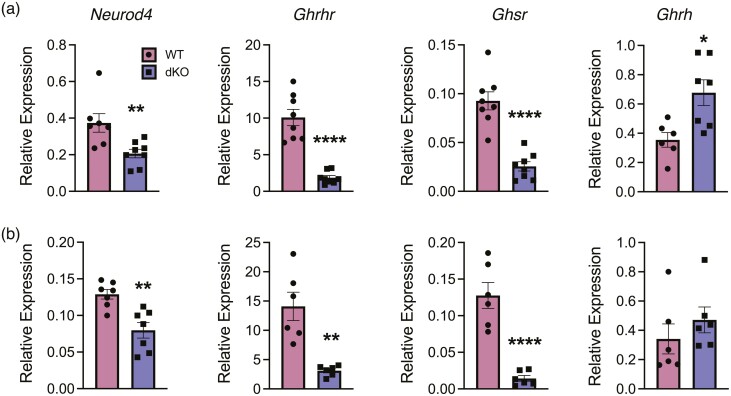
Understanding the molecular mechanisms underlying pituitary organogenesis and function is essential for improving therapeutics and molecular diagnoses for hypopituitarism. We previously found that deletion of the forkhead factor, Foxo1, in the pituitary gland early in development delays somatotrope differentiation. While these mice grow normally, they have reduced growth hormone expression and free serum insulin-like growth factor-1 (IGF1) levels, suggesting a defect in somatotrope function. FOXO factors show functional redundancy in other tissues, so we deleted both Foxo1 and its closely related family member, Foxo3, from the primordial pituitary. We find that this results in a significant reduction in growth. Consistent with this, male and female mice in which both genes have been deleted in the pituitary gland (dKO) exhibit reduced pituitary growth hormone expression and serum IGF1 levels. Expression of the somatotrope differentiation factor, Neurod4, is reduced in these mice. This suggests a mechanism underlying proper somatotrope function is the regulation of Neurod4 expression by FOXO factors. Additionally, dKO mice have reduced Lhb expression and females also have reduced Fshb and Prl expression. These studies reveal FOXO transcription factors as important regulators of pituitary gland function.

Keywords: FOXO1; FOXO3; forkhead; growth hormone; pituitary.


Figures

Figure 1.
Figure 1.
Growth hormone expression is reduced postnatally in the absence of Foxo1. (a) Quantitative reverse transcription–polymerase chain reaction (RTqPCR) was performed for Gh1 using whole pituitary glands from mixed-sex 21-day-old mice from either WT or Foxo1Δpit animals. (b) Unbound IGF1 protein in the serum of WT and Foxo1Δpit mice was analyzed at postnatal day (P)21 using a sandwich ELISA. Eight animals of mixed sex were analyzed per genotype. Significance was measured using Student’s t test. Significant differences are represented by asterisks, *P < 0.05. (c) Neurod4 expression in whole pituitary glands from mixed-sex 21-day-old mice was measured using RTqPCR. (d) Relative expression of the FOXO family of transcription factors was assessed in wild-type (WT) pituitary gland tissue at embryonic day (e)16.5 (green), P10 (blue), and P21 (purple). Expression was normalized to Tfrc, a gene shown to not differ between genotypes, in order to compare different ages. Analysis was of 4-5 animals per age group of mixed sexes. (e) Foxo3 expression in whole pituitary glands from mixed-sex 21-day-old mice was measured using RTqPCR. (a, c, e) Five animals were compared from each genotype and analyzed using Student’s t test. Expression is relative to WT.
Figure 2.
Figure 2.
FOXO3 is present in all hormone-producing pituitary cell types. (a) Immunohistochemistry was performed on at least 3 wild-type animals of varying sexes at progressive time points to identify FOXO3 protein and localization during development. FOXO3 (green) appears nuclear (identified in blue via DAPI) in the invaginating oral ectoderm as early as e10.5. Scale bars indicate 100 µm. (b) Whole pituitary gland tissue was collected from female and male WT mice at 6 weeks of age and analyzed for co-expression of FOXO3 (green) and various hormones (red) by immunohistochemistry. Three animals were analyzed from each sex with representative images shown. Scale bars indicate 100 µm. (c) The sections were analyzed for relative populations of hormone-FOXO3 co-stained cells by manual counting. The graph shows percent cells that were both hormone and FOXO3 positive where female data is in pink and male data in blue. Data are represented by mean ± SEM. (d) Analysis of scRNAseq data from 7-week-old male mice (Cheung et al, accession: GSE120410) reveals that the majority of FOXO-containing pituitary cells express either Foxo1 (green) or Foxo3 (blue) and they are co-expressed (red) only in a small percentage of cells.
Figure 3.
Figure 3.
Foxo1 and Foxo3 are effectively excised in dKO mice. Whole pituitary gland tissue was collected from WT and dKO animals at 6 weeks of age and either fixed for immunohistochemistry or processed for mRNA analysis in females (a, b) and males (c, d). Pituitary tissue sections were assayed for FOXO1 and FOXO3 protein (green) via immunohistochemistry. Cell nuclei are blue. Dark green coloration most evident in the male FOXO3-dKO panel is autofluorescence of red blood cells. At least 3 animals from each genotype and each sex were analyzed, representative images are shown. Scale bars indicate 100 µm. Expression was normalized to Tfrc. Testing was performed on 6-7 animals from each group and comparisons used Student’s t test (****P < 0.0001).
Figure 4.
Figure 4.
Growth is impaired in dKO mice. (a) WT (maroon) and dKO (dark blue) mice, as well as mice of intermediate genotypes (pink and teal dotted lines), were weighed weekly. Data were collected from 12 animals and statistics performed using 2-way ANOVA with repeated measures and Tukey’s post hoc test for multiple comparisons. Asterisks indicate significance when comparing WT with dKO. Ampersands indicate significance when comparing O1∆/∆O3∆/+ to WT (above lines) and dKO (below lines), and number signs for O1∆/+O3∆/∆ vs WT (above lines) and dKO (below lines). (b) Mice were measured for length from nose-to-rump at 6 weeks. Results were compared using Student’s t test with 13-20 animals analyzed per genotype and sex. (c) At 6 weeks of age, serum IGF1 was assayed using an ELISA. Data were analyzed with Student’s t test. Eleven samples were analyzed per genotype per sex. Significance for all figures is shown with an asterisk, ampersand, or number sign (*P < 0.05, **P < 0.01, ***P < 0.001, ****P < 0.0001).
Figure 5.
Figure 5.
FOXO deletion does not exert a dosage-dependent effect at the mRNA level. Whole pituitary glands were collected from WT (maroon), intermediate genotypes (teal, pink) and dKO (blue) mice at 6 weeks of age. Abundance of mRNA was evaluated for Gh1 and Pou1f1 in females (a) and males (b). Expression was normalized to Tfrc. This gene does differ between sexes, therefore relative expression between male and female groups cannot be compared here. The data represent 7-8 animals for each genotype and sex and were analyzed using 1-way ANOVA with Tukey’s post hoc test (**P < 0.01, ***P < 0.001, ****P < 0.0001).
Figure 6.
Figure 6.
Expression of genes in the growth axis is altered in dKO mice. Whole pituitary glands were collected from WT (maroon) and dKO (blue) mice at 6 weeks of age. RNA was isolated and cDNA generated in order to evaluate mRNA abundance for Neurod4, Ghrhr, and Ghsr in females (a) and males (b). Hypothalamus was collected to evaluate expression of Ghrh. Expression was normalized to Tfrc. The data represent 7-8 animals for each genotype and sex and were analyzed using Student’s t test (*P < 0.05, **P < 0.01, ****P < 0.0001).
Figure 7.
Figure 7.
Pituitary GH protein content is only reduced by half in dKO mice. (a) GH protein was visualized in sections of pituitary glands from 6-week-old male and female mice via immunohistochemistry. GH (red) is detected in the cytoplasm of pituitary gland cells surrounding the nucleus (blue, DAPI). Scale bars indicate 100 µm. (b) Western blot analysis was performed to quantify pituitary GH (red) protein content. ACTB (green) was used as a loading control. (c) Quantification of western blot signal comparing WT (maroon) and dKO (blue). The data represent 3 animals for each genotype and sex, are presented as fold change relative to WT, and were analyzed using Student’s t test (**P < 0.01).
Figure 8.
Figure 8.
Gonadotropin expression is reduced in dKO mice. RTqPCR analysis of WT and dKO mouse pituitary glands reveals a reduction in Lhb expression in males and females. Females also exhibit reduced Fshb and Prl expression. Expression was normalized to Tfrc. The data represent 7-8 animals for each genotype and sex. Data were analyzed by Student’s t test (*P < 0.05, **P < 0.001).
Figure 9.
Figure 9.
The number of FSHB-positive cells is trending down in dKO female mice. (a) Immunohistochemistry for FSHB (red) was performed on pituitary sections from 3 WT and 3 dKO female mice. Two sections each for WT and dKO are shown to demonstrate the range of the phenotype. Scale bars represent 100 μm. The number of (b) FSHB and (c) LHB-positive cells in wild-type (maroon) and dKO (blue) mouse pituitary glands were counted and normalized for anterior lobe area. Data were analyzed by Student’s t test.
Figure 10.
Figure 10.
FOXO factors are members of a transcriptional somatotrope feedforward loop. Our studies indicate that FOXO transcription factors are important for expression of Pou1f1, Neurod4, and Gh1. POU1F1 directly binds multiple regulatory sites for Neurod4 and Gh1 as well as autoregulating itself (3, 54-56). Loss of NEUROD4 leads to loss of Gh1 expression; however, direct regulation has not been tested (3). Thus, FOXO transcription factors appear to participate in a transcriptional feedforward loop to promote somatotrope function.

Similar articles

Cited by

References

    1. Davis SW, Keisler JL, Perez-Millan MI, Schade V, Camper SA. All hormone-producing cell types of the pituitary intermediate and anterior lobes derive from Prop1-expressing progenitors. Endocrinology. 2016;157(4):1385-1396. - PMC - PubMed
    1. Li S, Crenshaw EB 3rd, Rawson EJ, Simmons DM, Swanson LW, Rosenfeld MG. Dwarf locus mutants lacking three pituitary cell types result from mutations in the POU-domain gene pit-1. Nature. 1990;347(6293):528-533. - PubMed
    1. Zhu X, Zhang J, Tollkuhn J, et al. . Sustained Notch signaling in progenitors is required for sequential emergence of distinct cell lineages during organogenesis. Genes Dev. 2006;20(19):2739-2753. - PMC - PubMed
    1. Ando M, Goto M, Hojo M, et al. . The proneural bHLH genes Mash1, Math3 and NeuroD are required for pituitary development. J Mol Endocrinol. 2018;61(3):127-138. - PubMed
    1. Mayo KE, Miller T, DeAlmeida V, Godfrey P, Zheng J, Cunha SR. Regulation of the pituitary somatotroph cell by GHRH and its receptor. Recent Prog Horm Res. 2000;55:237-266; discussion 266-237. - PubMed

Publication types

MeSH terms