

Integrin CD11b provides a new marker of pre-germinal center IgA+ B cells in murine Peyer's patches
- PMID: 34971392
- PMCID: PMC9020567
- DOI: 10.1093/intimm/dxab113
Integrin CD11b provides a new marker of pre-germinal center IgA+ B cells in murine Peyer's patches
Abstract
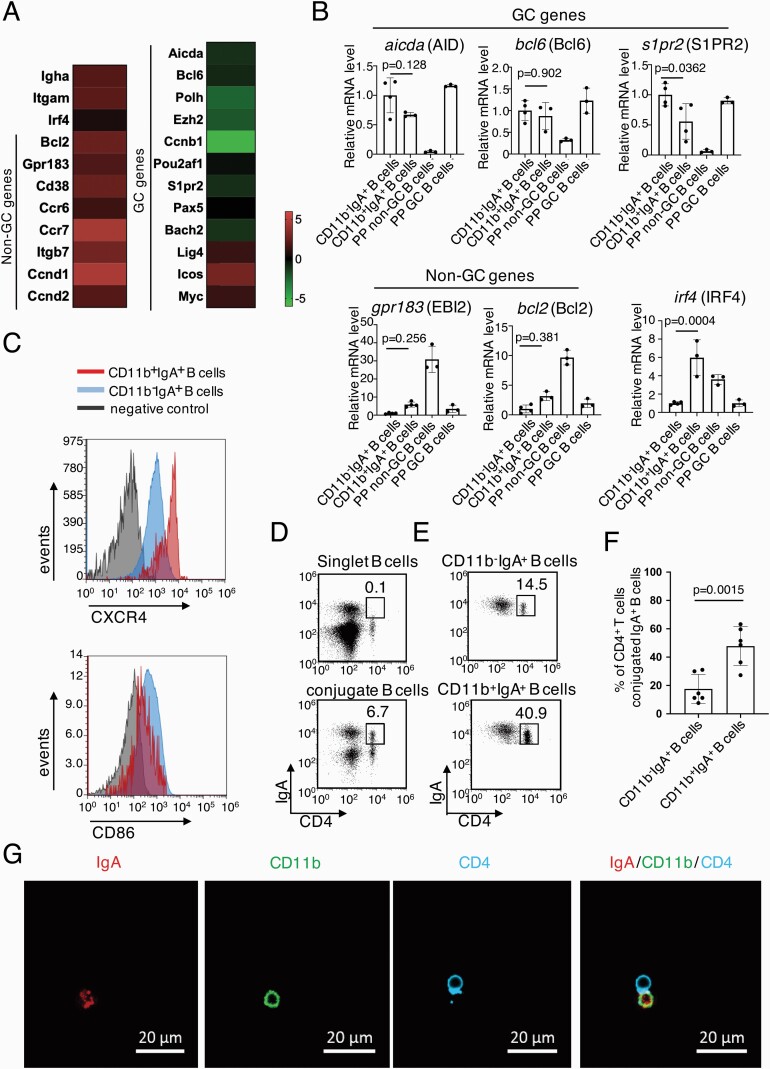
Activated B cells can enter germinal centers (GCs) for affinity maturation to produce high-affinity antibodies. However, which activated B cells will enter GCs remains unknown. Here, we found a small population of CD11b+IgA+ B cells located outside of GCs in murine Peyer's patches (PPs). After injection of the CD11b+IgA+ PP B cells into a PP of a recipient mouse, they entered GCs forty hours later. They expressed GC surface markers and pre-GC B cell genes, suggesting that CD11b provides a novel surface marker of pre-GC IgA+ B cells in murine PPs. Furthermore, independently of dendritic cell activation, CD11b expression on B cells can be induced by bacterial antigens, such as pam3CSK4 and heat-killed Escherichia coli in vitro. In addition, mice orally administered with pam3CSK4 or heat-killed E. coli increased the number of PP GC B cells within two days, and enhanced the mucosal antigen-specific IgA response. Our results demonstrate that the induction of CD11b on B cells is a promising marker for selecting an effective mucosal vaccine adjuvant.
Keywords: B cell stimulation; CD11b; affinity maturation; pre-GC B cell marker.
© The Author(s) 2021. Published by Oxford University Press on behalf of The Japanese Society for Immunology.
Figures


Similar articles
-
Peyer's patches-derived CD11b+ B cells recruit regulatory T cells through CXCL9 in dextran sulphate sodium-induced colitis.Immunology. 2018 Nov;155(3):356-366. doi: 10.1111/imm.12977. Epub 2018 Jul 26. Immunology. 2018. PMID: 29969845 Free PMC article.
-
Dietary Antigens Induce Germinal Center Responses in Peyer's Patches and Antigen-Specific IgA Production.Front Immunol. 2019 Oct 15;10:2432. doi: 10.3389/fimmu.2019.02432. eCollection 2019. Front Immunol. 2019. PMID: 31681315 Free PMC article.
-
Affinity-based clonal selection in Peyer's patches.Curr Opin Immunol. 2022 Feb;74:100-105. doi: 10.1016/j.coi.2021.11.002. Epub 2021 Nov 27. Curr Opin Immunol. 2022. PMID: 34847473 Review.
-
CD11b+ Peyer's patch dendritic cells secrete IL-6 and induce IgA secretion from naive B cells.J Immunol. 2003 Oct 1;171(7):3684-90. doi: 10.4049/jimmunol.171.7.3684. J Immunol. 2003. PMID: 14500666
-
Mucosal immunoregulation: environmental lipopolysaccharide and GALT T lymphocytes regulate the IgA response.Microbiol Immunol. 1984;28(3):261-80. doi: 10.1111/j.1348-0421.1984.tb00679.x. Microbiol Immunol. 1984. PMID: 6234450 Review.
Cited by
-
Intestinal immunoglobulins under microbial dysbiosis: implications in opioid-induced microbial dysbiosis.Front Microbiol. 2025 Apr 14;16:1580661. doi: 10.3389/fmicb.2025.1580661. eCollection 2025. Front Microbiol. 2025. PMID: 40297286 Free PMC article. Review.
-
Role of mucosal IgA antibodies as novel therapies to enhance mucosal barriers.Semin Immunopathol. 2024 Nov 20;47(1):1. doi: 10.1007/s00281-024-01027-4. Semin Immunopathol. 2024. PMID: 39567378 Free PMC article. Review.
-
Partially Hydrolyzed Guar Gum Intake Supports the Gut Microbiota and Attenuates Inflammation during Influenza H1N1 Virus Infection in Mice.Nutrients. 2023 Oct 3;15(19):4252. doi: 10.3390/nu15194252. Nutrients. 2023. PMID: 37836536 Free PMC article.
-
Morphine-induced intestinal microbial dysbiosis drives TLR-dependent IgA targeting of gram-positive bacteria and upregulation of CD11b and TLR2 on a sub-population of IgA+ B cells.Gut Microbes. 2024 Jan-Dec;16(1):2417729. doi: 10.1080/19490976.2024.2417729. Epub 2024 Oct 23. Gut Microbes. 2024. PMID: 39441178 Free PMC article.
References
-
- Kurosaki, T., Kometani, K. and Ise, W. 2015. Memory B cells. Nat. Rev. Immunol. 15:149. - PubMed
MeSH terms
Substances
LinkOut - more resources
Full Text Sources
Other Literature Sources
Research Materials
Miscellaneous
