. 2021 Dec 31;79(1):68.
doi: 10.1007/s00018-021-04031-1.

Development of a novel and synthetic HematoMiR technology that broadly modulates quiescence of stem cells and enhances HSC expansion

Affiliations

Development of a novel and synthetic HematoMiR technology that broadly modulates quiescence of stem cells and enhances HSC expansion

Merve Uslu et al. Cell Mol Life Sci. .

Abstract

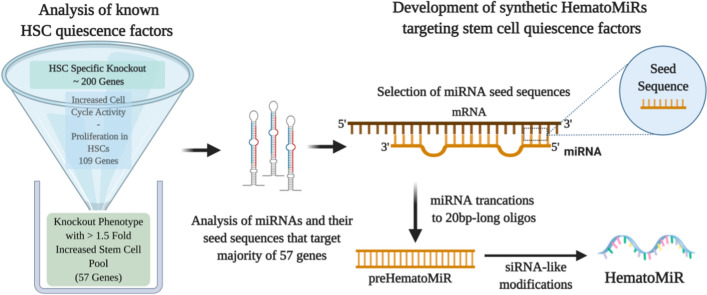
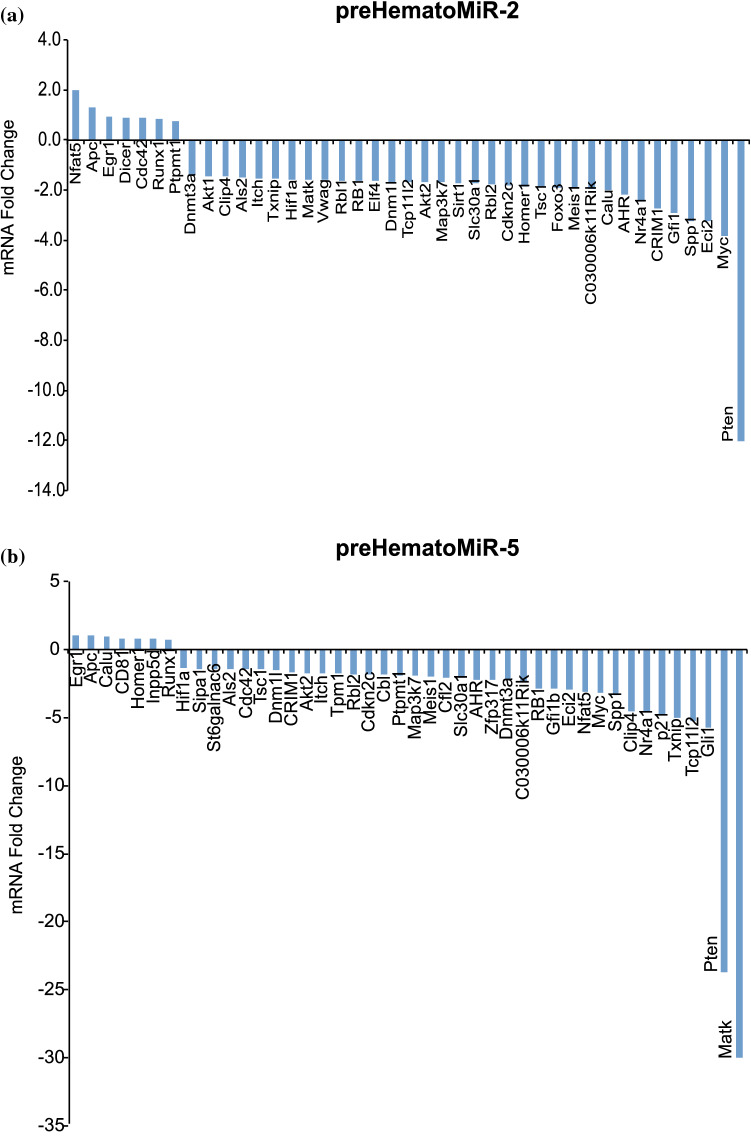
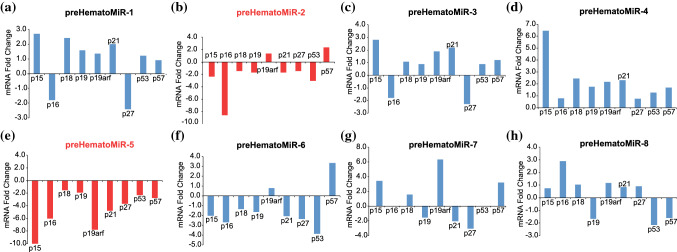
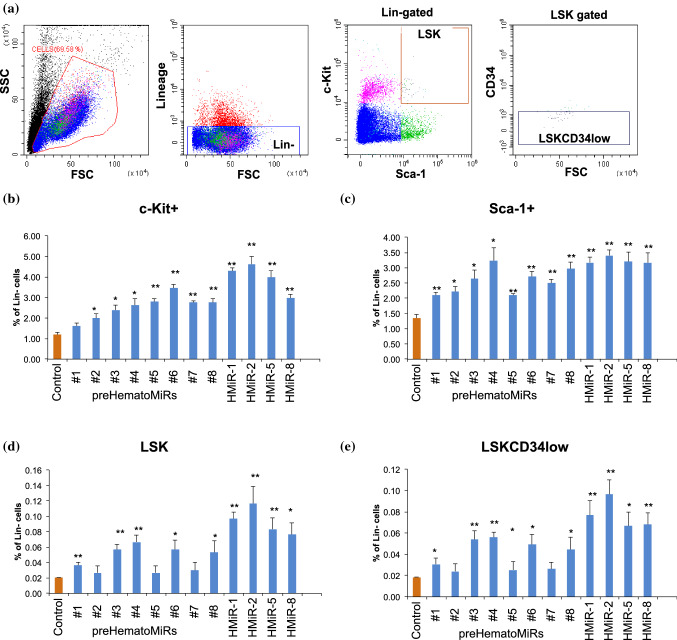
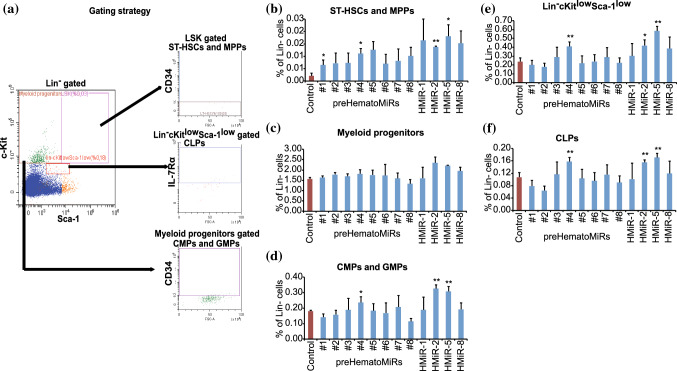
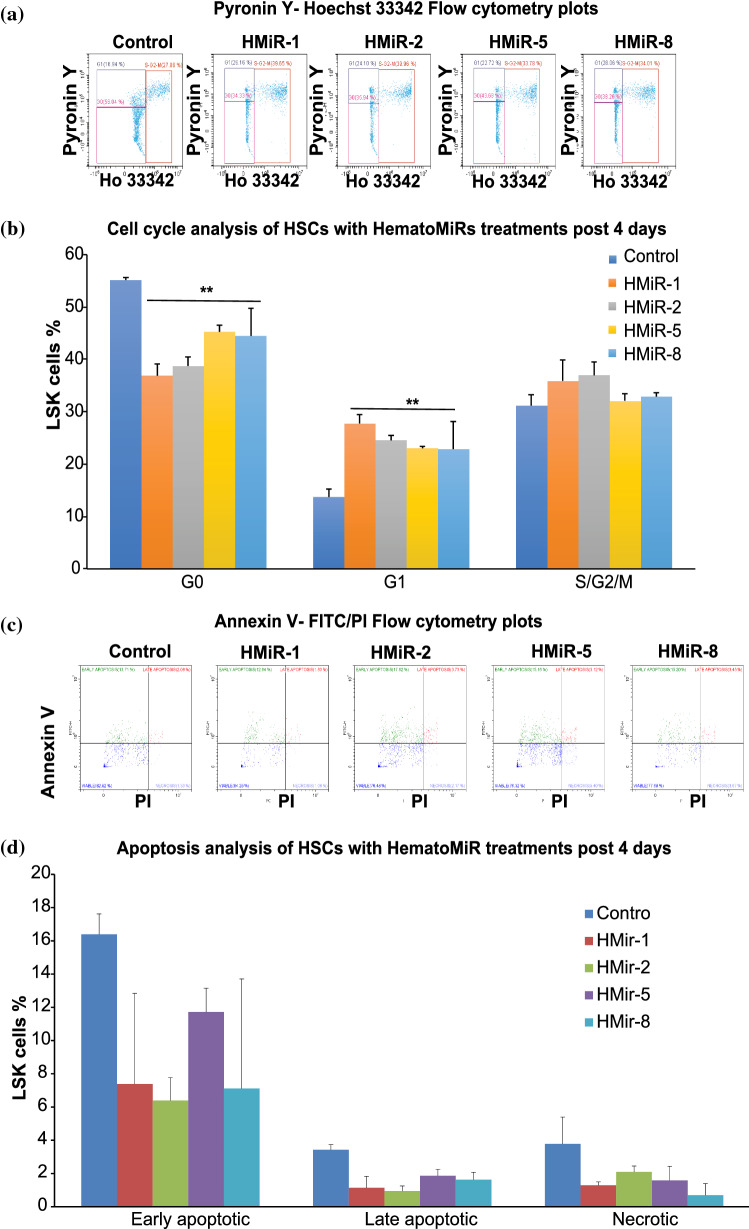
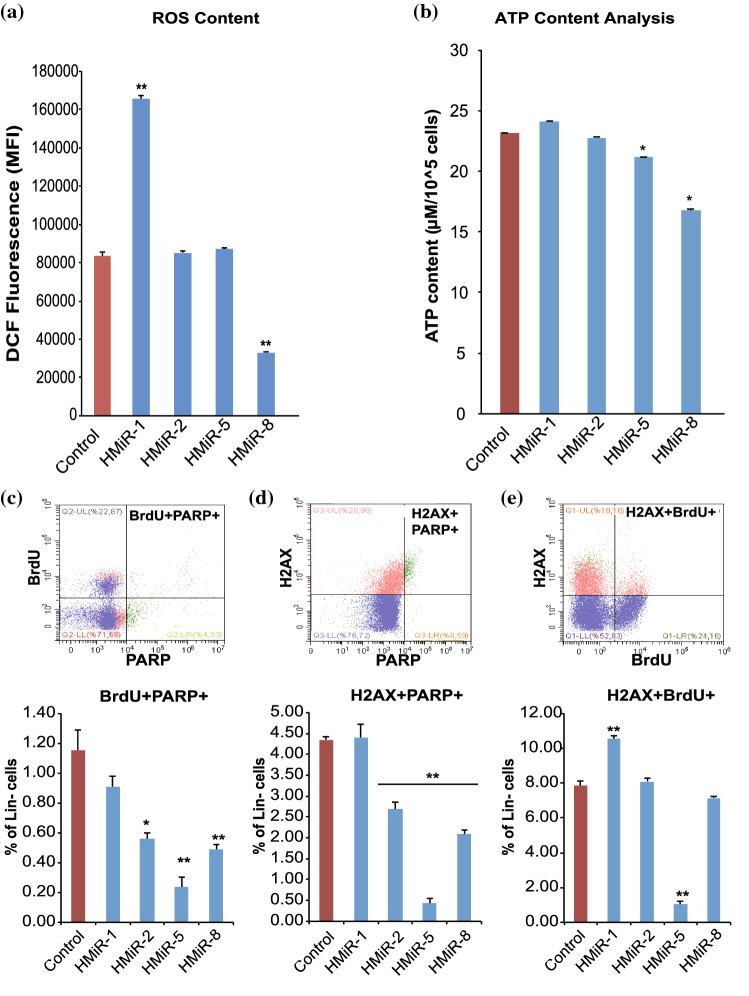
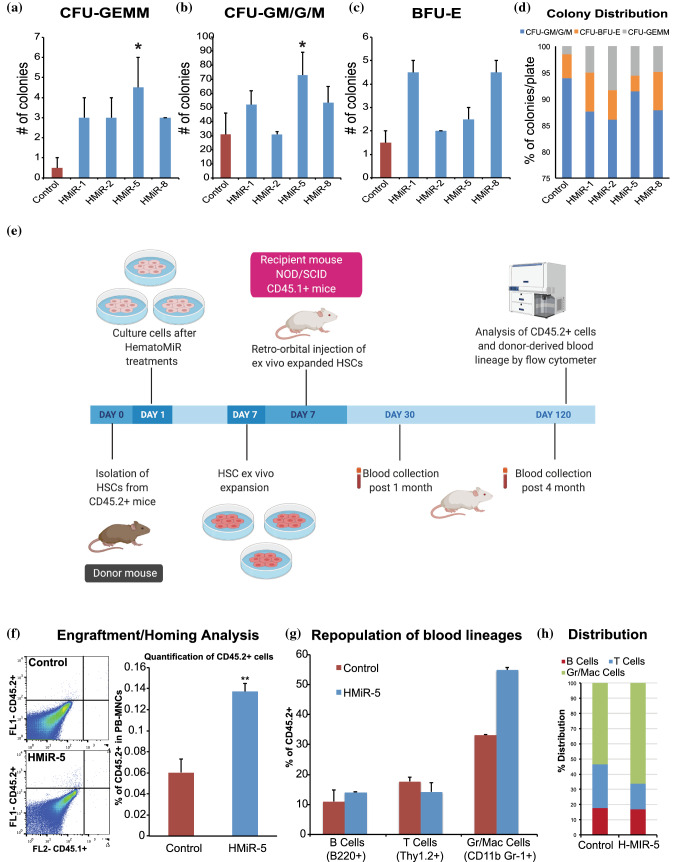
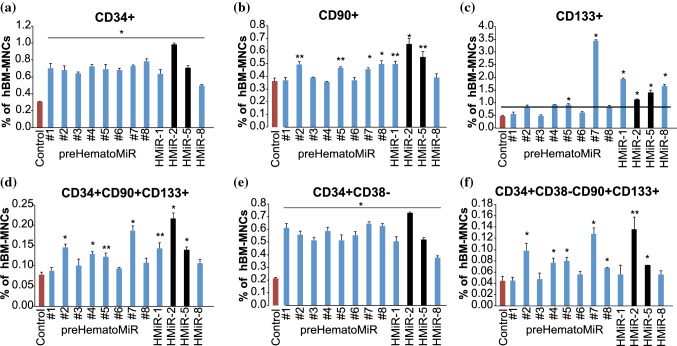
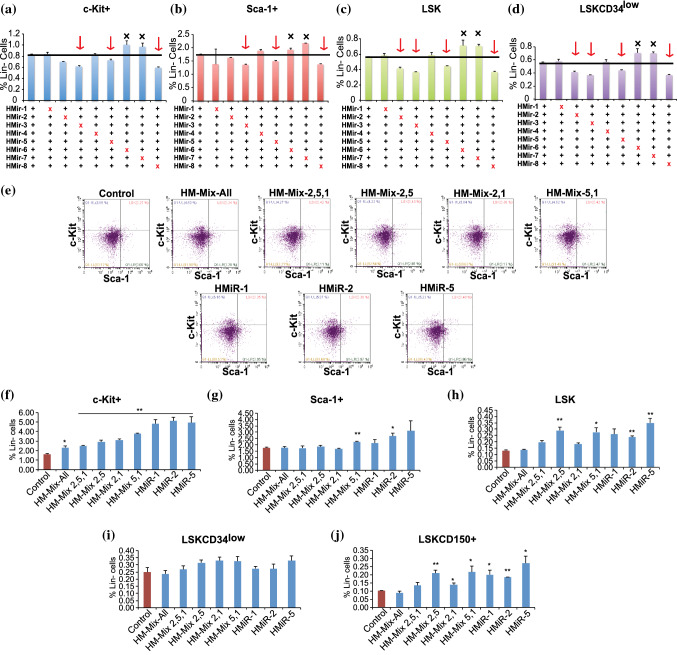
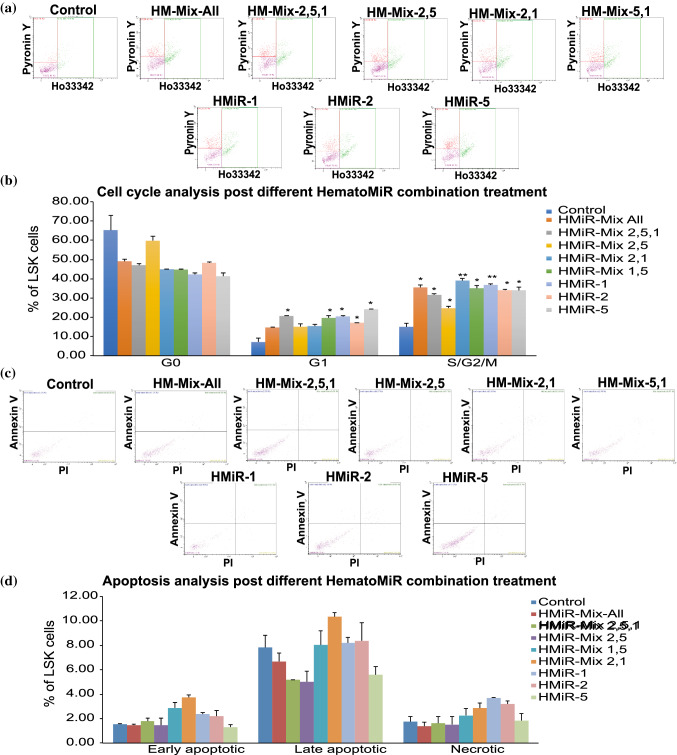
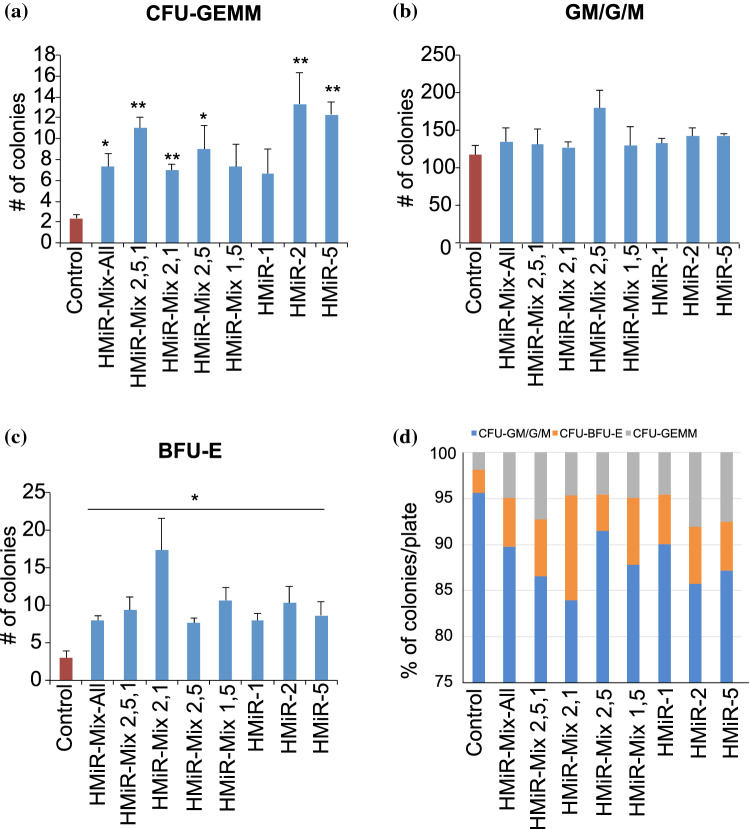
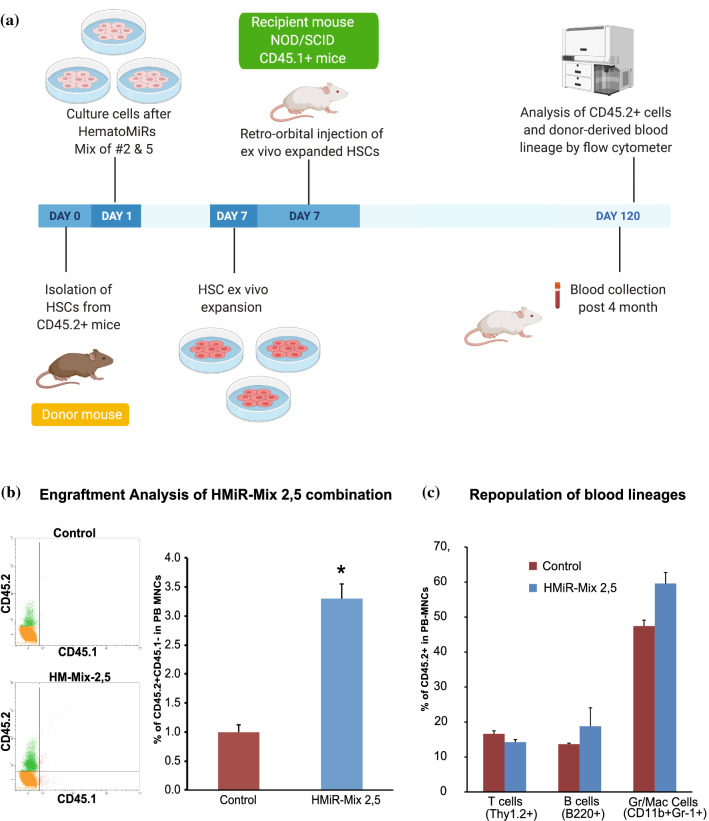
Hematopoietic stem cell (HSCs) transplantation is the primary therapeutic modality used to treat hematopoietic disorders. It centers on the capability of a small quantity of HSCs to repopulate whole blood lineages. Along with limited availability of suitable donors, the need for sufficient number of donor HSCs is still challenging in clinical relevance. This has been addressed by ex vivo HSC expansion albeit with partial success, and thus development of an alternative strategy that could improve HSC expansion is required. To that end, we aimed to build HematoMiR, an oligo-based technology that broadly targets HSC quiescence factors. Here, we show that HematoMiRs and their combinations targeting over 50 factors involved in HSC quiescence could induce robust ex vivo murine and human HSC expansion. In particular, HematoMiR-5 treatment enhanced cell cycle through down-regulation of negative cell cycle regulators in HSCs. HematoMiR-5 treated HSPCs had reduced DNA damage during the course of ex vivo expansion. Moreover, HematoMiR-5 treatment led to sustained HSC self-renewal ability and a low apoptosis rate. In addition, HematoMiR-5 expanded HSCs demonstrated successful engraftment and repopulation capacity in the recipient animals. Furthermore, combinatorial treatments of HematoMiR-2 and 5 allowed vigorous ex vivo HSC expansion. These findings demonstrate that novel and synthetic HematoMiR technology is feasible for HSC ex vivo expansion through the sequence-dependent modulation of numerous HSC quiescence modulators.

Keywords: Engraftment; Ex vivo expansion; HSC self-renewal; RNA interference; Short-RNA.


Conflict of interest statement

All authors declare that they have no conflicts of interest concerning this work.

Figures

Fig. 1
Fig. 1
Methodology of development of HematoMiR targeting hematopoietic factors for ex vivo HSC expansion. HSC modulator genes were analyzed and HSC target gene pool including HSC intrinsic and extrinsic factors to be targeted by HematoMiRs was constructed. Then, putative miRNAs for each gene in our target pool were listed and analyzed. Eight miRNA seed sequences were determined according to the targeting ability of target pool and chemically modified into double stranded siRNA format post modification on mature sequences
Fig. 2
Fig. 2
Gene expression analysis of HSC quiescence regulators by PCR array post preHematoMiR treatments. Murine bone marrow derived Lineage negative (Lin-) cells treated with preHematoMiRs (10 μM) and gene expression level of HSC quiescence regulators analyzed with PCR array. A preHematoMiR-2, (B preHematoMiR-5. See Figure S1 for additional data. preHematoMiR: precursor HematoMiR
Fig. 3
Fig. 3
Gene expression analysis of negative regulators of cell cycle post preHematoMiR treatments. Murine bone marrow derived Lin-cells treated with preHematoMiRs (10 μM) and gene expression level of cyclin dependent kinase inhibitors (CDKIs) analyzed with PCR array. A preHematoMiR-1, B preHematoMiR-2, C preHematoMiR-3, D preHematoMiR-4, E preHematoMiR-5, F preHematoMiR-6, G preHematoMiR-7, H preHematoMiR-8. Note that preHematoMiR-2 and preHematoMiR-5 broadly down regulated negative regulators of cell cycle
Fig. 4
Fig. 4
Murine HSPC content analysis post preHematoMiR and HematoMiR treatments. Murine bone marrow derived Lin-cells were treated with preHematoMiR (#1–8) and HematoMiR treatments (1 µM). Scrambled oligos were used as a control. Percentage of A Representative flow plots, B c-Kit + , C Sca-1 + , D LSK (LinSca-1+c-Kit+), E LSKCD34low cell population were analyzed by flow cytometer post 5 days of treatments. 30,000 events were recorded for analysis within initially displayed gate on the SSC/FSC color density plots. *p < 0.05, **p < 0.01. n = 3. HMiR, HematoMiR
Fig. 5
Fig. 5
Murine HSC/progenitor cells fate analysis of preHematoMiR and HematoMiR treatments. Murine bone marrow derived Lin- cells were treated with preHematoMiR and HematoMiR treatments (1 µM). A Gating strategy of flow cytometer analysis. Percentage of B Short-term Hematopoietic stem cells and Multi-potent progenitors (ST-HSCs and MPPs), C Myeloid progenitors, D Common myeloid progenitors (CMPs) and granulocyte–macrophage progenitors (GMPs), E Lin-cKitlowSca-1low cell population and F Common lymphoid progenitors (CLP) were analyzed by flow cytometer post 5 days of treatment. 30,000 events were recorded for analysis within initially displayed gate on the SSC/FSC color density plots. Scrambled oligos were used as a control. *p < 0.05, **p < 0.01. n = 3
Fig. 6
Fig. 6
Cell cycle and apoptosis analysis of HematoMiR treated HSPCs. FACS sorted murine LSK cells (HSPCs) were treated with HematoMiR-1, HematoMiR-2, HematoMiR-5 and HematoMiR-8 (1 μM) and control. After 4 days, Hoechst 33,342 and Pyronin Y staining were analyzed with flow cytometry. A Corresponding flow cytometry plots. B Quantification of cell cycle status of murine HSPCs at G0, G1 and S/G2/M phase of cell cycle. FACS sorted murine HSPCs were treated with HematoMiRs and analyzed for the extend of apoptosis post three days. Murine HSPCs were examined as early apoptotic, late apoptotic and necrotic followed by staining with Annexin V-FITC and PI. C Flow cytometry plots for apoptosis analysis. D Quantification of apoptotic cell types. n = 3. 5,000 events were recorded for flow cytometry analysis within initially displayed gate on the SSC/FSC color density plots **p < 0.01
Fig. 7
Fig. 7
Analysis of cellular ROS content, cellular ATP content, DNA damage and apoptotic marker analysis post HematoMiRs treatments. Bone marrow derived murine Lin- cells treated with HMiR-1, HMiR-2, HMiR-5 and HMiR-8 and control (1 μM/each). After 5 days, ROS assay was analyzed by flow cytometry. A Quantification of mean fluorescence intensity (MFI) of DCF fluorescence. B Quantification of ATP content post treatments. Data were normalized to cell count. DNA Damage and apoptosis analysis of HematoMiR treatments on murine HSPCs. Quantification and representative flow plots of C BrdU + PARP + population, D H2AX + PARP + population, E H2AX + BrdU + population post treatment of HematoMiRs. *p < 0.05, **p < 0.01. n = 3. 30,000 events were recorded for analysis within initially displayed gate on the SSC/FSC color density plots. ROS, reactive oxygen species; DCF, 2’,7’–dichlorofluorescein; THBP, Tert-Butyl Hydrogen Peroxide; BrdU, Bromodeoxyuridine; PARP, Poly(ADP-Ribose) polymerase. n = 3, *p < 0.05, **p < 0.01
Fig. 8
Fig. 8
Analysis of ex vivo and in vivo functionality of HematoMiR expanded murine HSCs. Bone marrow derived murine Lin- cells treated with HematoMiR-1, HematoMiR-2, HematoMiR-5 and HematoMiR-8 (1 μM) and control for 5 days. CFU assay was performed using methylcellulose-based medium supplemented with recombinant cytokines. After 10–14 days, the number of colonies was quantified according to their distinct morphologies and classified as A Colony-forming unit-granulocyte, erythroid, macrophage, megakaryocyte (CFU-GEMM), B Colony-forming unit-granulocyte, macrophage (CFU-GM), colony-forming unit-granulocyte (CFU-G), colony-forming unit-macrophage (CFU-M) as CFU-GM/G/M and C burst-forming unit-erythroid (CFU-BFU-E) colonies. Note that HematoMiR-5 treatment yielded increased GEMM colonies. D Distribution of colonies. E Schematic representation of the engraftment and repopulation analysis of HematoMiR-5 expanded HSCs. CD45.2 + HSCs were transplanted into CD45.1 + NOD/SCID animals and analyzed by flow cytometry for the engraftment and repopulation of blood linages post 4 months. F Representative flow cytometry plots, and percent of CD45.2 + cells in the recipient mouse peripheral blood, G Percentages of repopulating blood lineages gated in CD45.2 + cells. H Distribution of cells in CD45.2 + cells. For flow cytometry analysis, 1,000,000 events were recorded within initially displayed gate on the SSC/FSC color density plots. n = 3. *p < 0.5, **p < 0.01
Fig. 9
Fig. 9
Analysis of Human HSCs content post proHematoMiR and HematoMiR treatments. Bone marrow derived MNCs treated with preHematoMiRs and HematoMiRs (1 μM) for 5 days. Determination of HSC content of human BM MNC samples by flow cytometer post treatments are done by analyzing A CD34 + cells, B CD90 + cells, C CD133 + , D CD34 + CD90 + CD133 + cells, E CD34 + CD38-, F CD34 + C133 + CD90 + CD38-. n = 3. 30,000 events were recorded for analysis within initially displayed gate on the SSC/FSC color density plots. BM bone marrow. MNCs mononuclear cells. *p < 0.05, **p < 0.01
Fig. 10
Fig. 10
HSC content analysis post HematoMiR mixture treatments. Bone marrow derived murine Lin- cells treated with different HematoMiR mixture combinations (0.5 μM) and each HematoMiR alone (0.5 μM) as well as control for 5 days. Analysis of percentage of Sca1 + , c-Kit + Hematopoietic Progenitors, LSK and LSKCD150 + (slam marker) LSKCD34low HSCs were done by flow cytometry post 5 days of HematoMiR mixtures. We show that removal of several HematoMiRs from the whole HematoMiR mixture (HM-Mix, including all 8 HematoMiRs) lead to higher percentage of A c-Kit + , B Sca1 + , Hematopoietic Progenitors, C LSK and D LSKCD34low HSCs. Arrows indicates HematoMiRs, which were necessary for higher HSC induction. E Representative flow cytometry plots of LSK cell population for HMiR-Mix combination. F Quantification of c-Kit+ cells, G Sca1+ cells, H LSK, I LSKCD150+ (slam marker), and J LSKCD34low HSCs percentage. 30,000 events were recorded for analysis within initially displayed gate on the SSC/FSC color density plots. *p < 0.05, **p < 0.01. n = 3
Fig. 11
Fig. 11
Cell cycle and apoptosis analysis of HSCs treated with different HematoMiR combinations. Cell cycle analysis of FACS sorted murine LSK cells treated respectively with mixture of eight HematoMiRs (HMiR-Mix All), selected three HematoMiRs (HMiR-Mix 2, 5, 1), different binary combination of these selected three of them and each HematoMiR alone with the concentration of 0.5 μM and analyzed post 3 days by staining with Hoechst 33,342 and Pyronin Y. A Corresponding flow cytometry plots and B quantification of cell cycle status of murine HSCs, which were examined as G0, G1 and S/G2/M phase of cell cycle. FACS sorted murine HSCs are treated with different combination of HematoMiRs (0.5 μM) and analyzed extend of apoptosis post three days. Murine HSCs were examined as early apoptotic, late apoptotic and necrotic followed by staining with Annexin V-FITC and PI. C Flow cytometry plots and D quantification of apoptotic cell types. For flow cytometry analysis, 5,000 events were recorded within initially displayed gate on the SSC/FSC color density plots. *p < 0.05, **p < 0.01. n = 3
Fig. 12
Fig. 12
Colony-forming assay for selected HematoMiR combinations. Bone marrow derived murine Lin- cells were treated with different combination of HematoMiRs (0.5 μM) and control oligos for 5 days and cultured with specific methylcellulose medium (Methocult GF M3434) for CFU assay. After 10–14 days, the number of colonies were quantified and morphologies were analyzed as A CFU-GEMM, B CFU-G/M/GM, and C BFU-E colonies, D Distribution of colonies. *p < 0.05, **p < 0.01. n = 3
Fig. 13
Fig. 13
Engraftment and repopulation analysis of HSCs expanded with HMiR-Mix 2&5 combination. CD45.2 + HSCs are transplanted into CD45.1 + NOD/SCID animals and analyzed by flow cytometry for the engraftment and repopulation of blood linages. A Schematic representation of ex vivo HSC expansion, B Representative flow cytometry plots, and quantification of CD45.2 + CD45.1-cells population in the recipient mouse peripheral blood, C Quantification of repopulation assay of blood lineages in CD45.2 + gated cells. For flow cytometry analysis, 1,000,000 events were recorded within initially displayed gate on the SSC/FSC color density plots. n = 3. *p < 0.05

Similar articles

References

    1. Yucel D, Kocabas F. Developments in hematopoietic stem cell expansion and gene editing technologies. Adv Exp Med Biol. 2017;1079:103–125. doi: 10.1007/5584_2017_114. - DOI - PubMed
    1. Iscove NN, Nawa K. Hematopoietic stem cells expand during serial transplantation in vivo without apparent exhaustion. Curr Biol. 1997;7:805–808. doi: 10.1016/S0960-9822(06)00341-1. - DOI - PubMed
    1. Matatall KA, et al. Chronic infection depletes hematopoietic stem cells through stress-induced terminal differentiation. Cell Rep. 2016;17:2584–2595. doi: 10.1016/j.celrep.2016.11.031. - DOI - PMC - PubMed
    1. Pawliuk R, Eaves C, Humphries RK. Evidence of both ontogeny and transplant dose-regulated expansion of hematopoietic stem cells in vivo. Blood. 1996;88:2852–2858. doi: 10.1182/blood.V88.8.2852.bloodjournal8882852. - DOI - PubMed
    1. Jansen J, Hanks S, Thompson JM, Dugan MJ, Akard LP. Transplantation of hematopoietic stem cells from the peripheral blood. J Cell Mol Med. 2005;9:37–50. doi: 10.1111/j.1582-4934.2005.tb00335.x. - DOI - PMC - PubMed