. 2022 Jan 12;30(1):124-138.e8.
doi: 10.1016/j.chom.2021.12.003. Epub 2021 Dec 30.

The Mouse Gastrointestinal Bacteria Catalogue enables translation between the mouse and human gut microbiotas via functional mapping

Affiliations

The Mouse Gastrointestinal Bacteria Catalogue enables translation between the mouse and human gut microbiotas via functional mapping

Benjamin S Beresford-Jones et al. Cell Host Microbe. .

Abstract

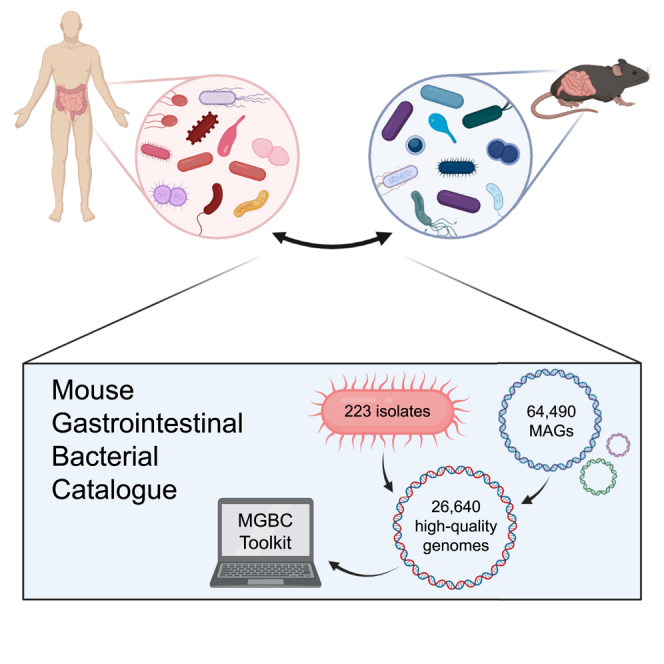
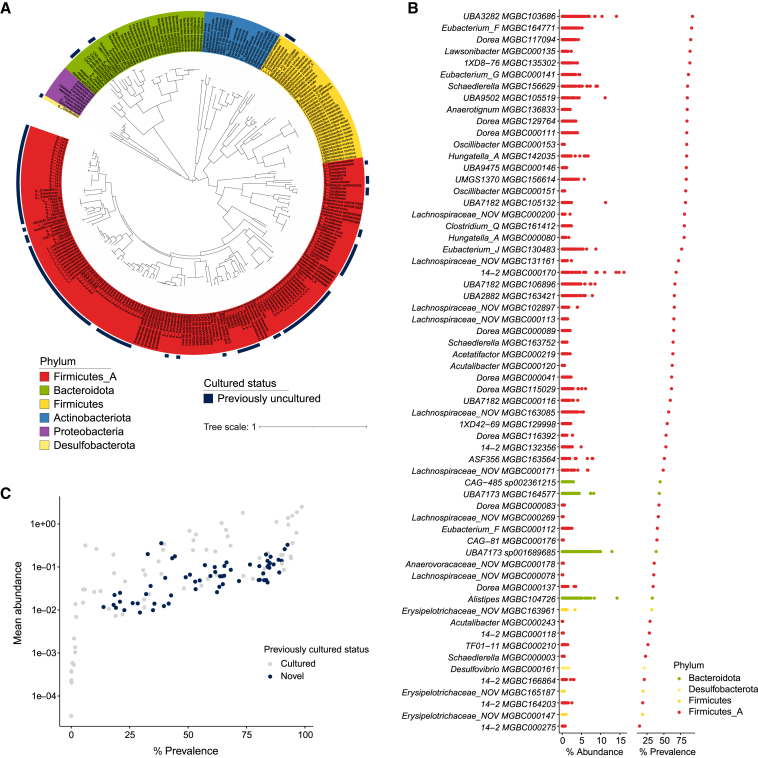
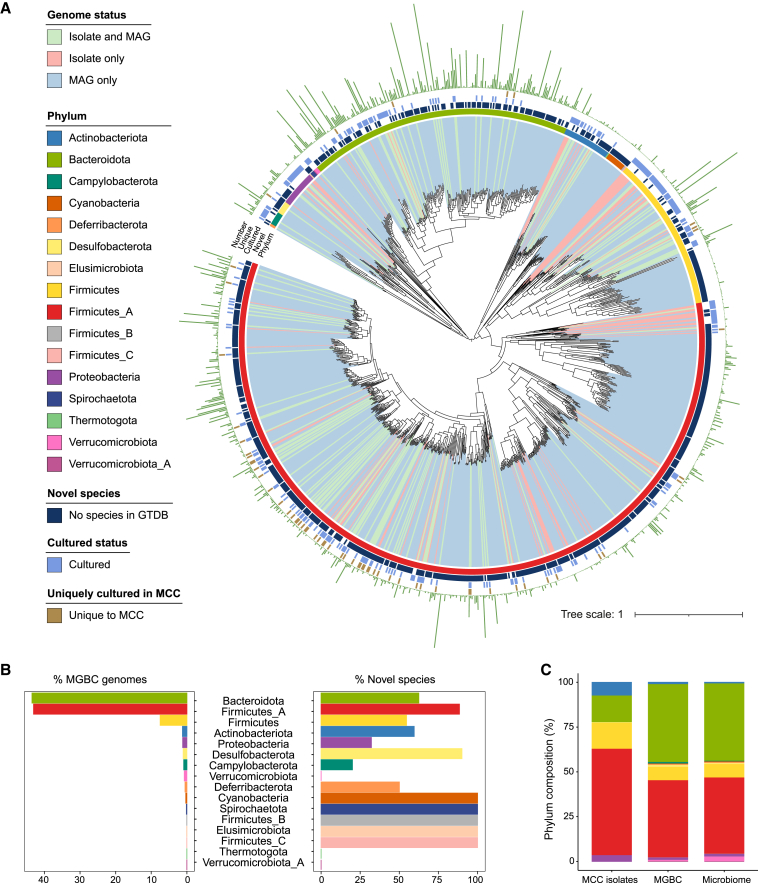
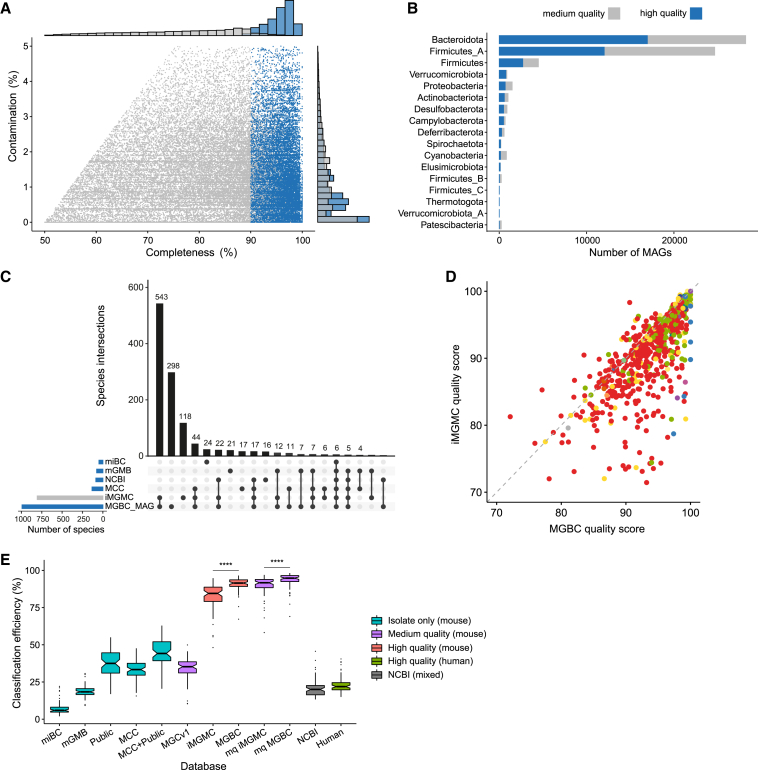
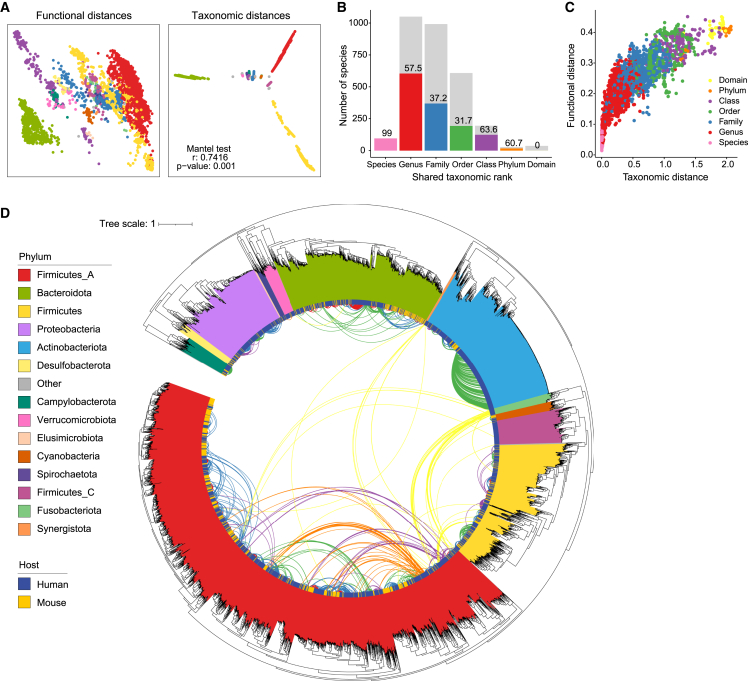
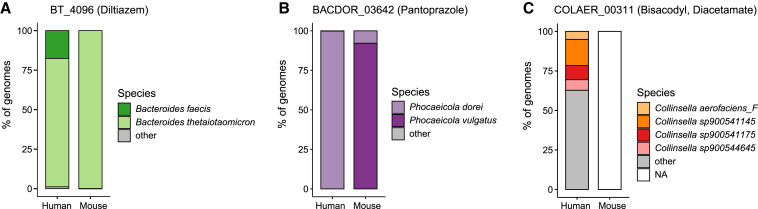
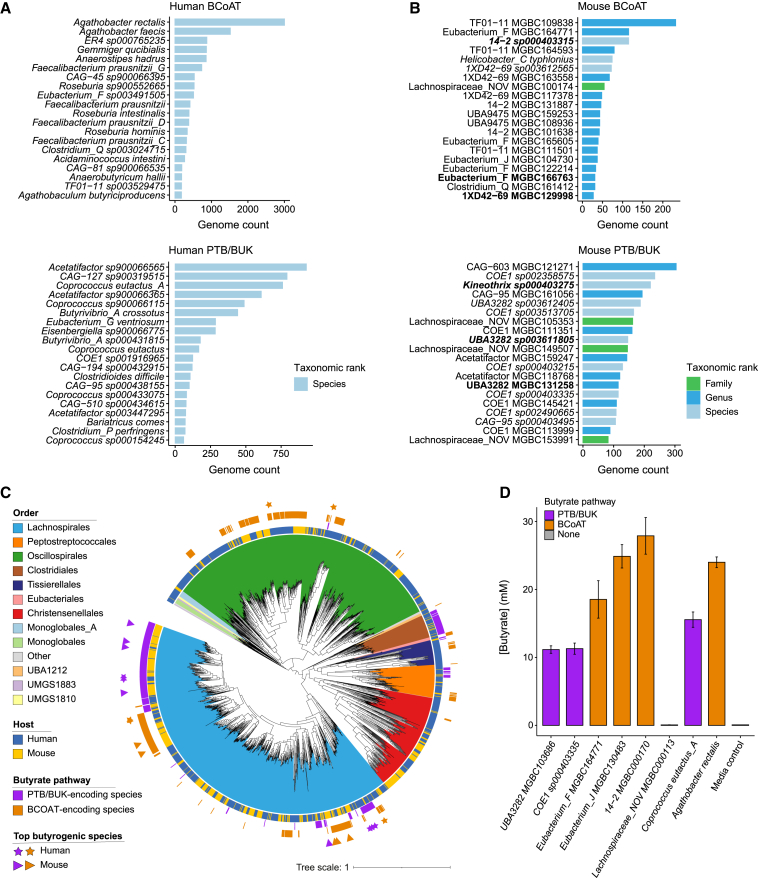
Human health and disease have increasingly been shown to be impacted by the gut microbiota, and mouse models are essential for investigating these effects. However, the compositions of human and mouse gut microbiotas are distinct, limiting translation of microbiota research between these hosts. To address this, we constructed the Mouse Gastrointestinal Bacteria Catalogue (MGBC), a repository of 26,640 high-quality mouse microbiota-derived bacterial genomes. This catalog enables species-level analyses for mapping functions of interest and identifying functionally equivalent taxa between the microbiotas of humans and mice. We have complemented this with a publicly deposited collection of 223 bacterial isolates, including 62 previously uncultured species, to facilitate experimental investigation of individual commensal bacteria functions in vitro and in vivo. Together, these resources provide the ability to identify and test functionally equivalent members of the host-specific gut microbiotas of humans and mice and support the informed use of mouse models in human microbiota research.

Keywords: bacteria culture collection; butyrate; commensal bacteria; functionally equivalent species; gut microbiota; microbial drug metabolism; mouse gut metagenomes; mouse models; public database; translation between mouse and human.


Conflict of interest statement

Declaration of interests T.D.L. is a founder and CSO of Microbiotica. The other authors declare no competinginterests.

Figures

None
Graphical abstract
Figure 1
Figure 1
Isolates of the mouse culture collection (A) Maximum likelihood phylogenetic tree of the 276 bacterial isolate genomes of the MCC. Genome labels indicate genome taxon as assigned by GTDB-Tk; where a genome could not be assigned at species level, lowest taxonomic rank is indicated. Labels are colored by phylum, and the outer ring indicates genomes with no previously cultured representative. Tree distances were calculated from an alignment of 120 core genes using the BLOSUM45 amino acid similarity matrix. (B) Abundance and prevalence profiles for the 62 previously uncultured species of the MCC based on 2,446 mouse gut metagenomes. Each datapoint represents the percentage of reads assigned to a species for a single sample. Prevalence is calculated as the percentage of samples with species abundance ≥0.01%. Colors represent phyla. (C) Scatterplot of mean abundance against prevalence for all 132 species of the MCC. Color represents prior cultured status.
Figure 2
Figure 2
Genomes of the Mouse Gastrointestinal Bacteria Catalogue (A) Maximum likelihood tree of representative genomes for the 1,094 species of the MGBC. Color range indicates whether a species cluster is represented by MAGs only (light red), isolates only (light green), or both (light blue). For each species, the innermost color ring represents phylum, the second ring indicates species that could not be assigned at a species level by GTDB-Tk (dark blue), the third ring denotes cultured status of each species (blue), and the outer ring indicates the 62 species that have been uniquely cultured in the MCC (brown). The circumferential bar plot (green) illustrates the number of high-quality genomes representing each species in the MGBC. Tree distances were calculated from an alignment of 120 core genes using the BLOSUM45 amino acid similarity matrix. (B) Phylum-level distribution of the 26,640 high-quality genomes of the MGBC (left) and percentage of species clusters not assigned to a species-level taxonomy by GTDB-Tk (right). (C) Stacked bar plots comparing the phylum-level composition of the 276 MCC isolates (MCC isolates) and the 26,640 genomes of the MGBC with the average mouse microbiome (microbiome; n = 2,446). The distributions of each stacked bar were compared using a chi-square test for Independence. MCC, microbiome (p = 0.015, significantly different); MGBC, microbiome (p = 1, not significantly different).
Figure 3
Figure 3
Genome quality evaluation and benchmarking of the MGBC (A) Completeness and contamination of MAGs of the MGBC. Using a modified MIMAGs criteria, 26,640 MAGs were defined as high-quality (blue) (≥90% completeness, ≤5% contamination, metrics of genome fragmentation). Quality estimates were generated using CheckM. (B) Phylum-level distribution of high-quality and medium-plus MAGs. (C) Upset plot illustrating the intersections of species between the contributing isolate collections and MAGs of the MGBC (blue). The iMGMC has been included for comparison (gray). (D) Comparison of representative genome quality for shared species between the MGBC and iMGMC. Genome quality score: QS = Completeness − 5 × Contamination. Color represents phylum. (E) Read classification rates of 64 independent mouse gut metagenome samples using different custom Kraken2 databases. Box plot color indicates the origins of the genomes used to build each database. Only genomes meeting high-quality criteria were used to build databases, except where indicated (purple). miBC, n = 43; mGMB, n = 100; public (combination of all mouse gut-derived isolates from NCBI), n = 288; MCC, n = 276; MCC+public, n = 564; MGCv1, n = 239; iMGMC, n = 8,509; MGBC, n = 26,640; mq iMGMC, n = 18,306; mq MGBC, n = 65,907; NCBI (standard database), n = 97,603; human (representative genomes of the UHGG), n = 3,006. Significance was determined for selected comparisons using paired t tests, ∗∗∗∗p < 0.0001.
Figure 4
Figure 4
Taxonomy-function relationships between species of the human and mouse microbiotas For a Figure360 author presentation of this figure, see https://doi.org/10.1016/j.chom.2021.12.003. (A) Principal coordinate analyses for functional (left) and taxonomic (right) relationships between all species of human and mouse gut microbiota. Each data point represents a single species cluster, and point color denotes phylum. Functional analyses use Jaccard distances between pangenomic functional profiles of each species. Taxonomic distances represent phylogenetic branch lengths between species calculated from alignment of 120 core genes. Distance matrices used for ordination were compared using the Mantel test (r = 0.7416, p = 0.001). (B) Taxonomy-function relationships between human- and mouse-derived bacterial species, stratified by shared taxonomic level. Bars indicate distribution of shared taxonomic rank between closest taxonomically related species. Colored bars and bar statistics indicate number and percentage, respectively, of paired species at each rank where the closest functionally related species is the same taxon as the closest taxonomic relative. (C) Scatterplot comparing taxonomic distance with functional distance for each human-derived species and the closest taxonomically related mouse-derived species. Color indicates the shared taxonomic rank between these species. (D) Inverted maximum likelihood tree of the 4,100 species of the human and mouse gut microbiotas. External branches represent phylogenetic relationships between representative genome of each species. Internal connections illustrate closest functionally related species between hosts. Connections are only shown when the closest taxonomically and functionally related taxa differ. Clade color represents phylum of each species, and the inside color bar denotes the host. Color of internal connections indicates shared taxonomic rank of the closest functionally related species.
Figure 5
Figure 5
Taxonomic locations of drug metabolism genes between host microbiotas (A–C) Representative examples of taxonomic locations of drug metabolism genes between host microbiotas. Data illustrate the species-level contribution of genomes encoding the indicated drug metabolism gene (≥95% sequence identity). Genes and associated predicted functions are either (A) shared with a conserved taxonomic location, (B) shared with a different taxonomic location, or (C) not shared between hosts.
Figure 6
Figure 6
Identification and validation of butyrate-producing species between hosts (A and B) The most dominant butyrate-producing species of the human (A) and mouse (B) gut microbiotas, utilizing either the BCOAT (top) or PTB/BUK (bottom) pathways. Color indicates the lowest assigned taxonomic rank for each species by GTDB-Tk, either known species (light blue), novel species (dark blue), or novel genera (green). (C) Maximum likelihood tree of the representative genomes for species of the Firmicutes_A phylum. Color range represents the order-level taxonomy, and the innermost color bar denotes the host organism. The outer color bars indicate predicted butyrate-producing species using the BCOAT pathway (purple) or the PTB-BUK pathway (orange). The top 5 most dominant butyrogenic pathway encoding species for each host are marked with a colored triangle (mouse) or star (human). (D) Butyrate production by bacterial isolates in broth monoculture. Bar color indicates the encoded pathway for butyrate synthesis.

Similar articles

Cited by

References

    1. Aitchison J. On criteria for measures of compositional difference. Math. Geol. 1992;24:365–379. doi: 10.1007/BF00891269. - DOI
    1. Almeida A., Mitchell A.L., Boland M., Forster S.C., Gloor G.B., Tarkowska A., Lawley T.D., Finn R.D. A new genomic blueprint of the human gut microbiota. Nature. 2019;568:499–504. doi: 10.1038/s41586-019-0965-1. - DOI - PMC - PubMed
    1. Almeida A., Nayfach S., Boland M., Strozzi F., Beracochea M., Shi Z.J., Pollard K.S., Sakharova E., Parks D.H., Hugenholtz P., et al. A unified catalog of 204,938 reference genomes from the human gut microbiome. Nat. Biotechnol. 2021;39:105–114. doi: 10.1038/s41587-020-0603-3. - DOI - PMC - PubMed
    1. Alneberg J., Bjarnason B.S., de Bruijn I., Schirmer M., Quick J., Ijaz U.Z., Lahti L., Loman N.J., Andersson A.F., Quince C. Binning metagenomic contigs by coverage and composition. Nat. Methods. 2014;11:1144–1146. doi: 10.1038/nmeth.3103. - DOI - PubMed
    1. Aluthge N.D., Tom W.A., Bartenslager A.C., Burkey T.E., Miller P.S., Heath K.D., Kreikemeier-Bower C., Kittana H., Schmaltz R.J., Ramer-Tait A.E., Fernando S.C. Differential longitudinal establishment of human fecal bacterial communities in germ-free porcine and murine models. Commun. Biol. 2020;3:760. doi: 10.1038/s42003-020-01477-0. - DOI - PMC - PubMed

LinkOut - more resources