. 2022 Jan 10;40(1):53-69.e9.
doi: 10.1016/j.ccell.2021.12.005. Epub 2021 Dec 30.

GPC2-CAR T cells tuned for low antigen density mediate potent activity against neuroblastoma without toxicity

Affiliations

GPC2-CAR T cells tuned for low antigen density mediate potent activity against neuroblastoma without toxicity

Sabine Heitzeneder et al. Cancer Cell. .

Abstract

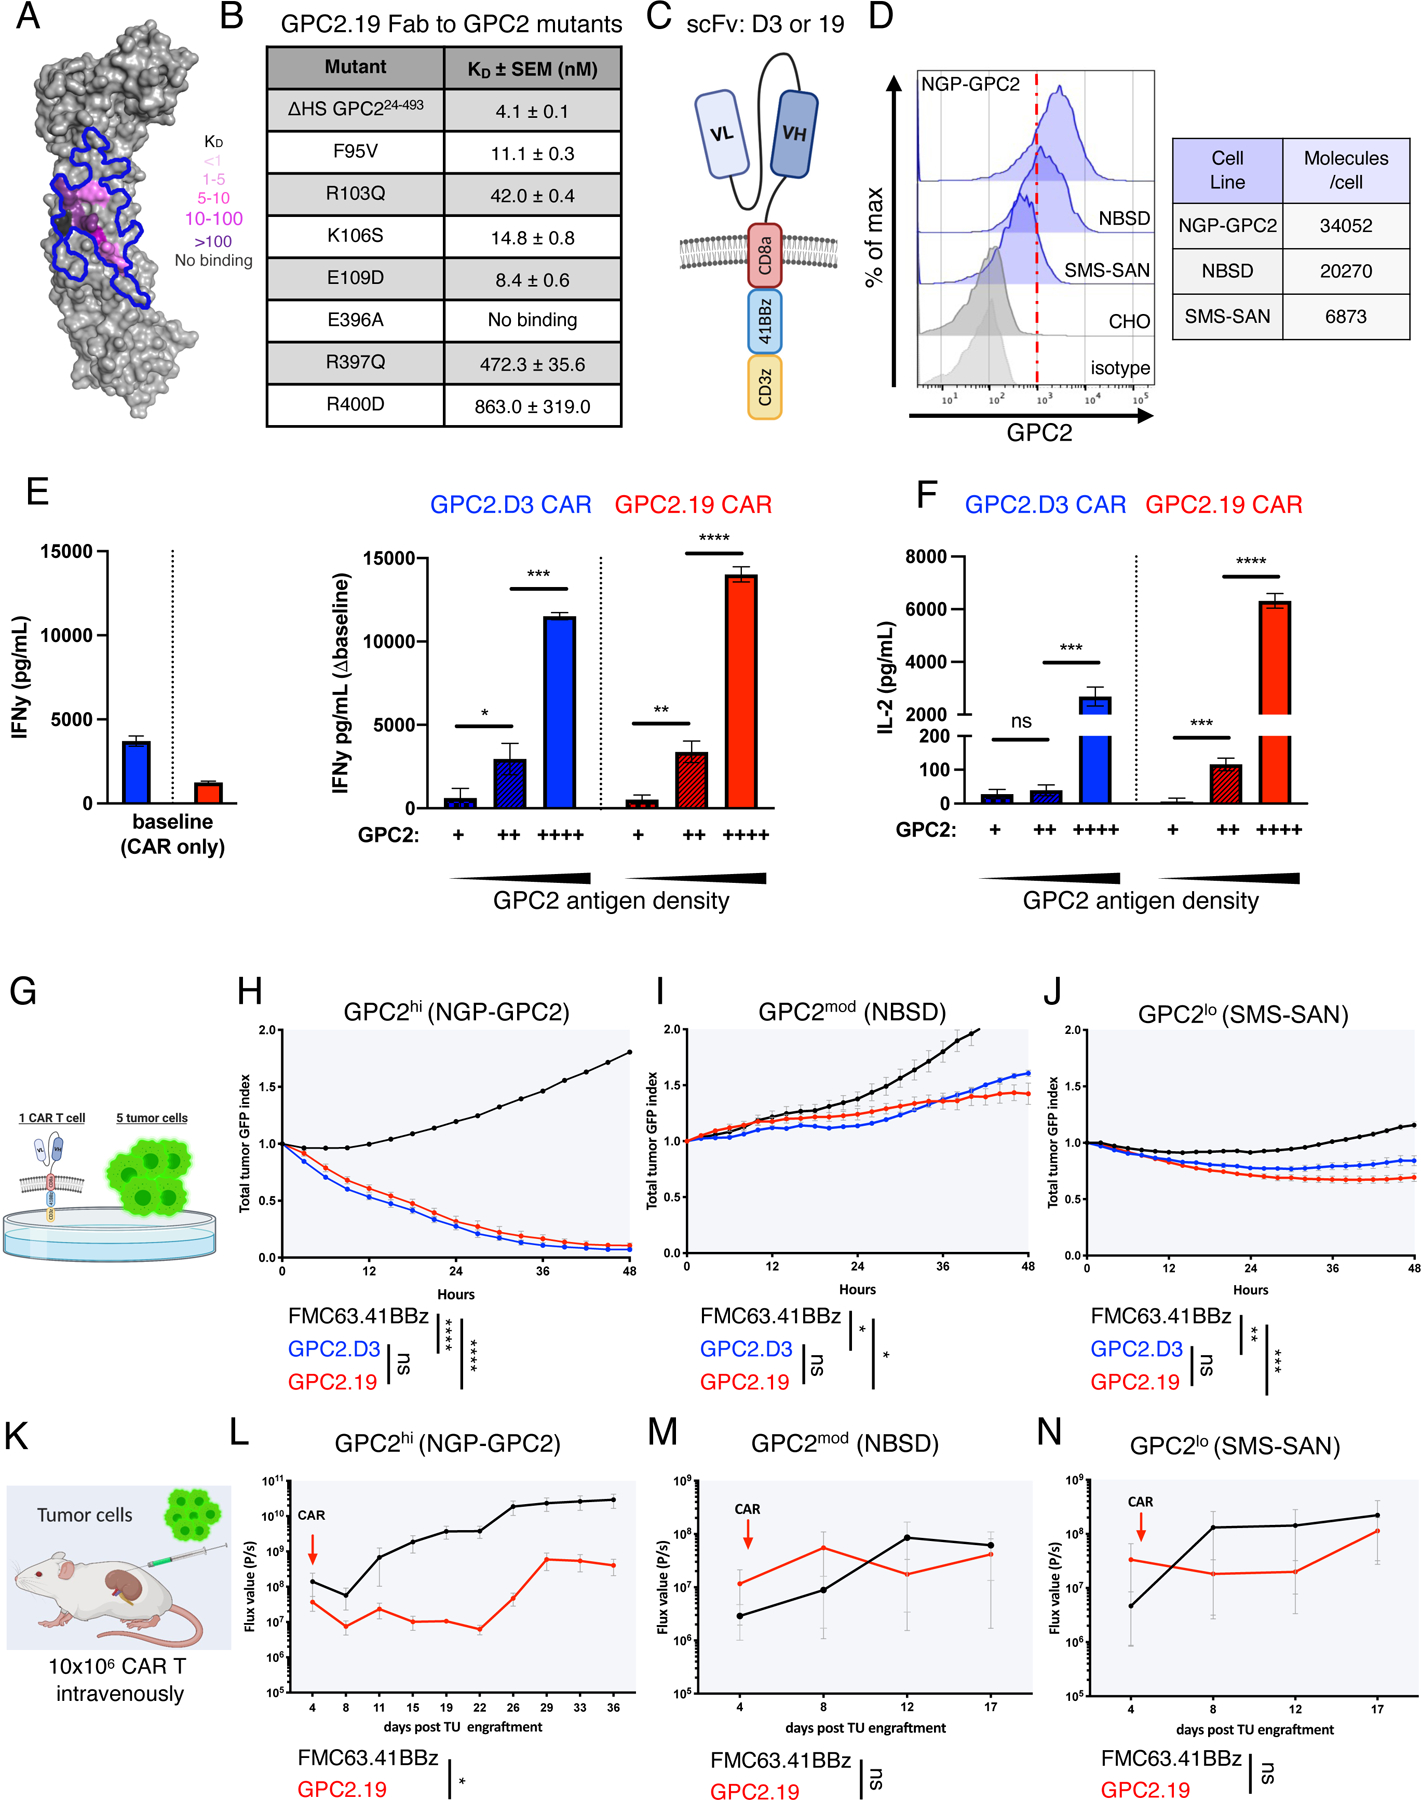
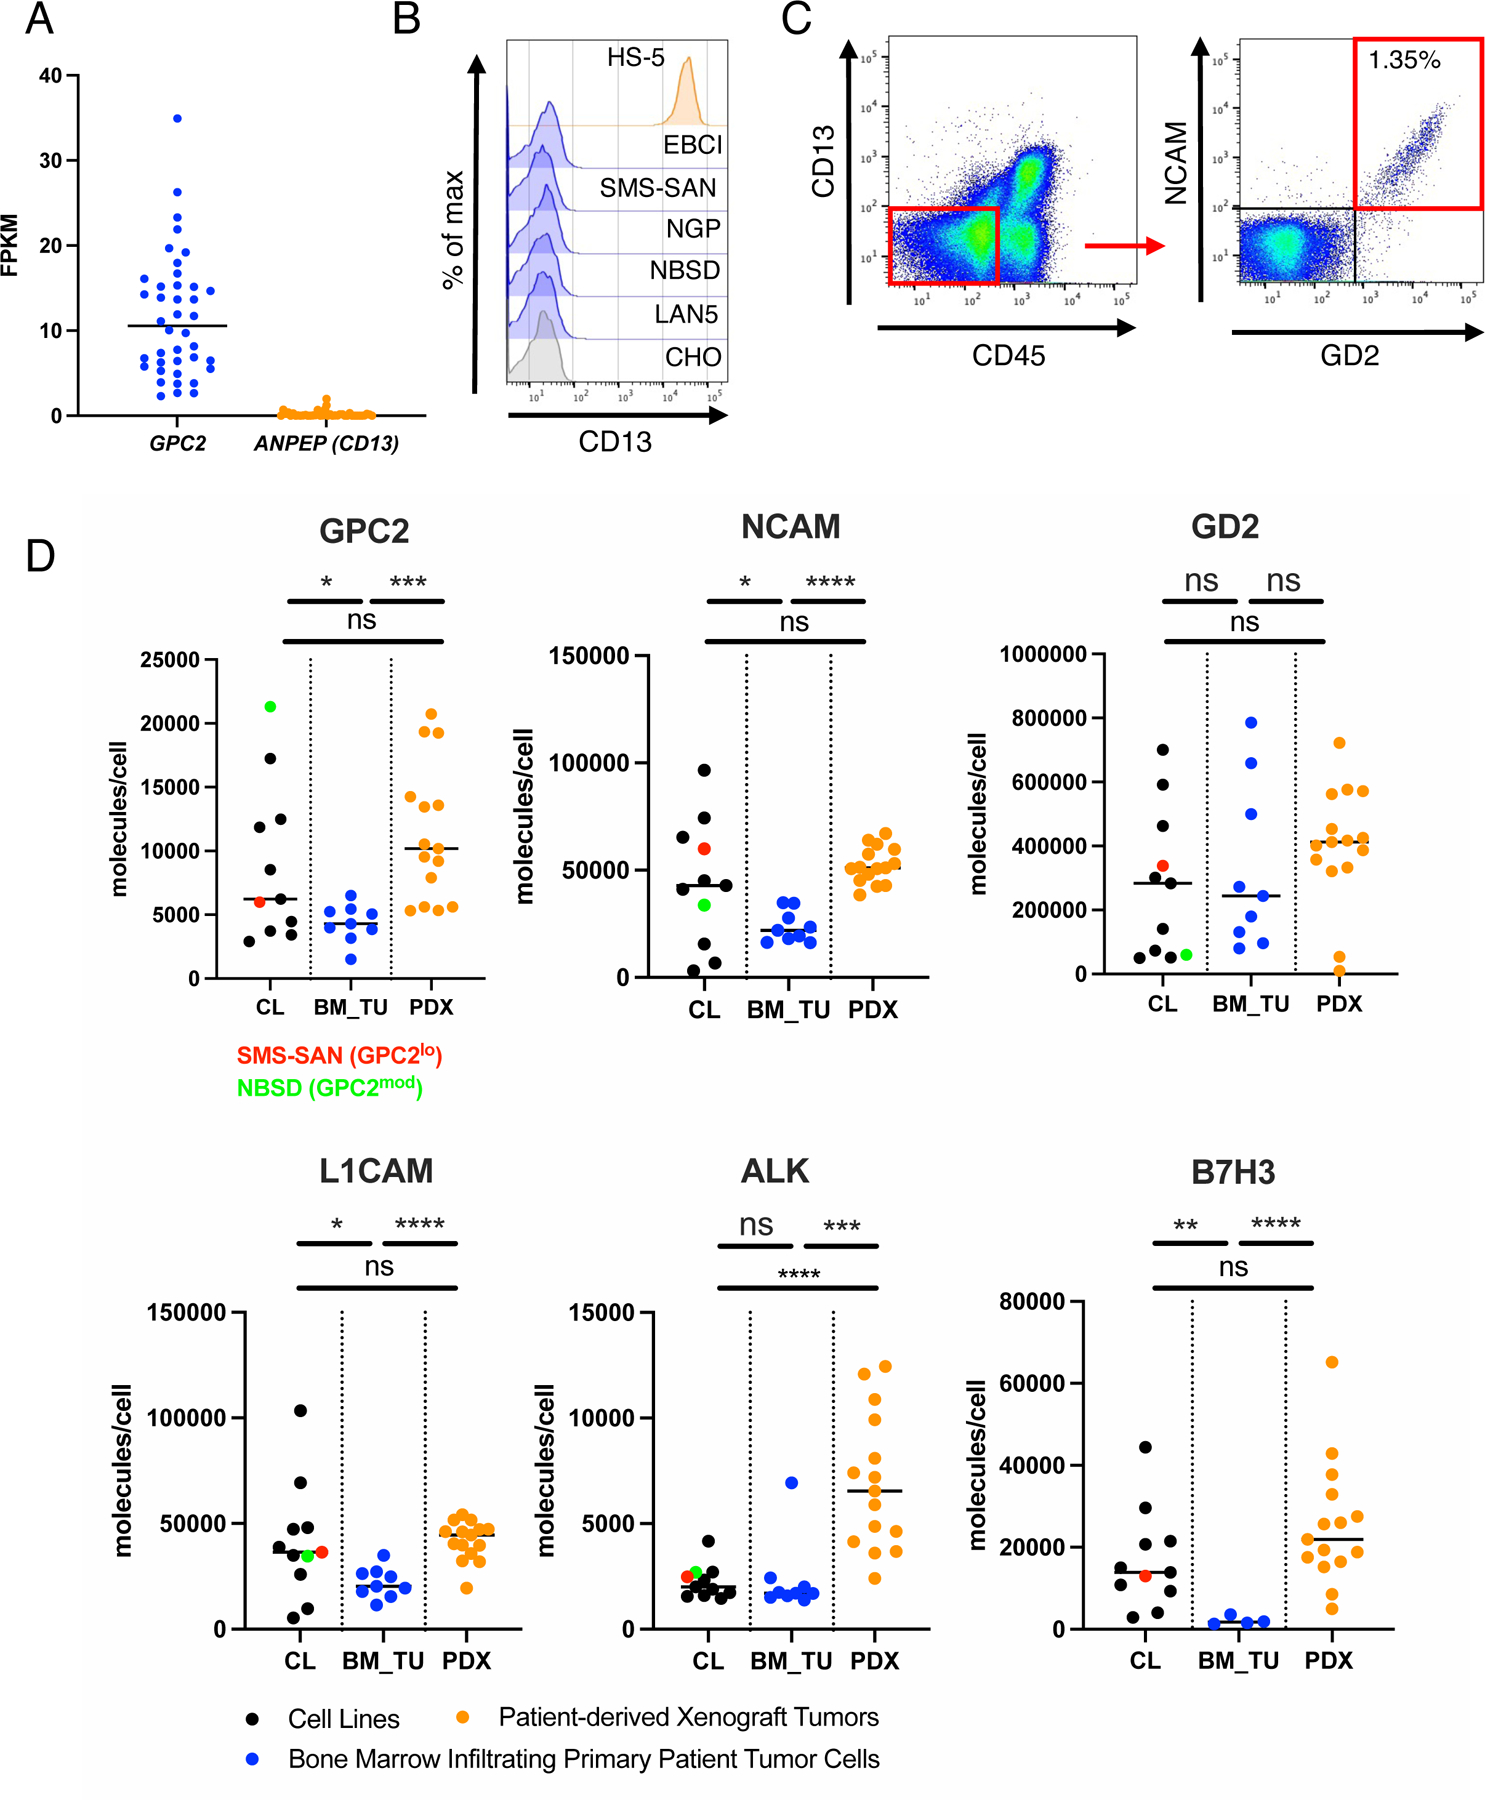
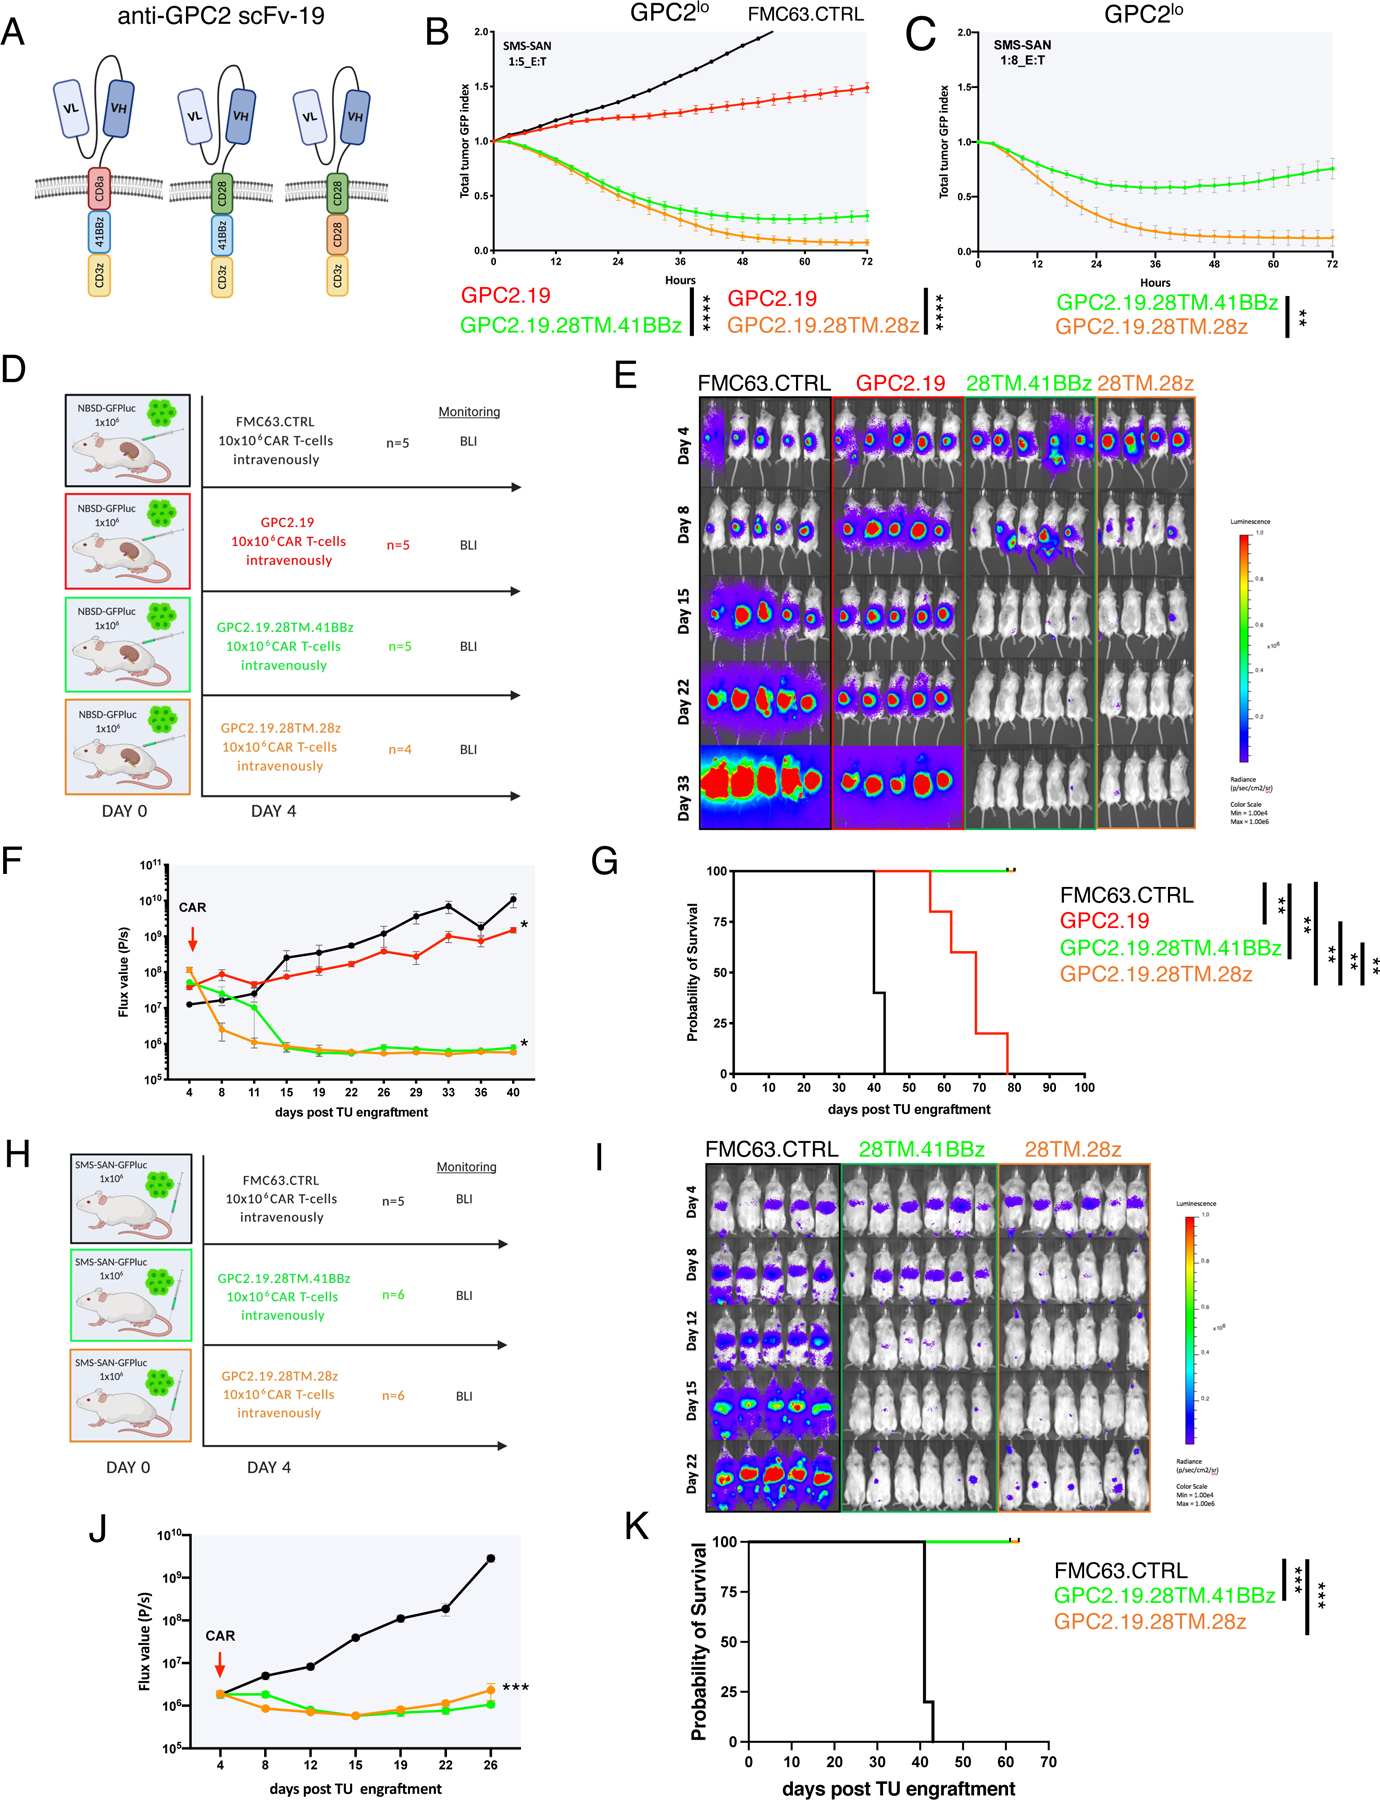
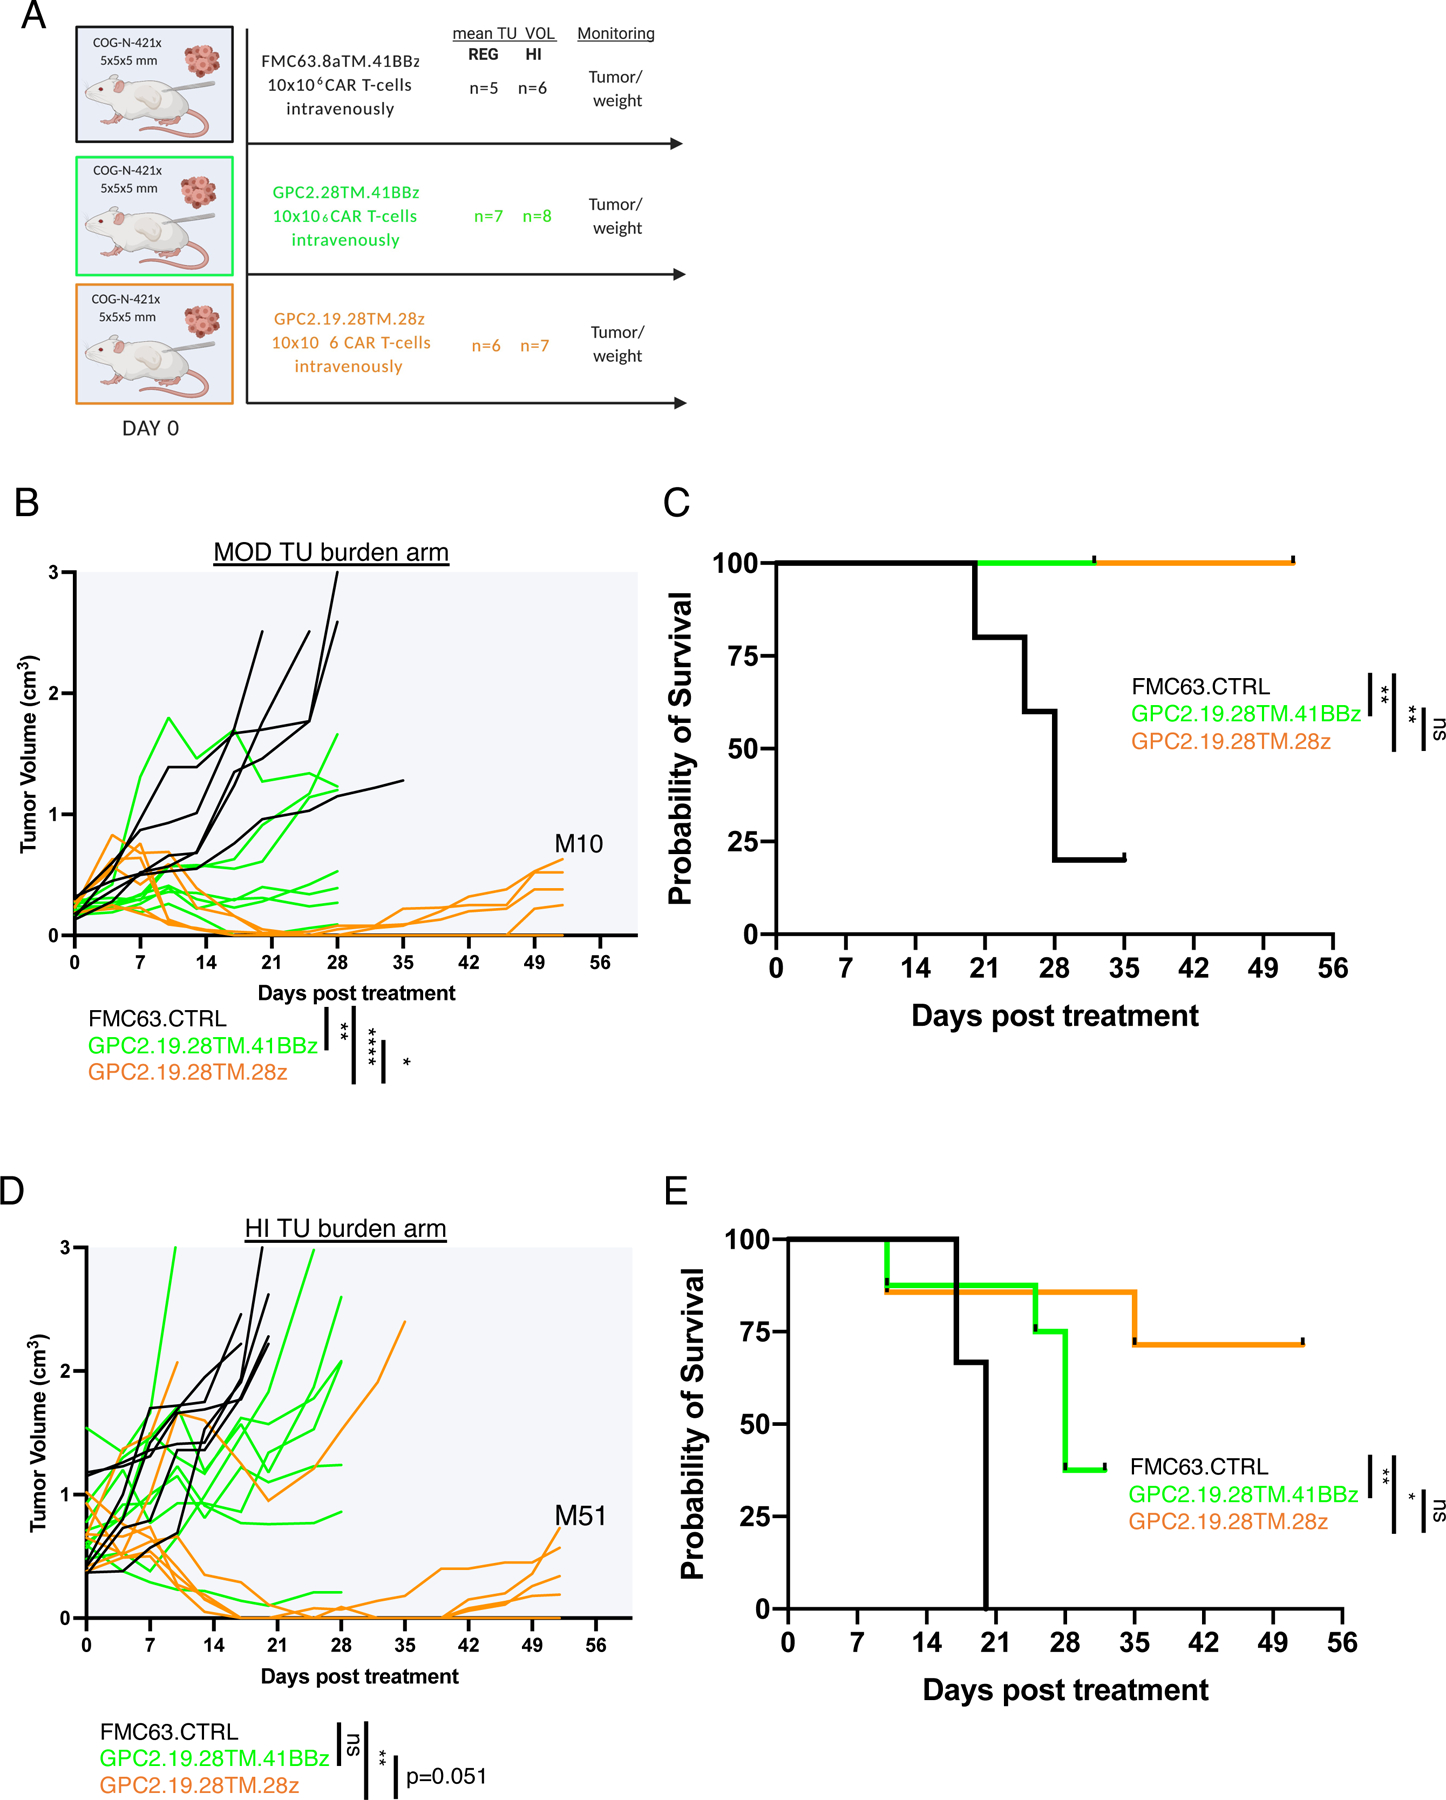
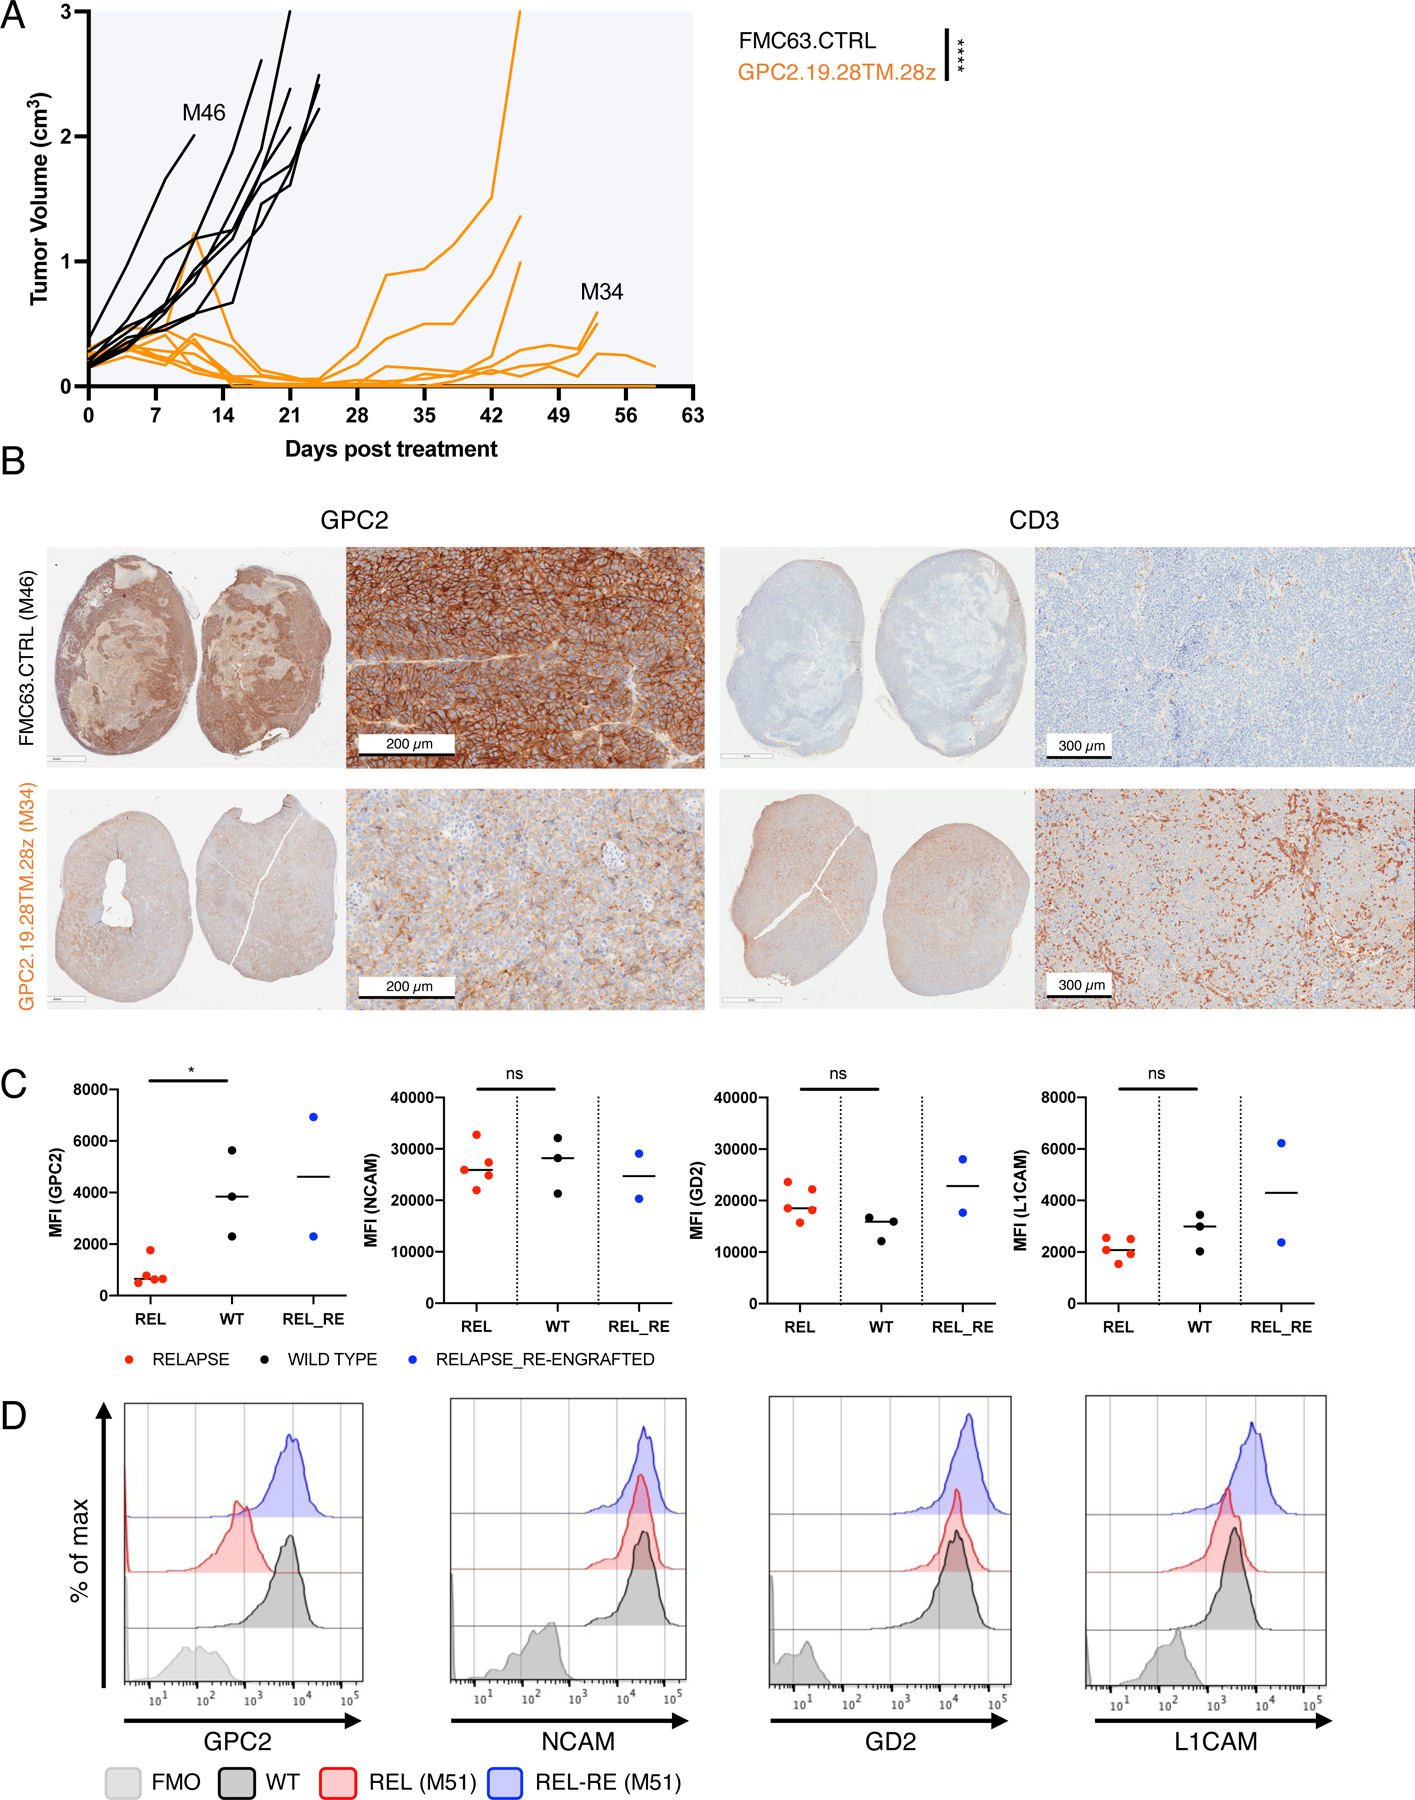
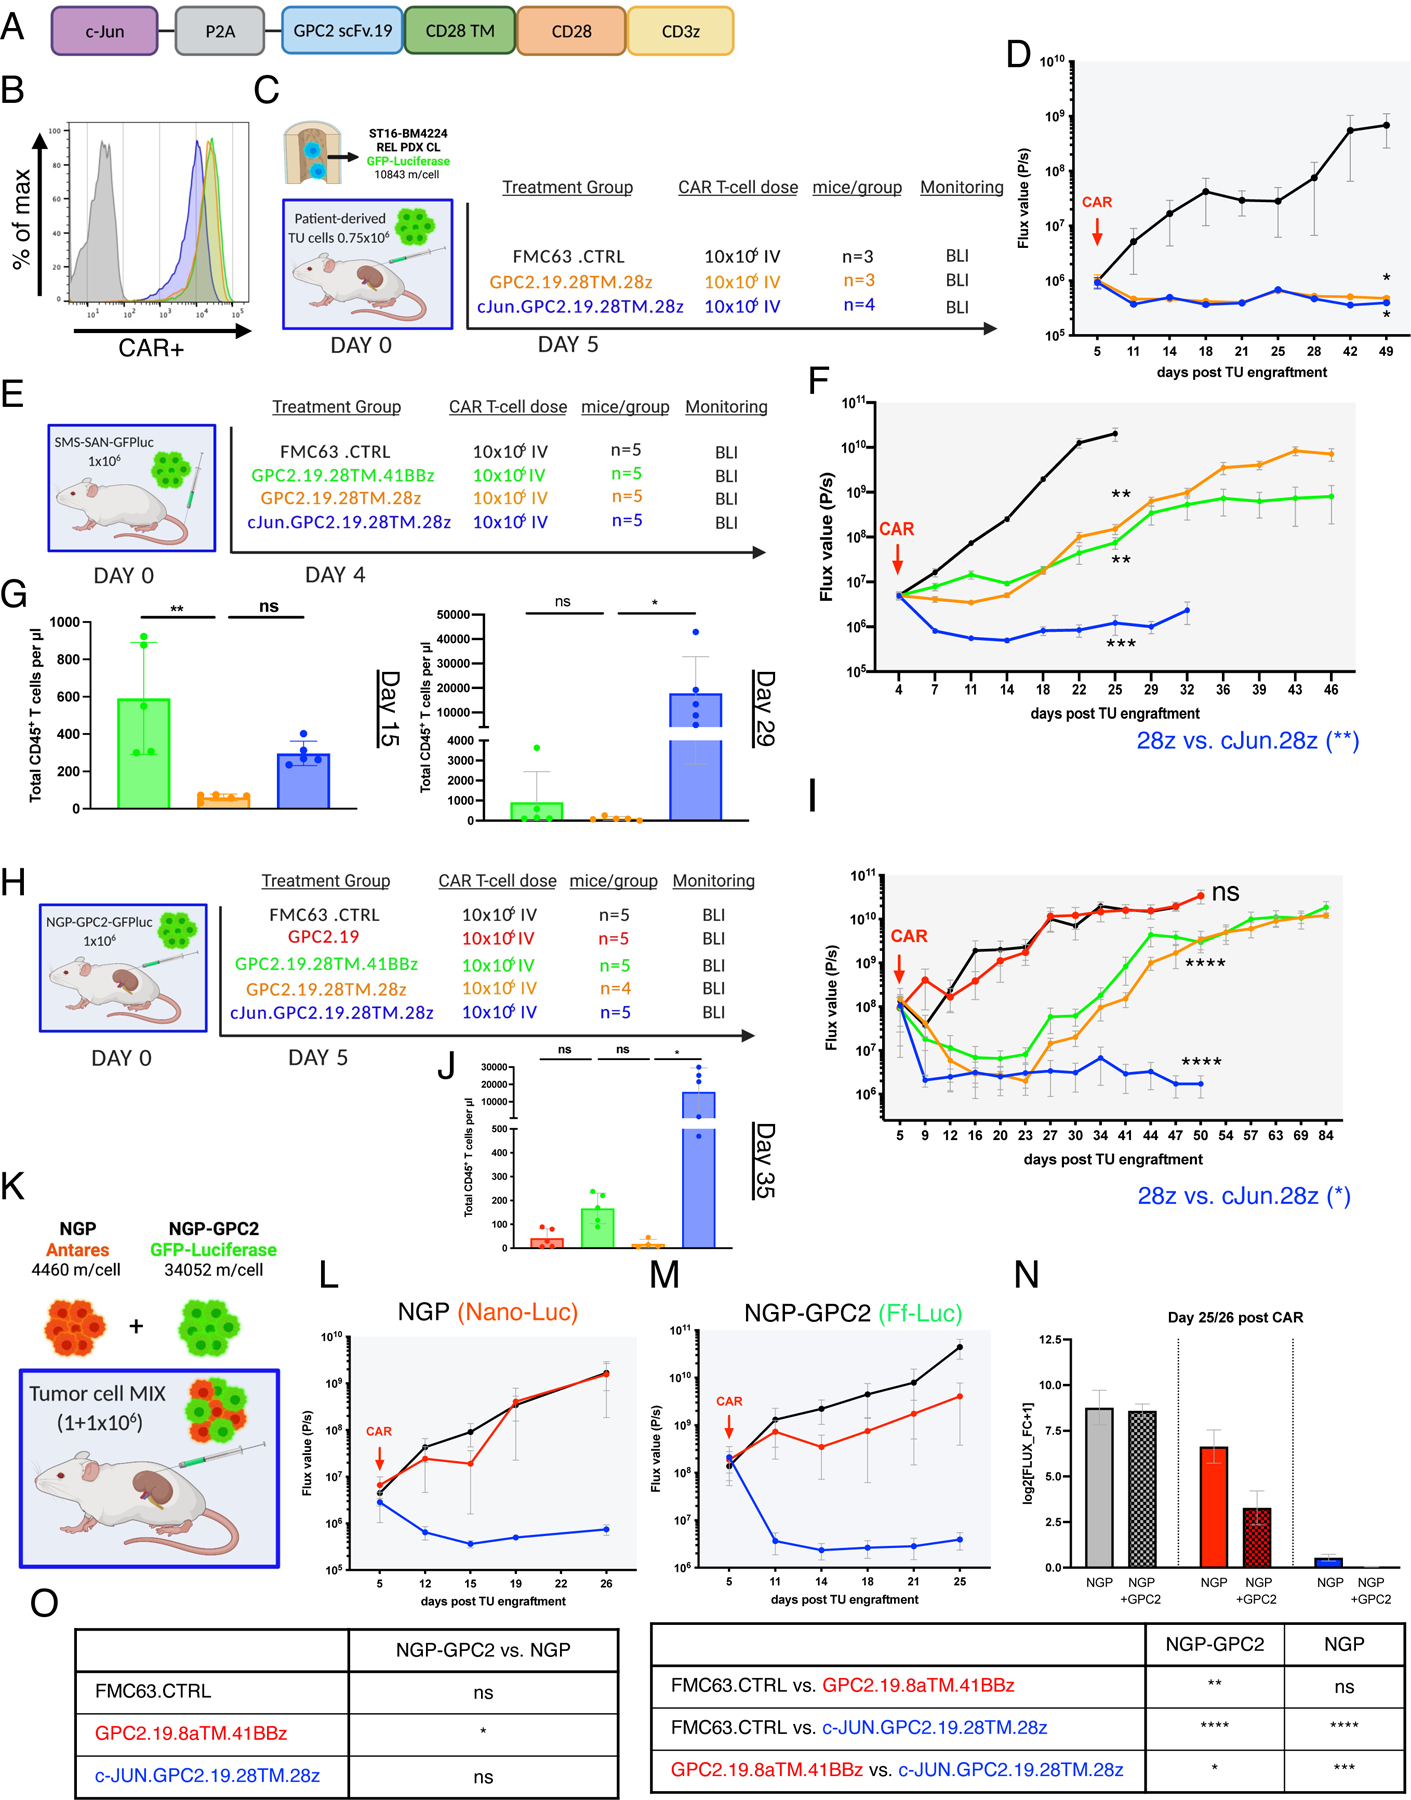
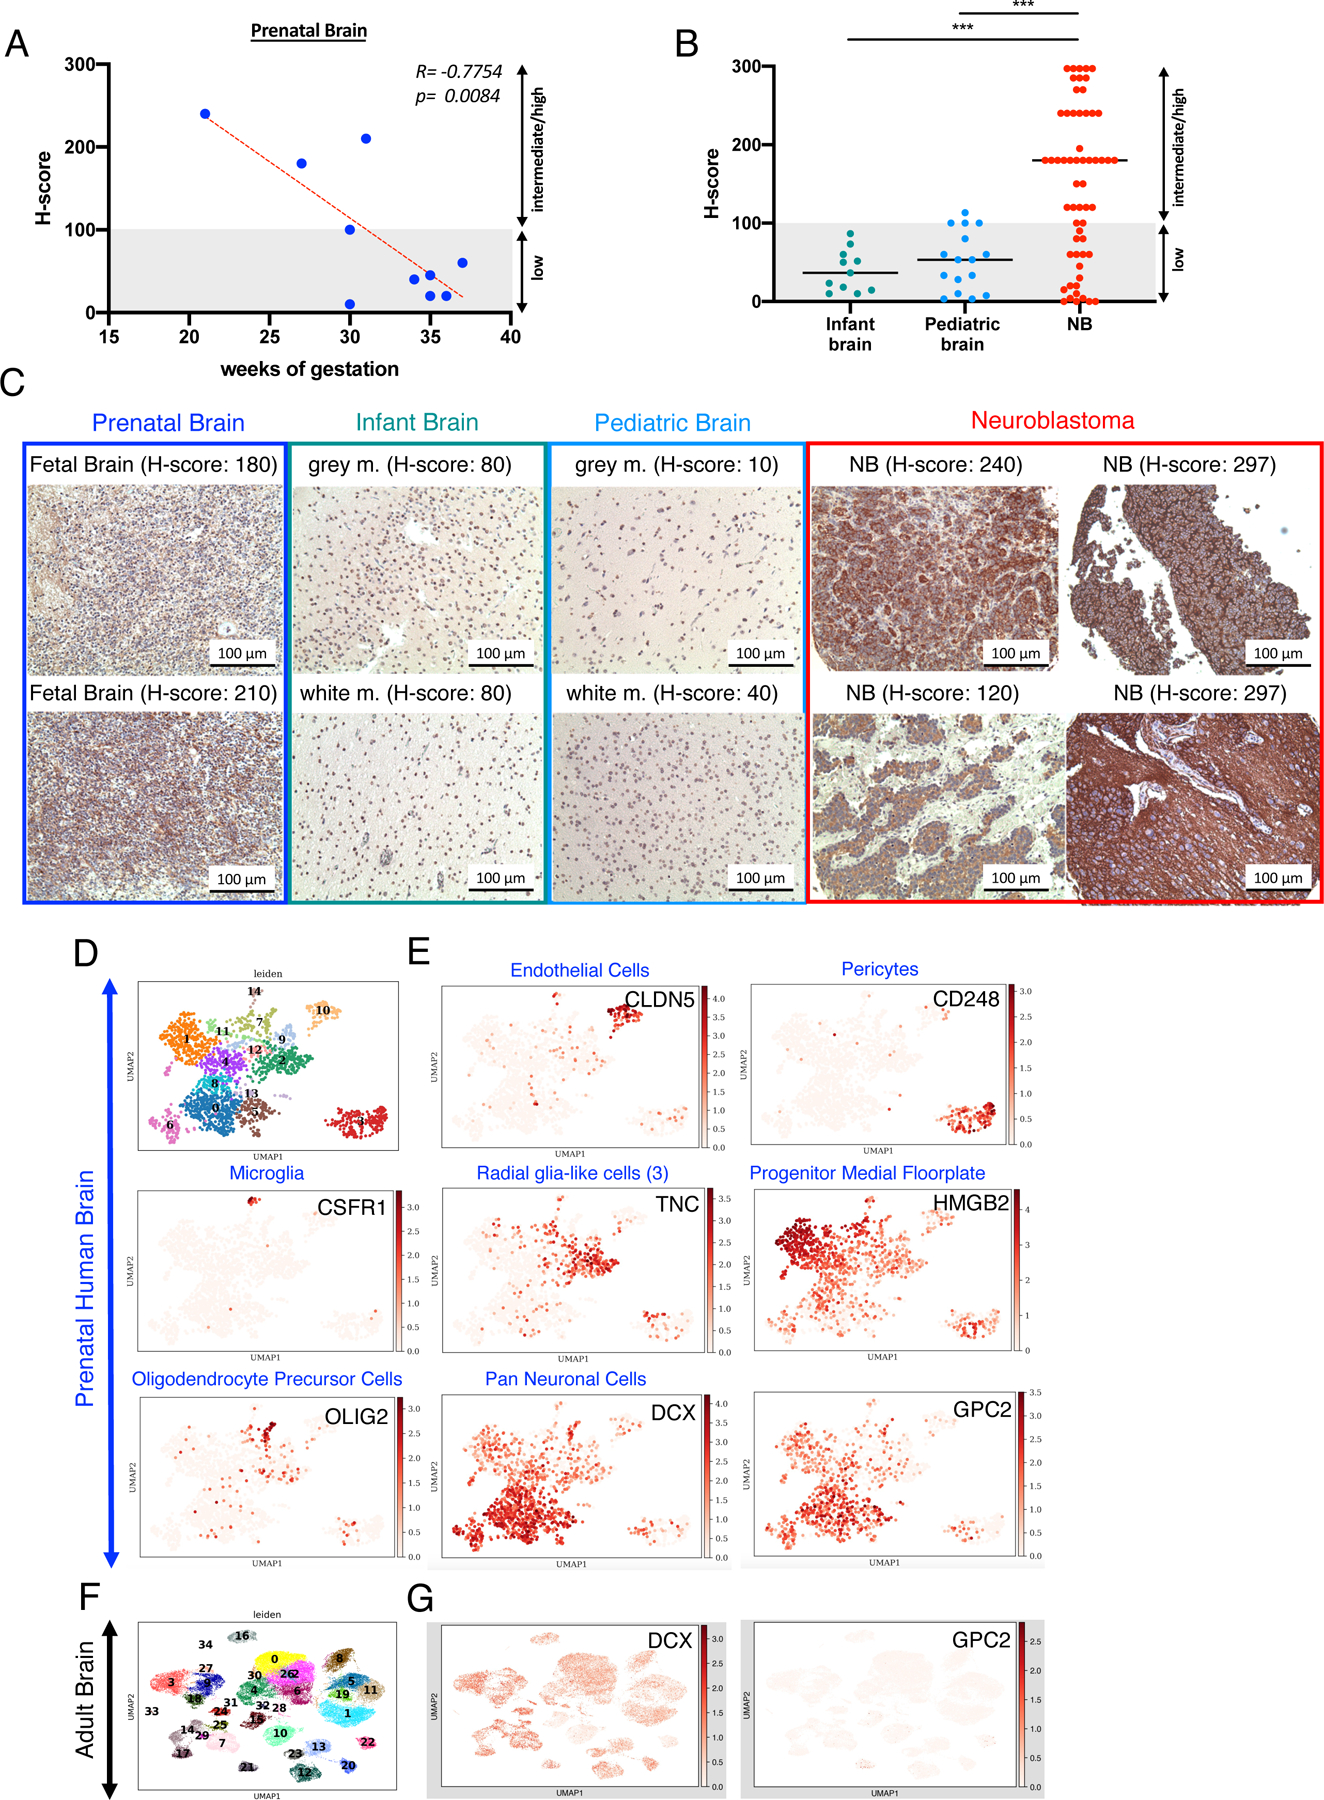
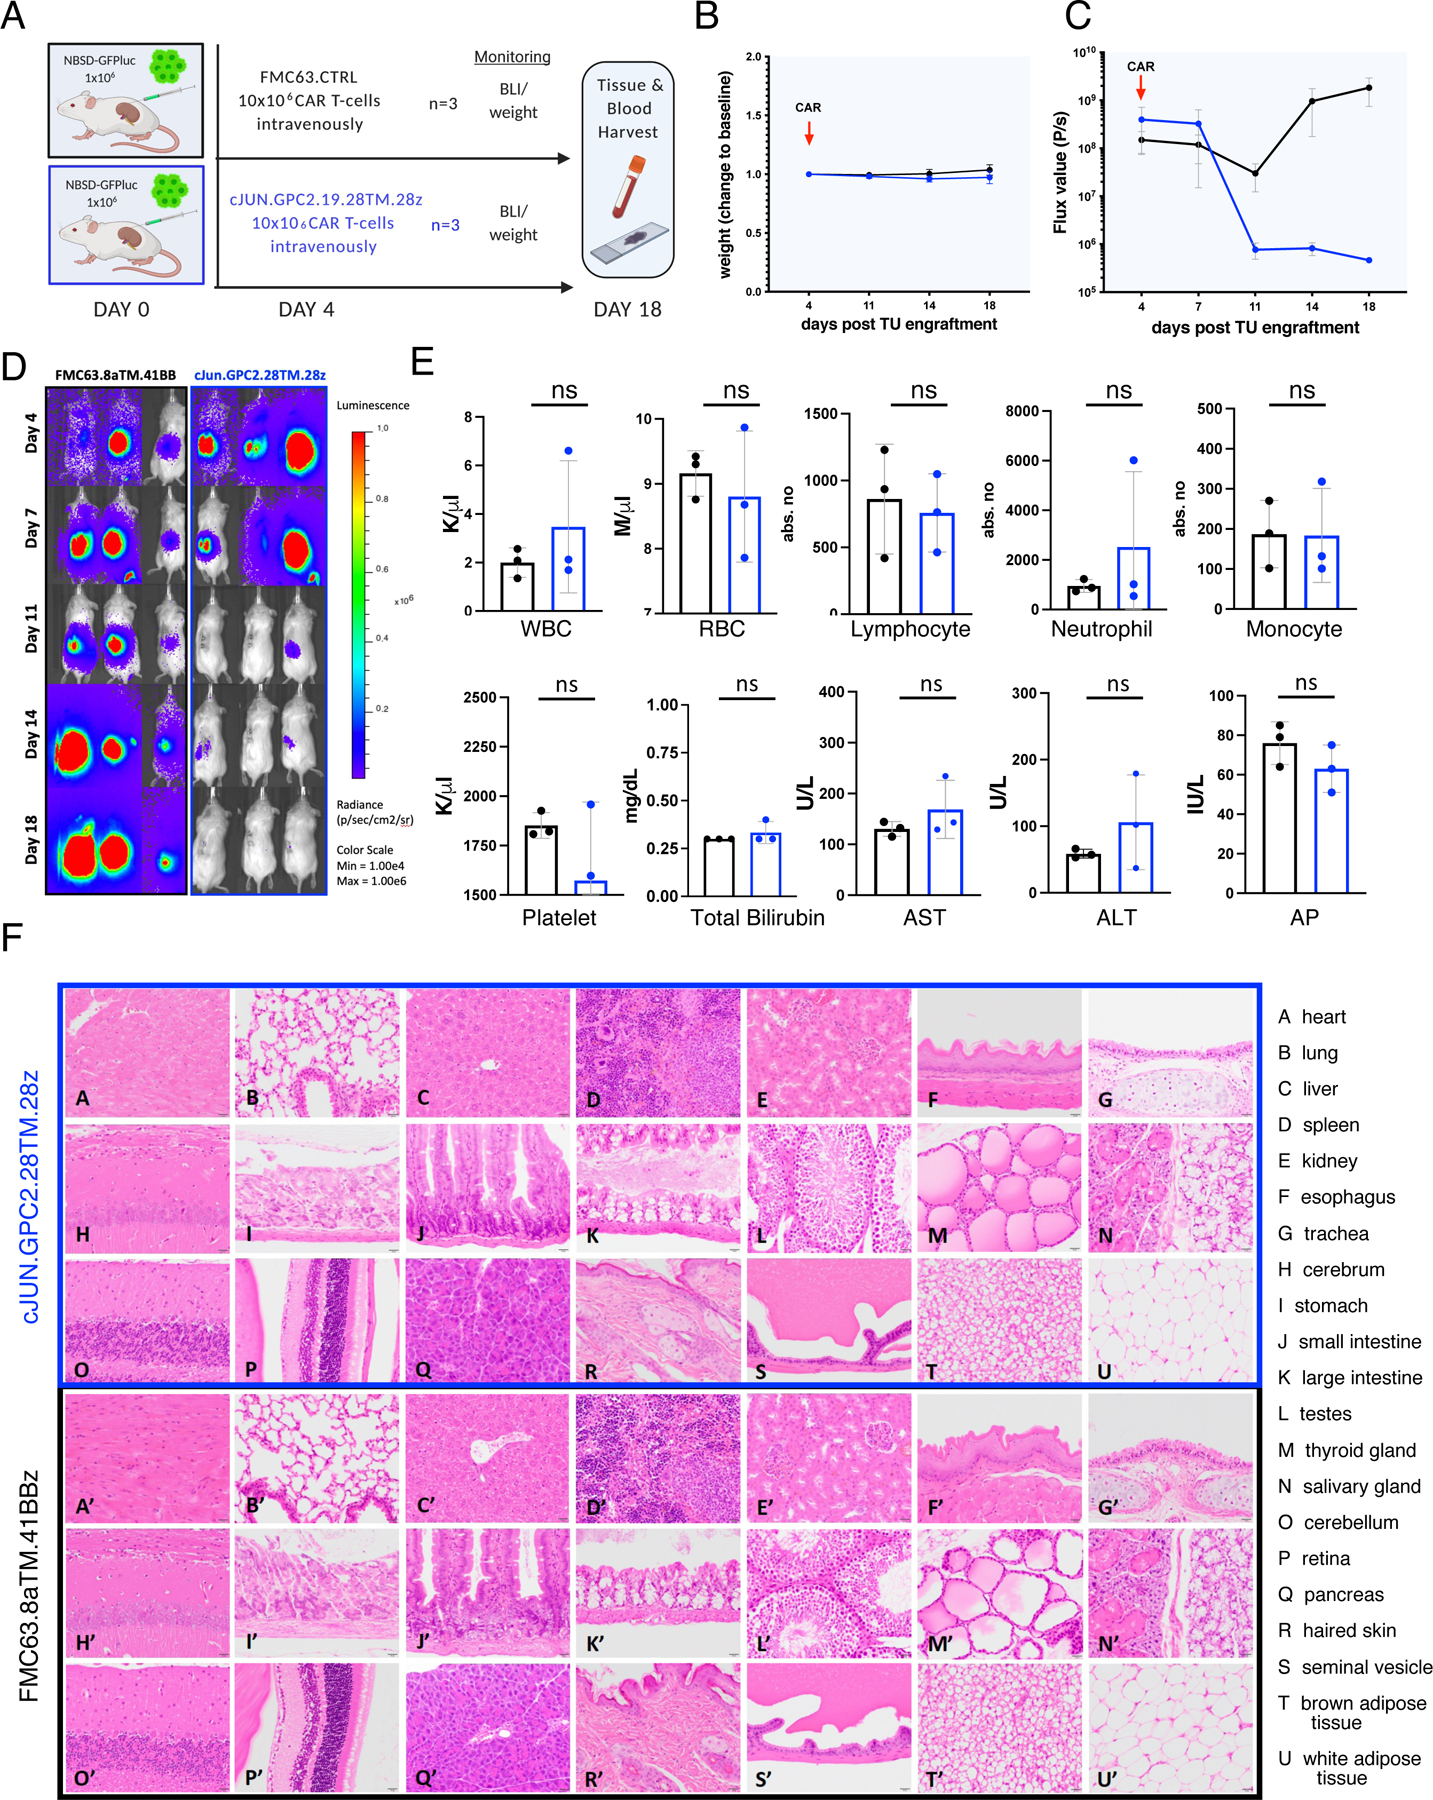
Pediatric cancers often mimic fetal tissues and express proteins normally silenced postnatally that could serve as immune targets. We developed T cells expressing chimeric antigen receptors (CARs) targeting glypican-2 (GPC2), a fetal antigen expressed on neuroblastoma (NB) and several other solid tumors. CARs engineered using standard designs control NBs with transgenic GPC2 overexpression, but not those expressing clinically relevant GPC2 site density (∼5,000 molecules/cell, range 1-6 × 10³). Iterative engineering of transmembrane (TM) and co-stimulatory domains plus overexpression of c-Jun lowered the GPC2-CAR antigen density threshold, enabling potent and durable eradication of NBs expressing clinically relevant GPC2 antigen density, without toxicity. These studies highlight the critical interplay between CAR design and antigen density threshold, demonstrate potent efficacy and safety of a lead GPC2-CAR candidate suitable for clinical testing, and credential oncofetal antigens as a promising class of targets for CAR T cell therapy of solid tumors.

Keywords: CAR T cell; GPC2; antigen density; chimeric antigen receptor; glypican-2; immunotherapy; neuroblastoma; oncofetal antigen.


Conflict of interest statement

Declaration of interest C.L.M., S.H., J.M.M., K.R.B., R.G.M., D.S.D., and Z.Z. are co-inventors on patents related to this work. C.L.M. (and others) have multiple patents pertinent to CAR T cells. C.L.M. is a co-founder of Lyell Immunopharma and Syncopation Life Sciences, which develop CAR-based therapies, and consults for Lyell, NeoImmune Tech, Apricity, Nektar, and Immatics. K.R.B. and J.M.M. receive research funding from Tmunity for research on GPC2-directed immunotherapies. D.Z., Z.Z., D.S.D., J.M.M., and K.R.B. receive royalties from Tmunity for licensing of GPC2-related IP. R.G.M. and E.S. are consultants for and hold equity in Lyell Immunopharma. R.G.M. consults for GammaDelta Therapeutics, Aptorum Group, Zai Lab, and Illumina Radiopharmaceuticals and J.T. for Dorian Therapeutics. S.J.B. is an employee of BD Biosciences. A.T.S. is a founder of Immunai and Cartography Biosciences and receives research funding from Arsenal Biosciences and 10× Genomics. K.R.P. is a co-founder and employee of Cartography Biosciences. H.Y.C. is a co-founder of Accent Therapeutics and Boundless Bio and is an advisor to 10× Genomics, Arsenal Bio, and Spring Discovery.

Figures

Figure 1.
Figure 1.. GPC2-CAR T cell efficacy is limited by GPC2 antigen density on NB
A) Human GPC2 crystal structure (PDB ID: 6WJL) and effect of point mutations on GPC2.19 Fab binding affinity. Blue line delineates previously defined GPC2.D3 epitope. B) Binding dissociation constants for GPC2.19 Fab binding to human GPC2 mutants. C) Schematic of GPC2.8aTM.41BBz CAR constructs in VLVH orientation of scFv’s. D) Flow cytometric cell surface expression of GPC2 on indicated NB cell lines and negative CTRL (CHO) and respective isotype CTRL. Representative histogram of n=4 independent experiments. Table shows molecules/cell of GPC2 as determined by QuantiBRITE PE assay. E-F) Baseline levels of (E) IFNγ (left) and secretion of IFNγ (∆baseline, right) and (F) IL2 by GPC2-CAR T cells in response to NB cell lines shown in (D), with increasing antigen levels of GPC2. Representative of n=4 independent experiments (mean ± SD). G) Schematic of in vitro killing assays at 1:5 effector:target ratio. H-J) Cytolytic activity of GPC2.D3.8TM.41BBz- and GPC2.19.8TM.41BBz-CAR T cells in vitro against (H) NGP-GPC2 (I) NBSD and (J) SMS-SAN NB cell lines at 1:5 E:T ratio. Values represent mean ± SEM, representative of n=4 independent experiments. K) Schematic of experimental outline testing GPC2.19.8TM.41BBz-CAR CAR T cells in para-orthotopic NB renal capsule xenograft models. L-N) NGP-GPC2 post engraftment of 0.75 MIO tumor cells on day 0 and treated on day 4 (n=6 mice for CTRL.FMC63 and n=5 mice for GPC2.19 CAR T cells). M) NBSD or N) SMS-SAN post engraftment of 1 MIO tumor cells on day 0 and treated with CAR on day 5 (n=3 mice/group). For L-N): n=1 experiment each. Tumor burden assessed by IVIS imaging. Values represent FLUX [P/s] mean ± SEM. Statistics: (E,F) represent Student’s t-test, (H-J) and (L-N) represent two-way RM-ANOVA (**** = p<0.0001, *** = p<0.001, ** = p<0.01, * = p<0.05), ns = p > 0.05). See also Figures S1-2.
Figure 2.
Figure 2.. Antigen density of candidate immunotherapy targets on clinical samples of NB cells metastatic to the bone marrow
A) Gene expression of GPC2 and ANPEP (CD13) in a panel of NB cell lines (dataset: GSE89413) B) Flow cytometric cell surface expression of CD13 on negative CTRL cells (CHO), NB cell lines and HS-5 BM stroma cells. C) Representative CD45-CD13- and NCAM+GD2+ gating strategy to identify NB tumor cell populations in clinical BM samples. D) Cell surface antigen quantification (molecules/cell) of GPC2, NCAM, GD2, L1CAM, ALK and B7-H3 on BM infiltrating NB cells (BM_TU), Cell Lines (CL) and patient derived xenograft tumors (PDX) assessed by multicolor flow cytometry antigen density quantification assay. Horizontal lines indicate median. Statistics represent Welch’s t-test (**** = p<0.0001, *** = p<0.001, ** = p<0.01, * = p<0.05), ns = p > 0.05). Statistical parameters of the samples are shown in Figure S3B. See also Figure S3.
Figure 3.
Figure 3.. GPC2-CAR T cells incorporating a CD28 TM eradicate GPC2mod and GPC2lo NBs
A) Schematic of GPC2.19.8TM.41BBz (left), GPC2.19.28TM.41BBz (center) and GPC2.19.28TM.28z (right) CAR constructs. B-C) Cytolytic activity of these CAR T cells against SMS-SAN (GPC2lo) at B) 1:5 and C) 1:8 effector:target ratio. Representative of n=3 independent experiments with n=3 individual donors. D) Experimental in vivo setup testing GPC2.19-CAR T cell constructs shown in (A) in a para-orthotopic GPC2mod (NBSD) NB renal capsule model. E-G) Bioluminescence images (E) (BLI) and F) FLUX [P/s] values of tumor burden assessed by IVIS imaging, and G) Kaplan-Meier survival analysis of treatment arms shown in (D). Statistical analysis for survival curves represents log-rank test. One mouse in the FMC63.CTRL group died during imaging on day 40 and was censored from the analysis. Representative of n=3 independent experiments with n=3 individual donors. H) Experimental in vivo setup testing constructs shown (A) in GPC2lo (SMS-SAN) metastatic xenograft model. I-K) BLI images (I) and J) FLUX [P/s] values of tumor burden assessed by IVIS imaging, and K) Kaplan-Meier survival analysis of treatment arms shown in H. Representative of n=1 experiment. Statistical analysis for survival curves represents log-rank test. Values in B, C, F, J represent mean ± SEM. Statistical test in B, C, F, J represents two-way RM-ANOVA (**** = p<0.0001, *** = p<0.001, ** = p<0.01, * = p<0.05), ns = p > 0.05). See also Table S1 and Figure S4.
Figure 4.
Figure 4.. GPC2-CAR T cells with CD28 TM domains control patient derived xenografts and CD28 outperforms 41BB costimulatory endodomains
A) Experimental in vivo setup testing GPC2.19-CAR T cells in COG-N-421x PDX models bearing moderate size tumor burden (MOD: range mean TU vol 0.22–0.24 cm3) or high size tumor burden (HI: range mean TU vol 0.65–0.78 cm3). B-C) Tumor volume (B) after treatment and C) Kaplan-Meier survival analysis of the MOD tumor burden arm. Mice in the GPC2.19.28TM.41BBz group were euthanized due to clinical signs of GvHD by day 32, as was one mouse in the FMC63.CTRL group on d35 and were censored from the analysis. D-E) Tumor volume (B) after treatment and E) Kaplan-Meier survival analysis of the HI tumor burden arm. Three mice in the GPC2.19.28TM.41BBz group were euthanized due to clinical signs of GvHD by d32 and were censored from the analysis. Endpoints were defined maximum tumor burden >2 cm3 volume or signs of GVHD. Statistics in B and D represent two-way RM-ANOVA (**** = p<0.0001, *** = p<0.001, ** = p<0.01, * = p<0.05), ns = p > 0.05).
Figure 5.
Figure 5.. Acquired resistance following GPC2-CAR therapy is associated with reversible downregulation of GPC2 cell surface expression
A) Tumor volumes of PDX (COG-N-421x) flank tumors (MOD: range mean TU vol 0.22–0.24 cm3 tumor volume) in mice treated with GPC2.19.28TM.28z- or FMC63.CTRL-CAR T cells. Primary (M46) and recurrent (M34) tumors were harvested for further analysis. B) Representative IHC images of GPC2 and CD3 expression in post-GPC2.19.28TM.28z recurrent (M34, harvested d56) or CTRL (M46, harvested d12) tumors. C) Mean Fluorescent Intensity (MFI) of NB cell surface markers in tumors harvested from untreated (WT) and GPC2.19.28TM.28z CAR treated, relapsed samples harvested at the endpoint of experiment shown in Figure 4. Two relapsed samples (M10 and M51), were re-engrafted as single cell suspensions into non-CAR T cell bearing mice and harvested 120 days later and analyzed simultaneously (REL_RE). Horizontal lines indicate median. Statistic represents Mann-Whitney test (* = p<0.05). D) Representative histograms of one untreated (WT), one relapsed (REL) and one matched relapsed/re-engrafted (REL-RE) tumor. See also Figure S5.
Figure 6.
Figure 6.. Overexpression of c-Jun enhances GPC2-CAR potency
A) Schematic of the c-Jun.GPC2.19.28TM.28z expression vector. B) Flow cytometry cell surface analysis of GPC2.19-CAR T cell constructs used in vivo as compared to Mock T cells. Color legend of B, D, F and G shown in E. C) Experimental in vivo setup testing GPC2.19.28TM.28z CAR T cells +/− c-Jun in para-orthotopic renal capsule xenograft model of tumor cells isolated from the BM of patient ST16 at tumor relapse. D) Corresponding FLUX [P/s] values of tumor burden assessed by IVIS imaging. Statistic represents one-tailed Mann Whitney test at experimental endpoint (d49). E) Experimental in vivo setup testing c-Jun overexpressing GPC2.19-CAR T cell constructs in comparison to 28TM.41BBz and 28TM.28z in GPC2lo (SMS-SAN) metastatic xenograft model. Representative of n=1 experiment. F) Corresponding FLUX [P/s] values of tumor burden assessed by IVIS imaging. Statistic represents 2-Way RM-ANOVA by day 25. Endpoint of c-Jun.GPC2.19.28TM.28z group was onset of GvHD on d32. G) Persistence of CD45+ CAR T cells/µl blood on mice shown in (F) on d15 and d29. Statistic represents one-way multiple comparisons ANOVA. H) Schematic of experimental setup testing c-Jun overexpressing GPC2.19-CAR T cell constructs in comparison to GPC2.19.28TM.41BBz and GPC2.19.28TM.28z in para-orthotopic NB renal capsule xenograft model engrafted with NGP-GPC2 (GPC2hi) cells. Representative of n=1 experiment. I) Corresponding FLUX [P/s] values of tumor burden assessed by IVIS imaging. Endpoint of c-Jun.28TM.28z group was onset of GvHD on day 50. Statistic represents 2-Way RM-ANOVA by day 50. J) Persistence of CD45+ CAR T cells/µl blood on day 35. Statistic represents one-way multiple comparisons ANOVA. K) Experimental in vivo setup for dual-imaging in para-orthotopic NB renal capsule xenograft model engrafted with GPC2lo/GPC2hi-MIX. L-M) Corresponding FLUX [P/s] values of NGP tumor burden assessed by IVIS imaging using (L) Nano-Luciferase substrate and M) NGP-GPC2 tumor burden using Firefly-Luciferase substrate post treatment with 10×106 FMC63.CTRL (n=3), GPC2.19.8TM.41BBz (n=3) or c-Jun.GPC2.19.28TM.28z (n=3) CAR T cells N) Tumor burden of GPC2lo and GPC2hi normalized to pre-treatment. Data represents log2 transformed FLUX fold-change+1 at the endpoint (day 26 for NGP, day 25 for NGP-GPC2). Values in D, F, I, L, M, N represent mean ± SEM. Values in G, J represent mean ± SD. O) Statistical analysis of data shown in N), representing one-way multiple comparison ANOVA (**** = p<0.0001, *** = p<0.001, ** = p<0.01, * = p<0.05), ns = p > 0.05). See also Figure S5.
Figure 7.
Figure 7.. GPC2 expression is restricted to fetal brain
A) Pearson Coefficient Correlation between GPC2 immunostaining (H-score) and gestational age in prenatal brain (n=10) tissues. B) Immunostaining (H-scores) of GPC2 in infant (n=11) and pediatric brain (n=16) and NB tumor samples (n=58). Statistical analysis represents one-way multiple comparison ANOVA (*** = p<0.001). Prenatal brain vs. NB =ns. Horizontal lines indicate median. C) Representative IHC images of GPC2 staining in prenatal brain, infant brain, pediatric brain and NB tumors. D) UMAP projections showing distinct cell populations from scRNAseq data in fetal, human ventral midbrain (from La Manno et. al, Cell 2016), colored by cluster ID. E) UMAP projection of scRNAseq data from adult human brain, colored by expression of the indicated genes, which mark various brain cell populations. Color indicates log-transformed, depth-normalized counts per cell. Data sourced via GEO accession GSE76381 (La Manno et al., 2016) for human prenatal brain and via the Allen Brain Atlas for human adult brain (https://portal.brain-map.org/atlases-and-data/rnaseq/human-multiple-cortical-areas-smart-seq). F) Distinct cell populations in single cells of adult human brain (Allen Brain Atlas), colored by cluster ID G) Expression of GPC2 in DCX+ neuronal population in the adult human brain. As in (F), color indicates log-transformed depth-normalized counts per cell. See also Figure S6.
Figure 8.
Figure 8.. c-Jun overexpressing GPC2-CAR T cells eradicate tumor in the absence of toxicity
A) Schematic of experimental setup (n=1): NSG mice were engrafted with 1×10⁶ NBSD tumor cells beneath the left renal capsule and treated with 10×106 c-Jun.GPC2.19.28TM.28z or control FMC63 CAR T cells on d4 via IV tail vein injection. Tumor burden and weight was followed until the endpoint on day 18. B) Weight of treated mice as change to baseline over the course of the experiment. Values represent mean ± SD. C) FLUX [P/s] values of tumor burden assessed by IVIS imaging and D) BLI images. Values in C) represent mean ± SEM. E) Assessment of blood cell populations and liver function parameters (transaminases AST, ALT and alkaline phosphatase). Values represent mean ± SD. Statistic represents Student’s t-test (**** = p<0.0001, *** = p<0.001, ** = p<0.01, * = p<0.05), ns = p > 0.05). F) Hematoxylin and eosin [H&E] stained tissues from mice either treated with GPC2.19 28TM.28z CAR T cells (A-U) or FMC63 control CAR T cells (A’-U’). Magnification: 40x. Scale bar: 20μm. See also Figures S7-8.

Comment in

References

    1. Ayanlaja AA, Xiong Y, Gao Y, Ji G, Tang C, Abdikani Abdullah Z, and Gao D (2017). Distinct Features of Doublecortin as a Marker of Neuronal Migration and Its Implications in Cancer Cell Mobility. Front Mol Neurosci 10, 199. - PMC - PubMed
    1. Bosse KR, and Maris JM (2016). Advances in the translational genomics of neuroblastoma: From improving risk stratification and revealing novel biology to identifying actionable genomic alterations. Cancer 122, 20–33. - PMC - PubMed
    1. Bosse KR, Raman P, Zhu Z, Lane M, Martinez D, Heitzeneder S, Rathi KS, Kendsersky NM, Randall M, Donovan L, et al. (2017). Identification of GPC2 as an Oncoprotein and Candidate Immunotherapeutic Target in High-Risk Neuroblastoma. Cancer Cell 32, 295–309 e212. - PMC - PubMed
    1. Brown CE, Alizadeh D, Starr R, Weng L, Wagner JR, Naranjo A, Ostberg JR, Blanchard MS, Kilpatrick J, Simpson J, et al. (2016). Regression of Glioblastoma after Chimeric Antigen Receptor T-Cell Therapy. N Engl J Med 375, 2561–2569. - PMC - PubMed
    1. Cameron BJ, Gerry AB, Dukes J, Harper JV, Kannan V, Bianchi FC, Grand F, Brewer JE, Gupta M, Plesa G, et al. (2013). Identification of a Titin-derived HLA-A1-presented peptide as a cross-reactive target for engineered MAGE A3-directed T cells. Sci Transl Med 5, 197ra103. - PMC - PubMed

Publication types

MeSH terms