

Choroid plexus enlargement is associated with neuroinflammation and reduction of blood brain barrier permeability in depression
- PMID: 34972034
- PMCID: PMC8718974
- DOI: 10.1016/j.nicl.2021.102926
Choroid plexus enlargement is associated with neuroinflammation and reduction of blood brain barrier permeability in depression
Abstract
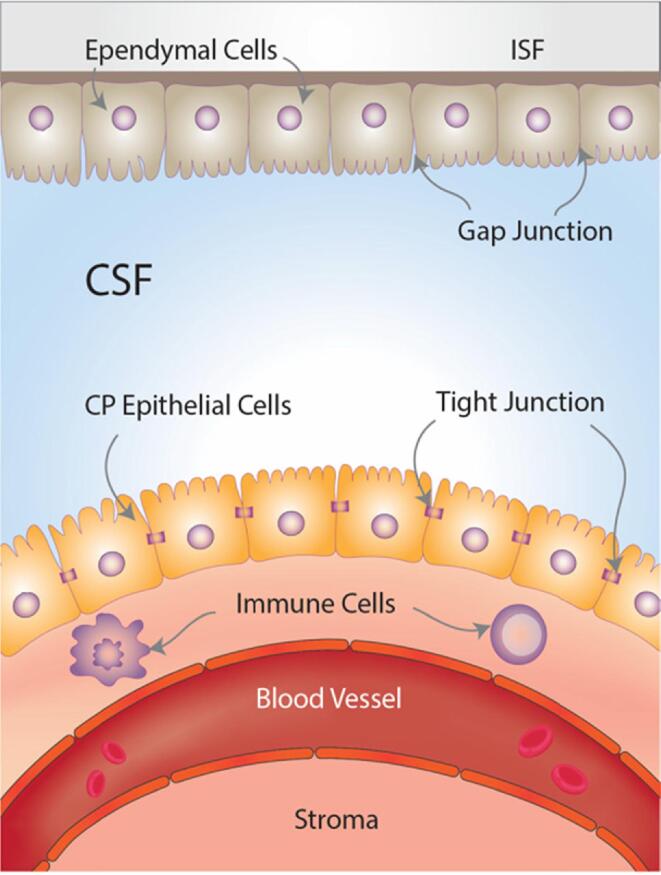
Background: Recent studies have shown that choroid plexuses (CP) may be involved in the neuro-immune axes, playing a role in the interaction between the central and peripheral inflammation. Here we aimed to investigate CP volume alterations in depression and their associations with inflammation.
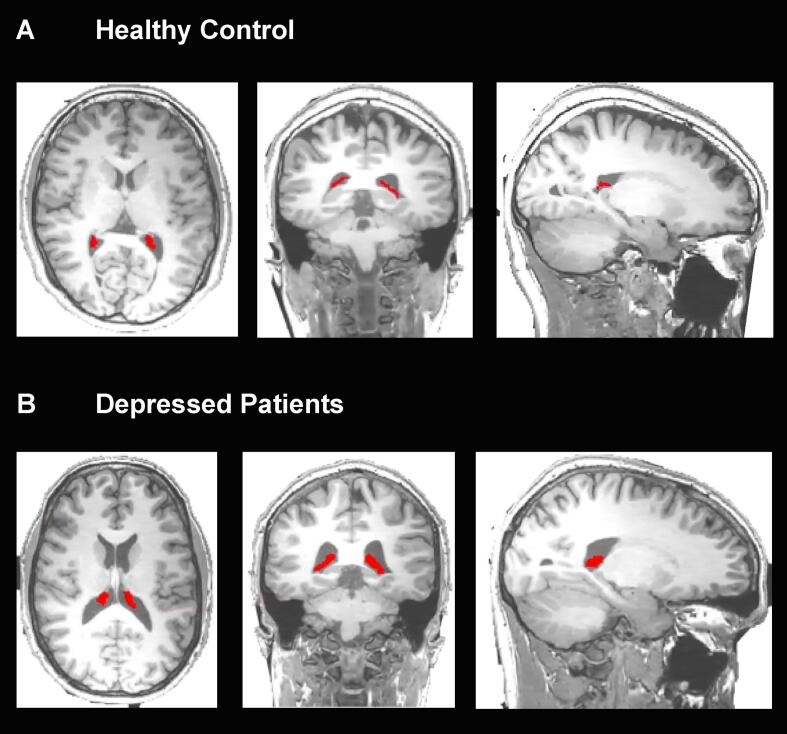
Methods: 51 depressed participants (HDRS score > 13) and 25 age- and sex-matched healthy controls (HCs) from the Wellcome Trust NIMA consortium were re-analysed for the study. All the participants underwent full peripheral cytokine profiling and simultaneous [11C]PK11195 PET/structural MRI imaging for measuring neuroinflammation and CP volume respectively.
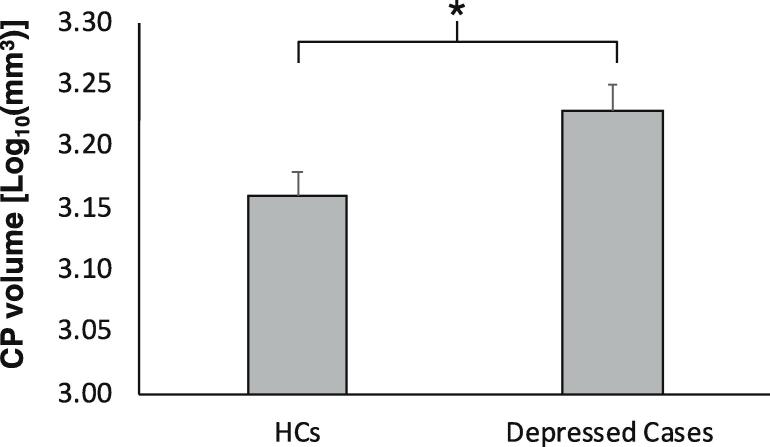
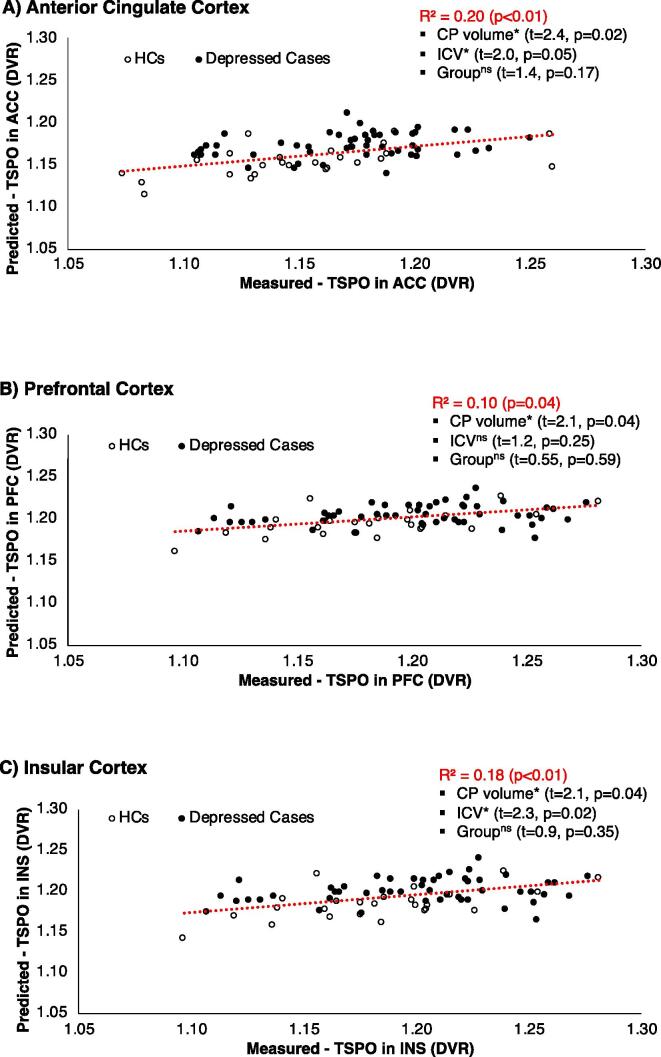
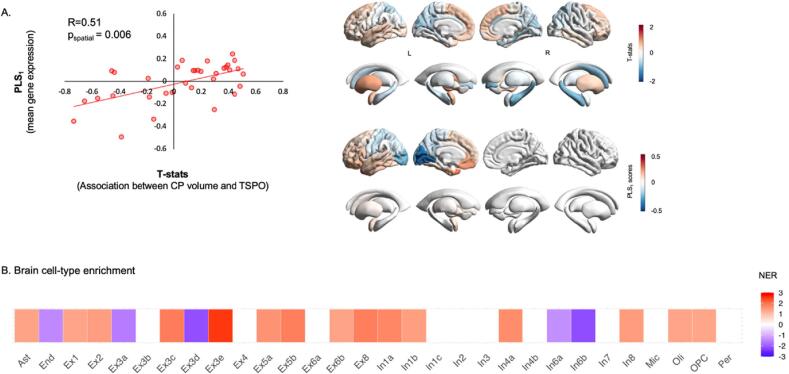
Results: We found a significantly greater CP volume in depressed subjects compared to HCs (t(76) = +2.17) that was positively correlated with [11C]PK11195 PET binding in the anterior cingulate cortex (r = 0.28, p = 0.02), prefrontal cortex (r = 0.24, p = 0.04), and insular cortex (r = 0.24, p = 0.04), but not with the peripheral inflammatory markers: CRP levels (r = 0.07, p = 0.53), IL-6 (r = -0.08, p = 0.61), and TNF-α (r = -0.06, p = 0.70). The CP volume correlated with the [11C]PK11195 PET binding in CP (r = 0.34, p = 0.005). Integration of transcriptomic data from the Allen Human Brain Atlas with the brain map depicting the correlations between CP volume and PET imaging found significant gene enrichment for several pathways involved in neuroinflammatory response.
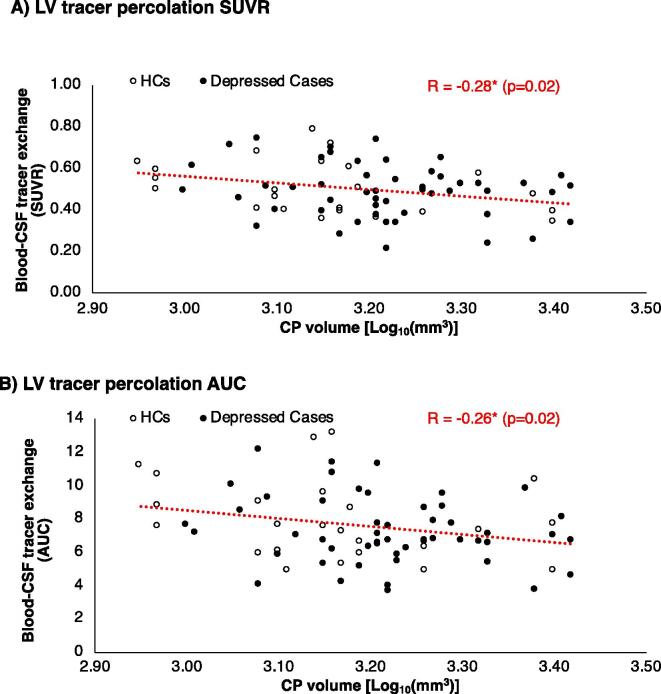
Conclusion: This result supports the hypothesis that changes in brain barriers may cause reduction in solute exchanges between blood and CSF, disturbing the brain homeostasis and ultimately contributing to inflammation in depression. Given that CP anomalies have been recently detected in other brain disorders, these results may not be specific to depression and might extend to other conditions with a peripheral inflammatory component.
Keywords: Blood brain barrier; Choroid Plexus; Depression; Neuroinflammation.
Copyright © 2021 The Author(s). Published by Elsevier Inc. All rights reserved.
Conflict of interest statement
The authors declare that they have no known competing financial interests or personal relationships that could have appeared to influence the work reported in this paper.
Figures
References
-
- ACABCHUK, R. L., SUN, Y., WOLFERZ JR, R., EASTMAN, M. B., LENNINGTON, J. B., SHOOK, B. A., WU, Q. & CONOVER, J. C. 2015. 3D modeling of the lateral ventricles and histological characterization of periventricular tissue in humans and mouse. JoVE (Journal of Visualized Experiments), e52328. - PMC - PubMed
-
- Arnatkeviciute A., Fulcher B.D., Fornito A. A practical guide to linking brain-wide gene expression and neuroimaging data. Neuroimage. 2019;189:353–367. - PubMed
-
- ASHBURNER, J. 2007. A fast diffeomorphic image registration algorithm. Neuroimage, 38, 95-113. - PubMed
Publication types
MeSH terms
Grants and funding
LinkOut - more resources
Full Text Sources
Research Materials
Miscellaneous
