. 2021 Dec 31;16(12):e0262017.
doi: 10.1371/journal.pone.0262017. eCollection 2021.

Evaluation of micro-RNA in extracellular vesicles from blood of patients with prostate cancer

Affiliations

Evaluation of micro-RNA in extracellular vesicles from blood of patients with prostate cancer

Jiyoon Kim et al. PLoS One. .

Abstract

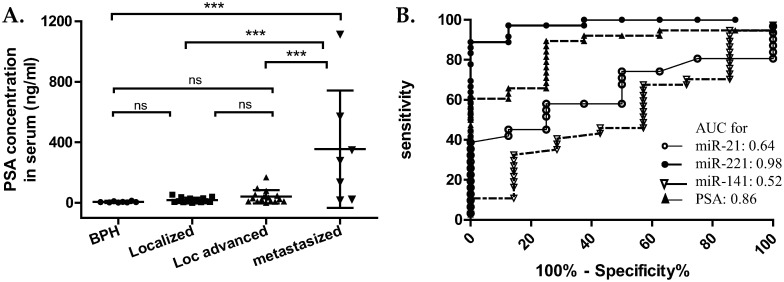
Extracellular vesicles (EVs) contain various types of molecules including micro-RNAs, so isolating EVs can be an effective way to analyze and diagnose diseases. A lot of micro-RNAs have been known in relation to prostate cancer (PCa), and we evaluate miR-21, miR-141, and miR-221 in EVs and compare them with prostate-specific antigen (PSA). EVs were isolated from plasma of 38 patients with prostate cancer and 8 patients with benign prostatic hyperplasia (BPH), using a method that showed the highest recovery of RNA. Isolation of EVs concentrated micro-RNAs, reducing the cycle threshold (Ct) value of RT-qPCR amplification of micro-RNA such as miR-16 by 5.12 and miR-191 by 4.65, compared to the values before EV isolation. Normalization of target micro-RNAs was done using miR-191. For miR-221, the mean expression level of patients with localized PCa was significantly higher than that of the control group, having 33.45 times higher expression than the control group (p < 0.01). Area under curve (AUC) between BPH and PCa for miR-221 was 0.98 (p < 0.0001), which was better than AUC for prostate-specific antigen (PSA) level in serum for the same patients. The levels of miR-21 and miR-141 in EVs did not show significant changes in patients with PCa compared to the control group in this study. This study suggests isolating EVs can be a helpful approach in analyzing micro-RNAs with regard to disease.


Conflict of interest statement

The authors have declared that no competing interests exist.

Figures

Fig 1
Fig 1. Retrieval of RNA in EVs from plasma.
(A) Percentage of RNA in EVs recovered from plasma by each isolation method. The amount of RNA in EVs was divided by the amount of RNA in precleaned plasma with same volume. Error bars: ± 1 s.d., n = 3, *: p < 0.05, ns: not significant (One-way ANOVA with Tukey’s post-hoc analysis). (B) Qualitative profiles of micro-RNAs by small RNA bioanalyzer for each EV isolation method. EVs were isolated from same volume of plasma, then RNA was resuspended in the same volumes of nuclease-free water at the same condition. (C) Quantitative comparison of EV isolation techniques. EVs were isolated from 250 μℓ of plasma. RNA input = 100 ng, error bars: ± 1 s.d., n = 3, ***: p< 0.001, ns: not significant (One-way ANOVA with Tukey’s post hoc analysis). (D) Recovery of EVs isolated by each method. The number of particles in EVs was divided by the number of particles in the precleaned plasma for each isolation method. Particle numbers were measured by Nanoparticle tracking analysis. Error bars: ± 1 s.d., n = 3, ns: not significant (One-way ANOVA with Tukey’s post-hoc analysis). (E) Effect of EV isolation on micro-RNA in plasma. EVs were isolated from 250 μℓ plasma by Exo2D. RNA input = 90 ng; error bars: ± 1 s.d., n = 3; ***: p < 0.001; *: p < 0.05 (Student’s t-test).
Fig 2
Fig 2. Characterization of EVs from plasma.
EVs were isolated by Exo2D. (A) TEM image of EVs. A scale bar with 200 nm length. (B) EV markers identified by Western blots. LnCap, a prostate cancer cell line, was used as a positive control. (C) Size distribution of EVs measured by Nanoparticle Tracking Analysis. Proportion of particles at each size in total population of particles was represented as percentage.
Fig 3
Fig 3. Selection of reference miRNA in EVs from plasma of patients with prostate disease.
(A) RT qPCR results of miR-16, miR-191 and miR-103. Each dot represents a mean Ct value of one sample. A middle lines shows a mean value for each micro-RNA, and upper and lower lines show standard deviations. (B) Stability value of three micro-RNAs by Normfinder.
Fig 4
Fig 4. Analysis of normalized miR-21, miR-141, and miR-221 in plasma of patients with prostate cancer (PCa).
The level of each micro-RNA was normalized by the level of miR-191. Each dot represents 2-(ΔΔCt) or fold change for each sample; ΔΔCt = ΔCt of a sample—mean ΔCt of a control group, ΔCt = mean Ct of target gene—mean Ct of reference gene. Middle lines: means; upper and lower lines: ± 1 standard deviation. “Localized” denotes patients with localized PCa, “Loc advanced” means patients with local advanced PCa, and “metastasized” signifies patients with metastasized PCa. (A) Fold change of miR-21 in plasma EVs. ns: not significant (B) Fold change of miR-141 in plasma EVs. *: p < 0.05 (C) Fold change of miR-221 in plasma EVs; **: p < 0.01 (One-way ANOVA with Tukey’s post hoc analysis).
Fig 5
Fig 5. Comparison of PSA with micro-RNA in EVs.
(A) PSA level in serum from patients. Preoperative PSA concentration in serum was used for analysis (S1 Table). Patients were the same participants as in the test for plasma EVs; ***: p < 0.001 (One-way ANOVA with Tukey’s post hoc analysis). (B) ROC curve of PSA and each micro-RNA for distinguishing BPH from PCa.

References

    1. Hayes J, Peruzzi PP, Lawler S. MicroRNAs in cancer: biomarkers, functions and therapy. Trends in Molecular Medicine. 2014;20(8):460–469. doi: 10.1016/j.molmed.2014.06.005 - DOI - PubMed
    1. Wang WT, Chen YQ. Circulating miRNAs in cancer from detection to therapy. Journal of Hematology & Oncology. 2014;7(86). doi: 10.1186/s13045-014-0086-0 - DOI - PMC - PubMed
    1. Kosaka N, Iguchi H, Ochiya T. Circulating microRNA in body fluid: a new potential biomarker for cancer diagnosis and prognosis. Cancer Science. 2010;101(10):2087–2092. doi: 10.1111/j.1349-7006.2010.01650.x - DOI - PMC - PubMed
    1. Chen X. Characterization of microRNAs in serum a novel class of biomarkers for diagnosis of cancer and other diseases. Cell Research. 2008;18:997–1006. doi: 10.1038/cr.2008.282 - DOI - PubMed
    1. Taylor MA. Circulating microRNAs as biomarkers and mediators of cell-cell communication in cancer. Biomedicines. 2015;3(4):270–281. doi: 10.3390/biomedicines3040270 - DOI - PMC - PubMed

Publication types