. 2022 Mar 22;6(6):1708-1718.
doi: 10.1182/bloodadvances.2021005801.

Extent of intravital contraction of arterial and venous thrombi and pulmonary emboli

Affiliations

Extent of intravital contraction of arterial and venous thrombi and pulmonary emboli

Rafael R Khismatullin et al. Blood Adv. .

Abstract

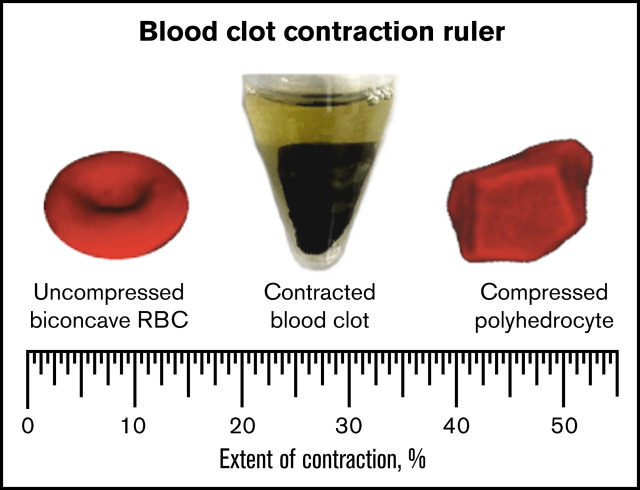
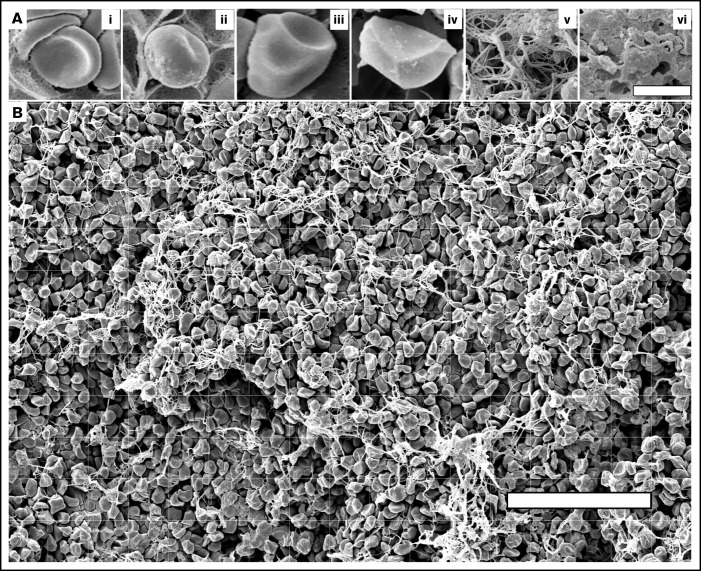
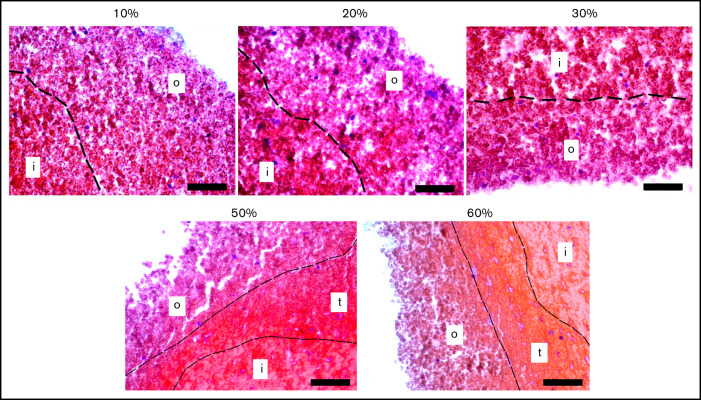
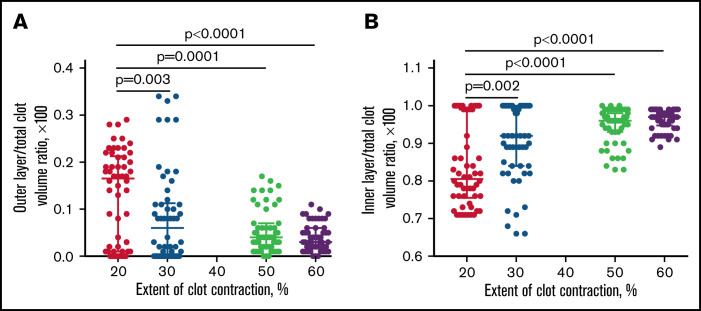
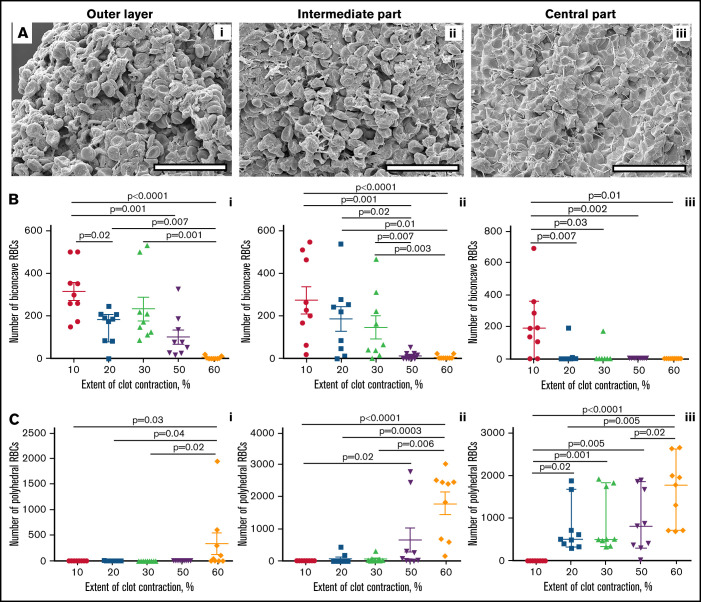
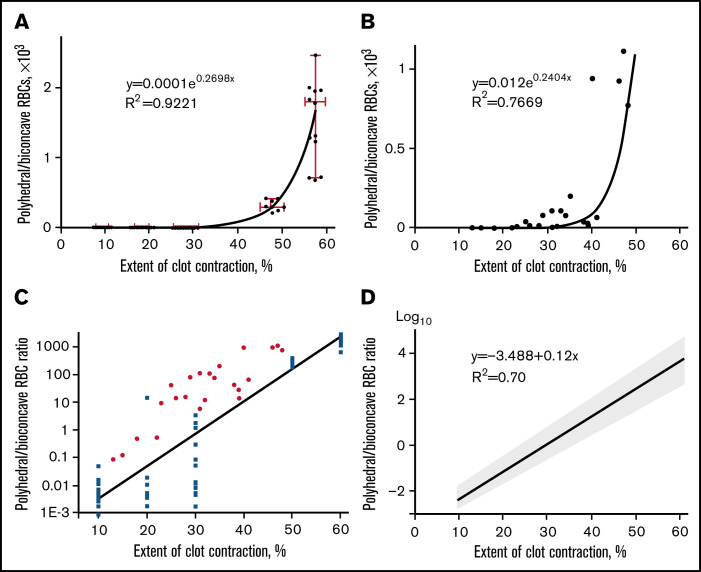
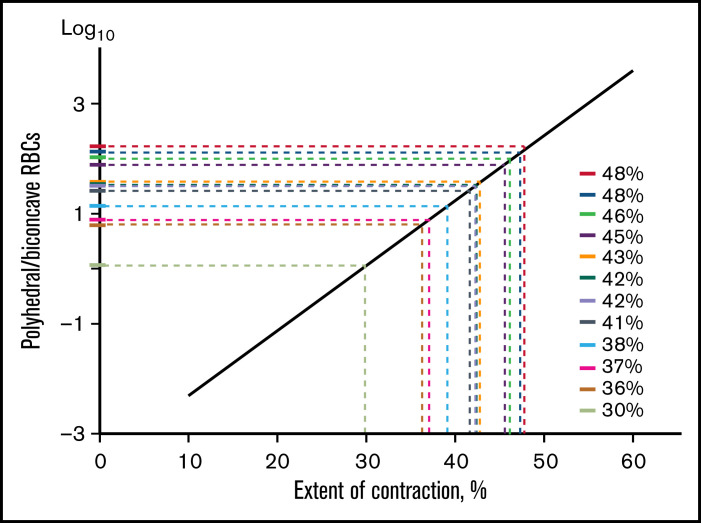
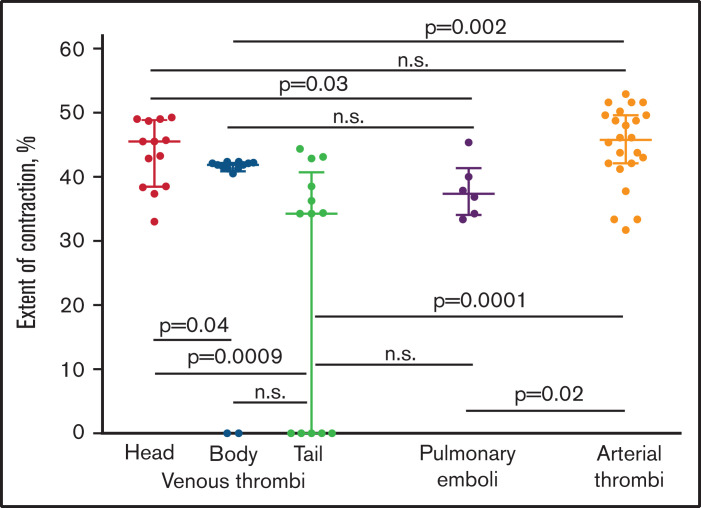
Blood clots and thrombi undergo platelet-driven contraction/retraction followed by structural rearrangements. We have established quantitative relationships between the composition of blood clots and extent of contraction to determine intravital contraction of thrombi and emboli based on their content. The composition of human blood clots and thrombi was quantified using histology and scanning electron microscopy. Contracting blood clots were segregated into the gradually shrinking outer layer that contains a fibrin-platelet mesh and the expanding inner portion with compacted red blood cells (RBCs). At 10% contraction, biconcave RBCs were partially compressed into polyhedral RBCs, which became dominant at 20% contraction and higher. The polyhedral/biconcave RBC ratio and the extent of contraction displayed an exponential relationship, which was used to determine the extent of intravital contraction of ex vivo thrombi, ranging from 30% to 50%. In venous thrombi, the extent of contraction decreased gradually from the older (head) to the younger (body, tail) parts. In pulmonary emboli, the extent of contraction was significantly lower than in the venous head but was similar to the body and tail, suggesting that the emboli originate from the younger portion(s) of venous thrombi. The extent of contraction in arterial cerebral thrombi was significantly higher than in the younger parts of venous thrombi (body, tail) and pulmonary emboli but was indistinguishable from the older part (head). A novel tool, named the "contraction ruler," has been developed to use the composition of ex vivo thrombi to assess the extent of their intravital contraction, which contributes to the pathophysiology of thromboembolism.


Figures

None
Graphical abstract
Figure 1.
Figure 1.
Imaging and quantification of the structural elements of blood clots using high-resolution scanning electron microscopy. (A) Illustrating the structures analyzed in this study: nondeformed biconcave RBC (i), intermediate mainly biconcave RBC (ii), intermediate mainly polyhedral RBC (iii), fully compressed polyhedral RBC (polyhedrocyte) (iv), fibrin fibers (v), and sponge-like fibrin (vi). Bar represents 3.6 μm. (B) A scanning electron micrograph with overlaid grid used to quantify the composition of a blood clot. The structural elements were marked and measured individually. For RBCs, the number for each cell type was counted per image. For fibrin, the area occupied by fibrous and spongy fibrin structures within each grid square was estimated and expressed as percentage. The total area of each image taken at ×500 magnification was 154 μm × 238 μm = 36 652 μm2 (∼36 700 μm2). Scale bar represents 50 μm.
Figure 2.
Figure 2.
Representative histological images of blood clots with varying extents of contraction. A border (dotted line) between the outer layer (o) and inner portion (i) of a clot is determined by the difference in the packing density of erythrocytes. Sometimes at the higher extents of contraction, a transition zone (t) with intermediate packing density was observed (hematoxylin and eosin stain; original magnification ×400). Scale bar represents 50 µm.
Figure 3.
Figure 3.
Spatial redistribution of contracting blood clots. Dot-plots showing relative volume fractions of the outer layer (A) and inner portion (B) in the blood clots at increasing extents of contraction. If the boundary was not distinct, the borderline between the outer and inner layers was drawn through the middle of the transition zone. Each dot (n = 54) represents a volume fraction measured for an individual blood clot from 9 identically stained histological slides obtained for clots from 9 independent blood samples and stained with 2 techniques. Results are presented as a median with interquartile range. Statistical analysis was performed using the Friedman test with the correction for multiple comparisons and the false discovery rate with a 2-stage step-up method of Benjamini, Krieger, and Yekutieli.
Figure 4.
Figure 4.
Quantification of biconcave and polyhedral RBCs in the layers of blood clots at varying degrees of contraction. (A) Representative scanning electron micrographs taken in the outer layer (left column), intermediate part (middle column), and center (right column) of a contracted blood clot. The clot outer layer (Ai) contains mostly nondeformed biconcave RBCs (represented in Figure 1Ai) and empty spaces, whereas in the center (Aiii) all cells are compressed (Figure 1Aiv) and there are almost no empty spaces. The intermediate layer (Aii) contains intermediate-shaped RBCs (Figure 1Aii-iii). Fibrin is revealed in the outer layer and intermediate parts only. Scale bars represent 25 μm. (B-C) Dot plots showing a reduction of the absolute number of biconcave RBCs (Bi-iii) and increase of polyhedral RBCs (polyhedrocytes) (Ci-iii) per image area in the outer layer, intermediate part, and center in blood clots with an increasing extent of contraction. Each dot represents a number calculated from 1 of 3 scanning electron micrograph (36 700 µm2) of a blood clot from 9 independent blood samples. Results are presented as the median with interquartile range. Statistical analysis: Friedman test with post hoc Benjamini, Krieger, and Yekutieli test.
Figure 5.
Figure 5.
The ratio of compressed polyhedral RBCs (polyhedrocytes) and uncompressed biconcave RBCs in blood clots as a function of the extent of clot contraction. (A) The polyhedral/biconcave RBC ratio as a function of the extent of clot contraction fitted with an exponential (R2 = 0.92) for clots formed from normal blood samples. Each dot represents an averaged ratio of the 2 RBC types calculated and combined from 3 scanning electron micrographs obtained for the outer layer, intermediate, and central parts of each clot at a certain extent of contraction. The clots were obtained from 9 independent blood samples and analyzed at 5 various extents of contraction, so the total number of SEM images quantified and used for this plot was 3 × 9 × 5 = 135. The data points were fitted with an exponential function (solid line). The horizontal error bars represent a mean ± SD, whereas the vertical error bars represent the median and 95% CI. (B) The polyhedral/biconcave RBC ratio as a function of the extent of clot contraction fitted with an exponential (R2 = 0.77) for clots formed from 23 pathological blood samples. (C) A semi-logarithmic plot that represents the cellular composition vs extent of contraction shown in supplemental Figure 10 (blue squares represent clots formed from normal blood; red dots represent clots formed from pathological blood samples). (D) Weighted linear regression with computationally defined 95% CI. The weighting of the measurement error is a correction for heteroscedasticity seen in Figure 5C. This linear plot is described by a mathematical function [y = −3.488 + 0.12x] with a scatter (95% confidence intervals: slope [0.11; 0.13], Y-intercept [−3.87; −3.12], X-intercept [27.9; 31.1]).
Figure 6.
Figure 6.
Application of the contraction ruler to assess the extent of intravital contraction for individual venous thrombi based on their cellular composition. A polyhedral/biconcave RBC ratio (y-axis) determined for each thrombus from a set of scanning electron micrographs is extrapolated to the x-axis to determine the corresponding extent of contraction. The contraction ruler is based on the extensive quantification of the cellular composition of in vitro blood clots obtained in normal and pathological blood samples with various known extents of contraction, which revealed an exponential relation between the ratio of polyhedral to biconcave RBCs and the extent of clot contraction (Figure 5).
Figure 7.
Figure 7.
The comparative extents of intravital contraction of the parts of venous thrombi (head, body, and tail), pulmonary thrombotic emboli, and arterial cerebral thrombi determined using the contraction ruler. Each dot represents an averaged number based on the polyhedral/biconcave RBC ratio from 3 electron micrographs of individual venous thrombi (n = 13) and their parts, pulmonary emboli (n = 6), and 5 electron micrographs of individual cerebral thrombi (n = 24). The results are presented as a median with interquartile range. n.s., not significant. The statistical analysis was performed using the Mann-Whitney U test (for 2 different types of thrombi) and the Kruskal–Wallis test (for head, body, and tail of venous thrombi) with Dunn’s post hoc test for multiple comparisons (P = .004). The result was confirmed with a false discovery rate controlled using a 2-stage linear step-up procedure of Benjamini, Krieger, and Yekutieli (individual P value = .0008 for head and tail of venous thrombi).

Similar articles

Cited by

References

    1. Carr ME Jr. Development of platelet contractile force as a research and clinical measure of platelet function. Cell Biochem Biophys. 2003;38(1):55–78. - PubMed
    1. Tucker KL, Sage T, Gibbins JM. Clot retraction. Methods Mol Biol. 2012;788:101–107. - PMC - PubMed
    1. Kim OV, Litvinov RI, Alber MS, Weisel JW. Quantitative structural mechanobiology of platelet-driven blood clot contraction. Nat Commun. 2017; 8(1):1274. - PMC - PubMed
    1. Leong L, Chernysh IN, Xu Y, et al. . Clot stability as a determinant of effective factor VIII replacement in hemophilia A. Res Pract Thromb Haemost. 2017;1(2):231–241. - PMC - PubMed
    1. Tutwiler V, Peshkova AD, Andrianova IA, Khasanova DR, Weisel JW, Litvinov RI. Contraction of blood clots is impaired in acute ischemic stroke. Arterioscler Thromb Vasc Biol. 2017;37(2):271–279. - PMC - PubMed

Publication types