

Infrared Spectroscopic Study and Mathematical Simulations of Carotid Atherosclerosis
- PMID: 34972714
- PMCID: PMC8765148
- DOI: 10.21873/invivo.12690
Infrared Spectroscopic Study and Mathematical Simulations of Carotid Atherosclerosis
Abstract
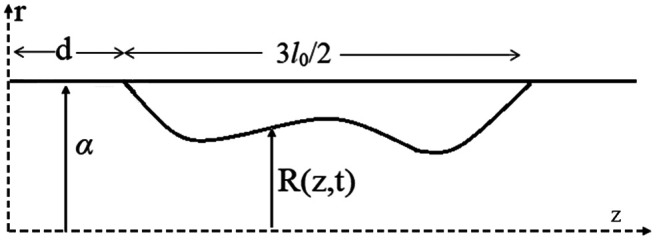
Background/aim: The pathogenesis, treatment and prevention of atherosclerosis continue to be the subject of intensive research and study by the scientific community. Based on Fourier-transform infrared spectra and 3D-Doppler echogram, we attempted to develop a computational simulation model for predicting the association of atherosclerotic risk factors with pathogenic molecular structural changes.
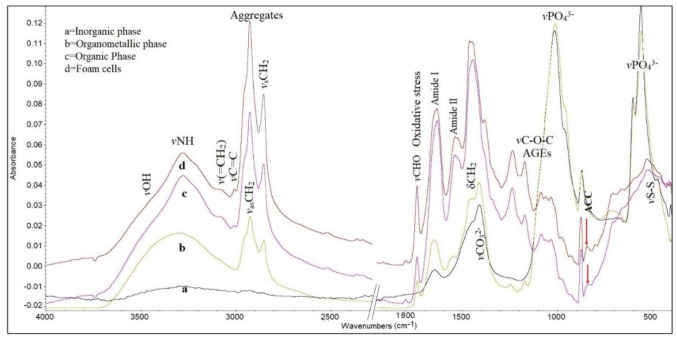
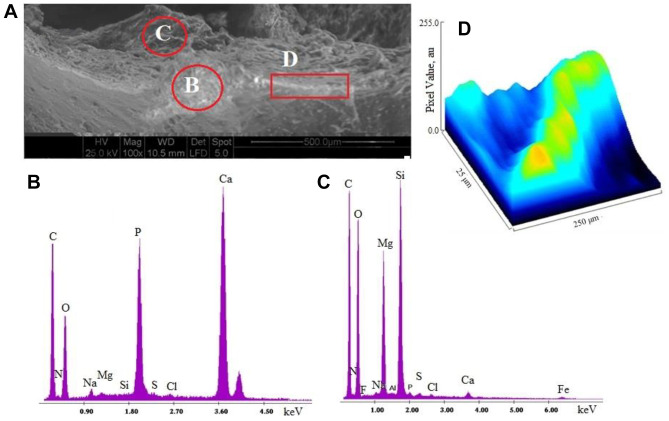
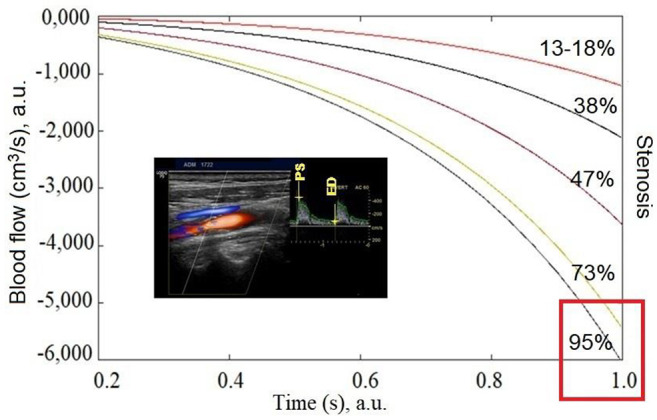
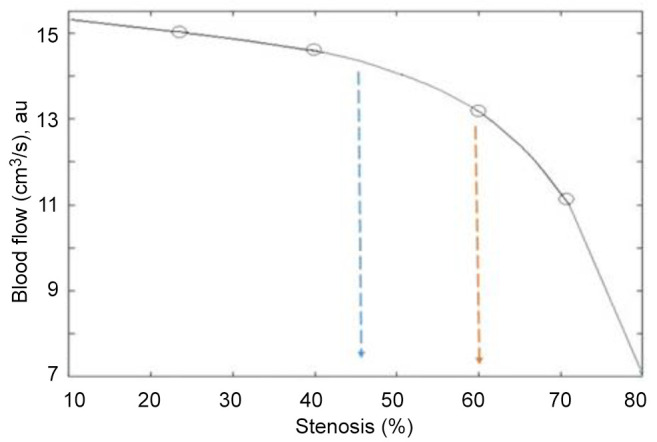
Materials and methods: Atheromatic carotid arteries from 56 patients (60-85 years old) were used as samples. Color 3D-Doppler echogram screening was performed on all patients preoperatively. Each infrared spectrum consisted of 120 co-added spectra at a spectral resolution of 4 cm-1 Results: The infrared spectral analysis reveals 'marker bands', such as the 1,744 cm-1 band assigned to aldehyde formation and to the 'fingerprint' digital spectral region of 1,050-1,169 cm-1, characteristic of the presence of advanced glycation end products (C-O-C). The accumulation of calcium phosphate salts increases the formation rate of stenosis. The critical point of stenosis risk starts at about 45%, while when stenosis is over 60-70%, the risk of ischemic stroke or other major adverse cardiovascular events increases dramatically.
Conclusion: Fourier-transform infrared spectroscopy and mathematical simulation models showed that carotid artery stenosis over 45% reduces the blood flow rate, while stenosis over 65% dramatically increases the hemodynamic disturbance, with a parallel increase the rate of ischemic stroke or other major adverse cardiovascular events.
Keywords: 3D-Doppler echogram; FT-IR spectroscopy; blood flow; carotid atherosclerosis; mathematical simulations.
Copyright © 2022 International Institute of Anticancer Research (Dr. George J. Delinasios), All rights reserved.
Conflict of interest statement
No conflicts.
Figures
References
-
- Ntaios G, Sagris D, Strambo D, Perlepe K, Sirimarco G, Georgiopoulos G, Nannoni S, Korompoki E, Manios E, Makaritsis K, Vemmos K, Michel P. Carotid atherosclerosis and patent foramen ovale in embolic stroke of undetermined source. J Stroke Cerebrovasc Dis. 2021;30(1):105409. doi: 10.1016/j.jstrokecerebrovasdis.2020.105409. - DOI - PubMed
-
- Douna H, Amersfoort J, Schaftenaar FH, Kröner MJ, Kiss MG, Slütter B, Depuydt MAC, Bernabé Kleijn MNA, Wezel A, Smeets HJ, Yagita H, Binder CJ, Bot I, van Puijvelde GHM, Kuiper J, Foks AC. B- and T-lymphocyte attenuator stimulation protects against atherosclerosis by regulating follicular B cells. Cardiovasc Res. 2020;116(2):295–305. doi: 10.1093/cvr/cvz129. - DOI - PubMed
MeSH terms
LinkOut - more resources
Full Text Sources
Medical