. 2022 Jan;7(1):132-144.
doi: 10.1038/s41564-021-01023-6. Epub 2021 Dec 31.

Gut microbiomes from Gambian infants reveal the development of a non-industrialized Prevotella-based trophic network

Affiliations

Gut microbiomes from Gambian infants reveal the development of a non-industrialized Prevotella-based trophic network

Marcus C de Goffau et al. Nat Microbiol. 2022 Jan.

Abstract

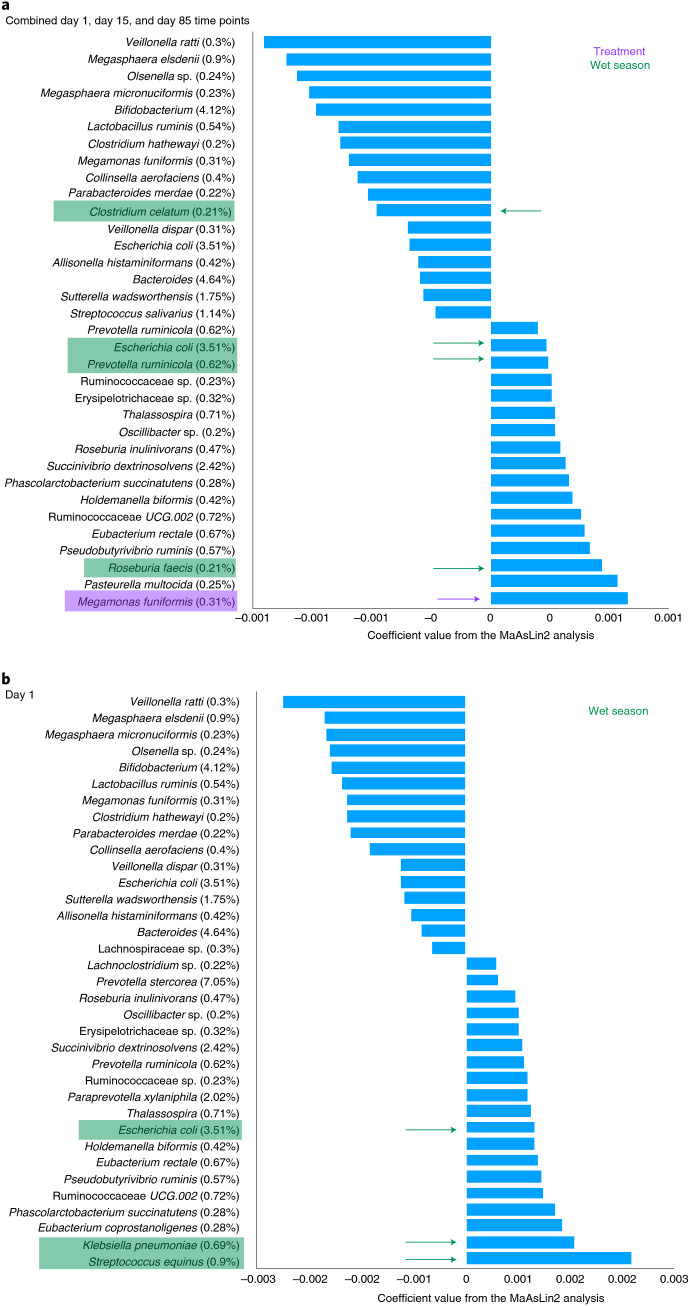
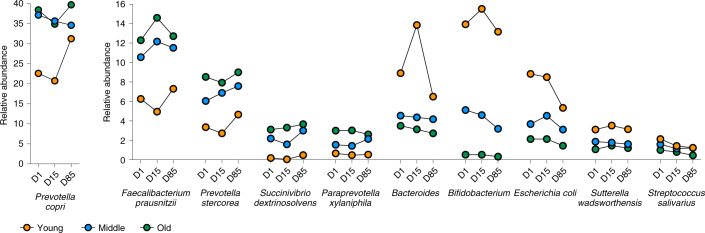
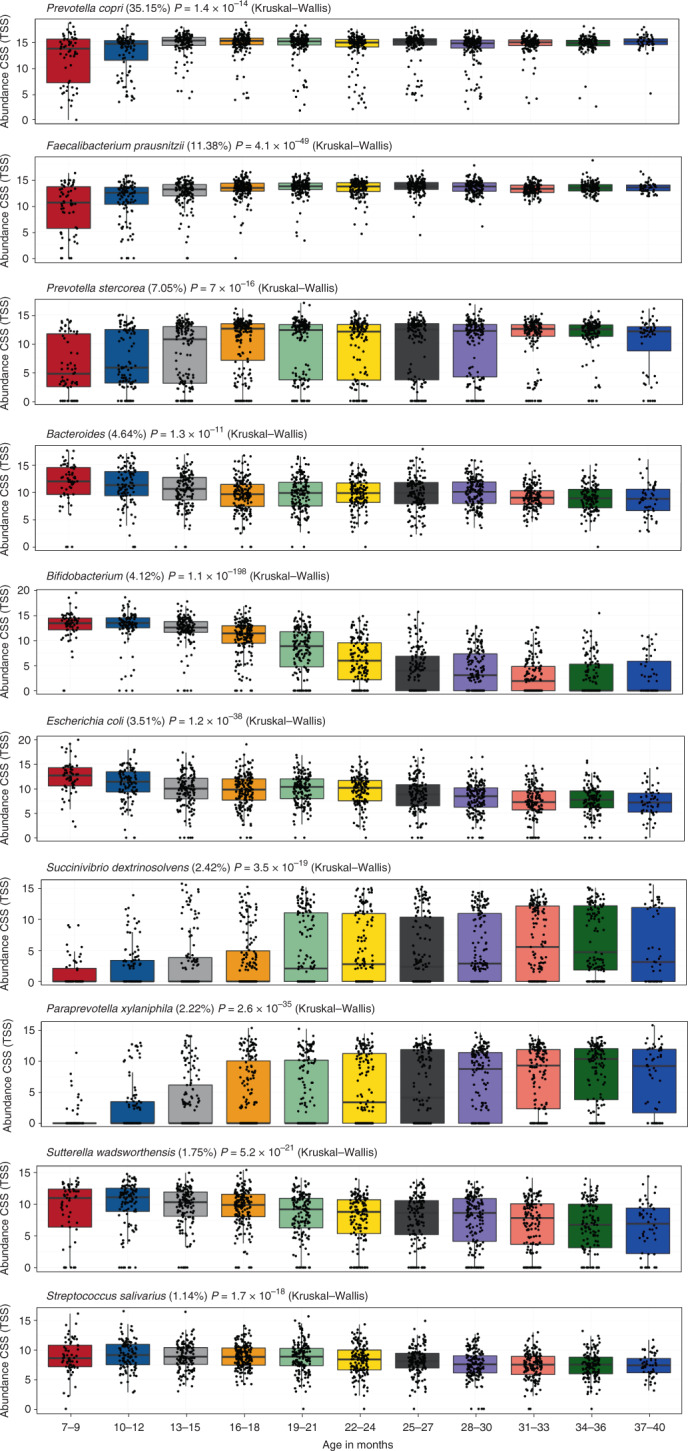
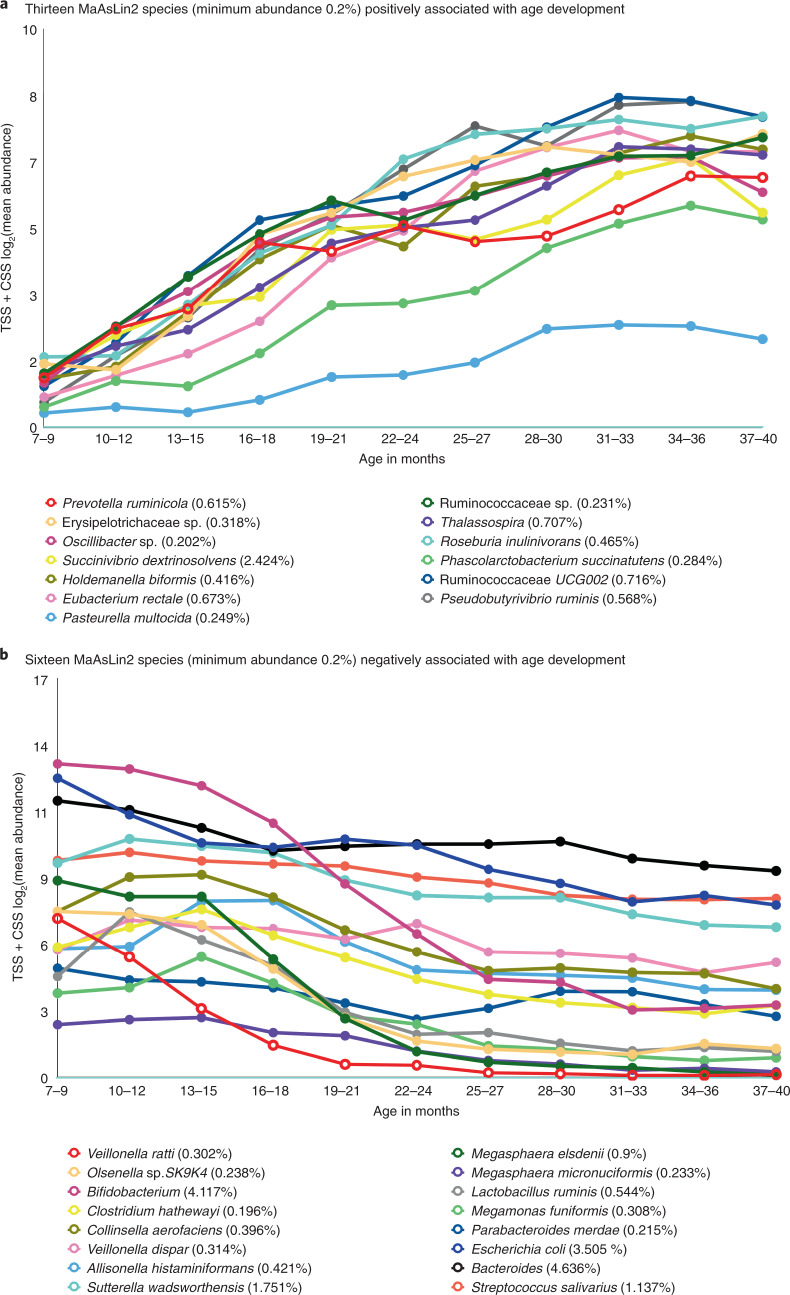
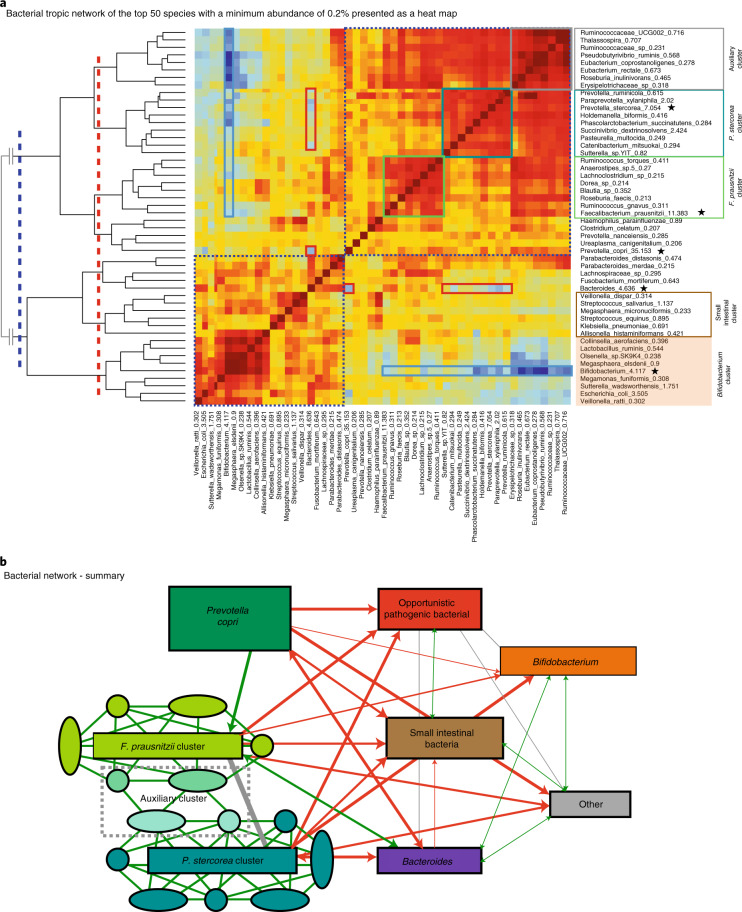
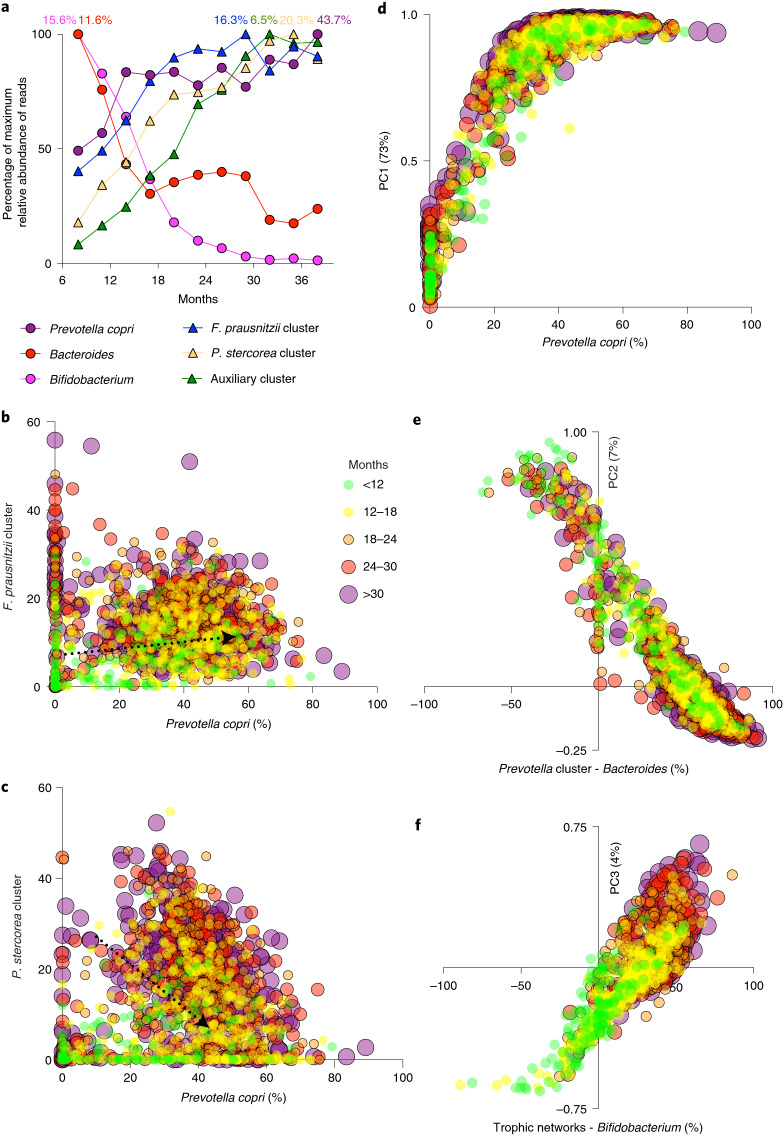
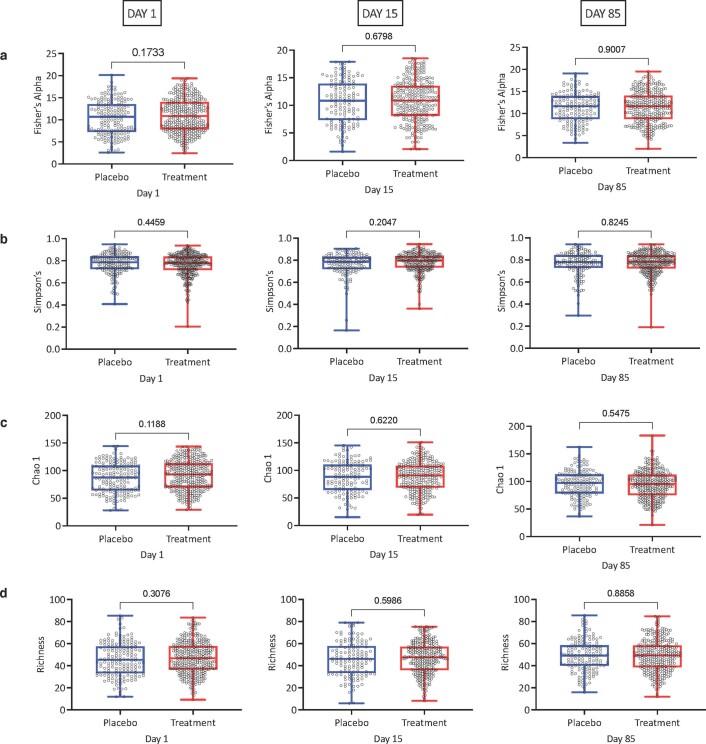
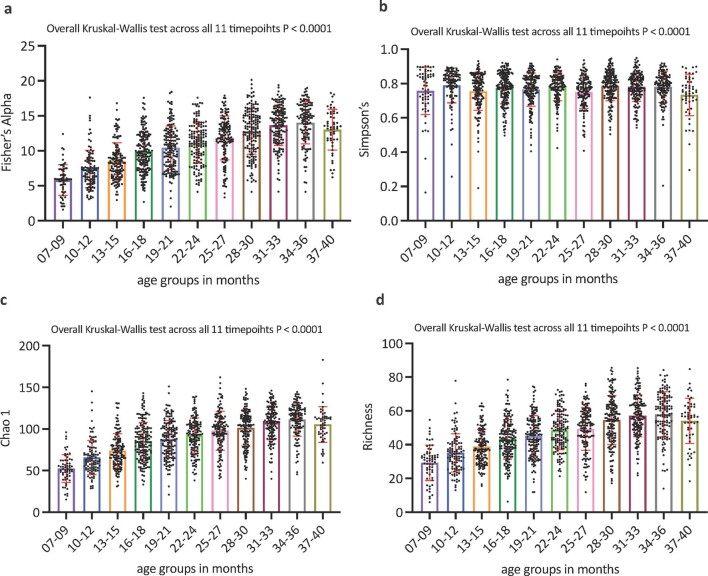
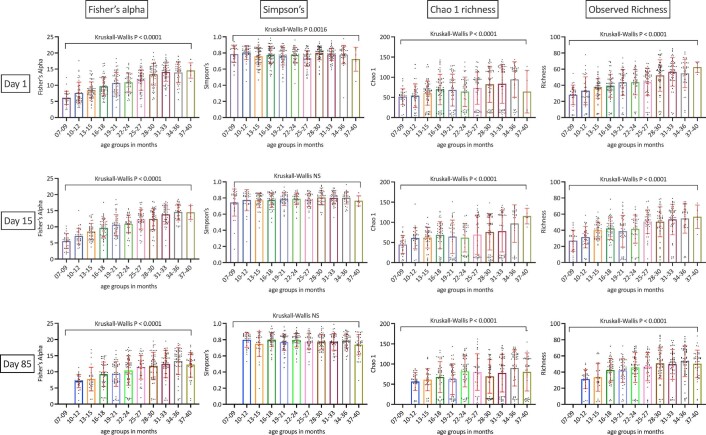
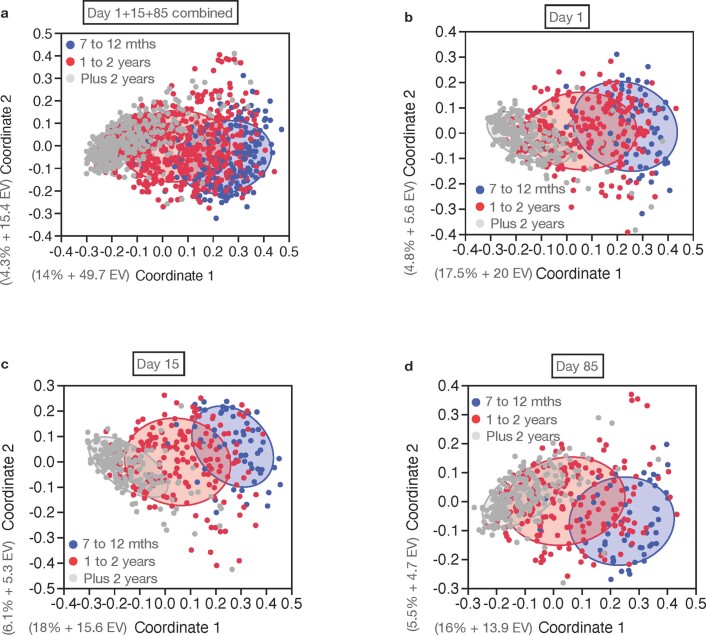
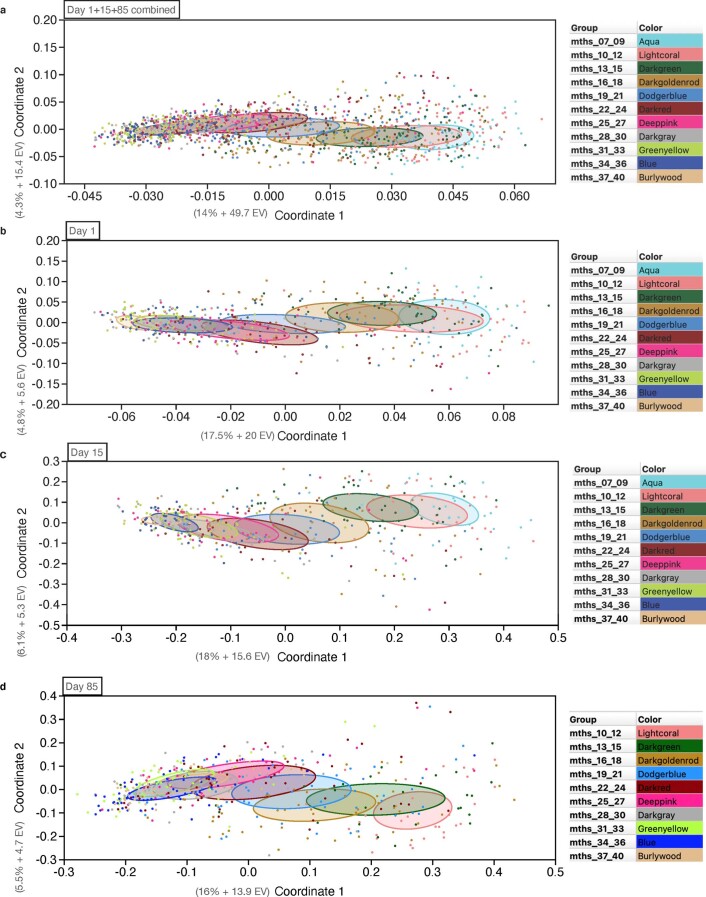
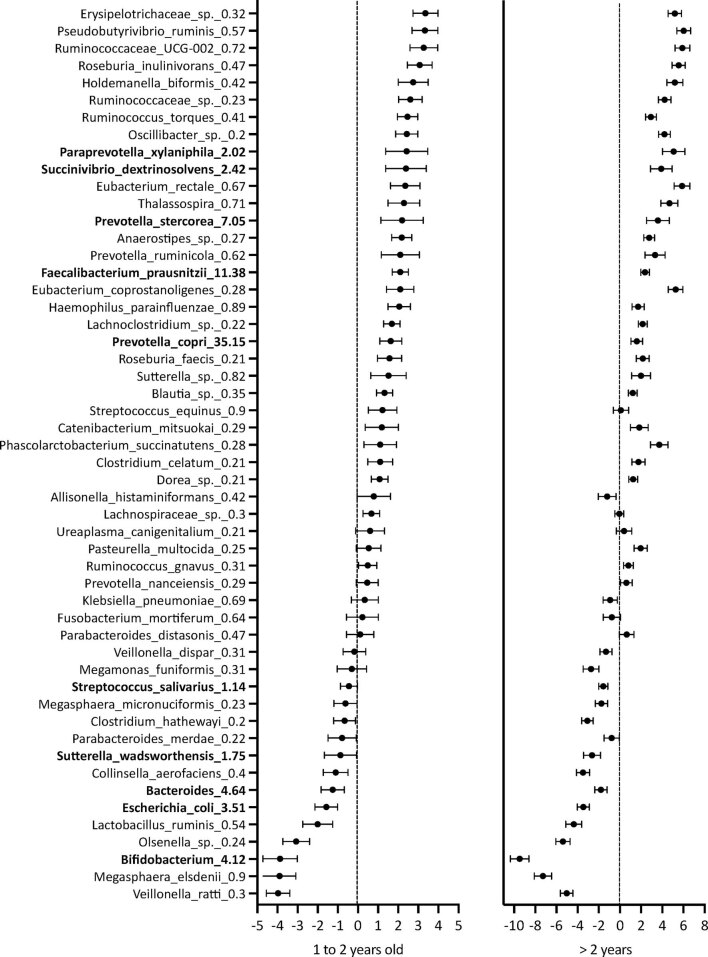
Distinct bacterial trophic networks exist in the gut microbiota of individuals in industrialized and non-industrialized countries. In particular, non-industrialized gut microbiomes tend to be enriched with Prevotella species. To study the development of these Prevotella-rich compositions, we investigated the gut microbiota of children aged between 7 and 37 months living in rural Gambia (616 children, 1,389 stool samples, stratified by 3-month age groups). These infants, who typically eat a high-fibre, low-protein diet, were part of a double-blind, randomized iron intervention trial (NCT02941081) and here we report the secondary outcome. We found that child age was the largest discriminating factor between samples and that anthropometric indices (collection time points, season, geographic collection site, and iron supplementation) did not significantly influence the gut microbiome. Prevotella copri, Faecalibacterium prausnitzii and Prevotella stercorea were, on average, the most abundant species in these 1,389 samples (35%, 11% and 7%, respectively). Distinct bacterial trophic network clusters were identified, centred around either P. stercorea or F. prausnitzii and were found to develop steadily with age, whereas P. copri, independently of other species, rapidly became dominant after weaning. This dataset, set within a critical gut microbial developmental time frame, provides insights into the development of Prevotella-rich gut microbiomes, which are typically understudied and are underrepresented in western populations.


Conflict of interest statement

D.I.A.P. is one of the inventors of the IHAT iron supplementation technology for which she could receive future awards to inventors through the MRC Awards to Inventor scheme. D.I.A.P. has served as a consultant for Vifor Pharma UK, Shield Therapeutics, Entia Ltd, Danone Nutritia, UN Food and Agriculture Organization (FAO) and Nemysis Ltd. D.I.A.P. has since moved to full employment with Vifor Pharma UK, but all work pertaining to this study was conducted independently of Vifor Pharma. Notwithstanding, the authors declare no potential conflicts of interest with respect to the research, authorship and/or publication of this article.

Figures

Fig. 1
Fig. 1. Multivariable statistical analysis to identify taxa associated with age, season and treatment group.
a,b Taxa with a minimum abundance of 0.2% and FDR-corrected P value < 0.5 identified through the statistical MaAsLin2 R package in (a) the combined time point dataset and (b) the day 1 dataset. Taxa associated with treatment and season are highlighted in purple and green, respectively. Coefficient values shown on the x axis are taken from Supplementary Table 2. Values in parentheses next to the taxa name represent the relative abundance of the species.
Fig. 2
Fig. 2. Top ten taxa with a minimum abundance of 1% across the young, middle and old groups.
Top ten taxa with a minimum abundance of 1% identified through mixed-effect linear regression associated with the three age groups stratified by the three sampling time point. Relative abundances (%) are plotted on the y axis and the taxa across the three different sampling time points are plotted on the x axis. D, day.
Fig. 3
Fig. 3. Top ten species with a minimum abundance of 1%, significantly associated in the 11 age groups.
Significantly differentially abundant bacterial taxa on the TSS + CSS log2 data. The box plot shows the minimum, first quartile, median, third quartile and maximum values. The P value from the Kruskal–Wallis test shows the overall significance across all eleven 3-month age groups. In this overall general presentation, all three sampling time points were combined.
Fig. 4
Fig. 4. Bacterial taxa significantly associated with age development in the combined time points dataset.
a,b, Taxa identified through the MaAsLin2 R package analysis that are statistically associated with age (Supplementary Table 2) were plotted in a stacked line chart for the eleven 3-month age group intervals, separated by (a) positive association with age maturation and (b) negative association with age maturation. Only taxa with a minimum abundance of 0.2% were plotted. Absolute abundant bacterial 16S reads transformed using TSS and normalized using CSS + log2 are shown on the y axis.
Fig. 5
Fig. 5. Taxa association and trophic networks with all three time points combined.
a, A network heatmap was generated using the top 50 taxa with a minimum abundance of 0.2% in all samples. The most dominant clusters identified in the bacterial trophic network correlation analysis are highlighted by different coloured boxes and were confirmed by gap statistics. Two different settings in the gap statistical analysis identified two (blue dotted line) and seven clusters (red dotted line), respectively. The P. stercorea network is highlighted in teal, the F. prausnitzii network in light green, the Bifidobacterium network in yellow, an auxiliary group in grey and a small intestinal microbiome network in brown. The red heatmap colour indicates a strong positive correlation and the blue heatmap colour indicates a strong negative correlation. Red boxes denote a negative association between Prevotella species and Bacteroides and blue boxes denote a negative association between Bifidobacterium and other taxa. The main representative taxa for each cluster are marked by a star. b, Bacterial network summary. Spearman’s rho correlation coefficient analysis was used to identify a bacterial trophic network with the strongest self-correlations. The leading taxa in each network is highlighted. A positive correlation is highlighted by green lines, a negative correlation by red lines and an intermediate correlation by grey lines.
Fig. 6
Fig. 6. Maturation process analysed by correlation and principal component analysis.
a, Abundances over time of the most relevant bacterial clusters depicted in Figs. 3 and 5 as important separate species/genera. Each bacterial group is normalized by its highest abundance at any time point. The highest abundance of each group (100% on the y axis) is depicted at the top as a percentage. Bifidobacterium and Bacteroides decrease over time, whereas the other groups increase over time but at different rates. b,c, Scatterplots of P. copri and the F. prausnitzii cluster (b) or the P. stercorea cluster (c). Because of the extremely high abundance of P. copri a numerically induced (weak) negative association is to be expected even between other clusters where no antagonistic interaction occurs, like with the P. stercorea cluster. The F. prausnitzii cluster, however, has a weak positive correlation with P. copri. df, Bacterial clusters and main species represent the main principal components within this dataset. d, PC1 is nearly fully described by the abundance of P. copri, the most abundant species at every point in time in this study. e, PC2 represents the antagonistic interaction between the Prevotella genus and the Bacteroides genus, where Prevotella is represented by the combined abundance of P. copri and the P. stercorea cluster. f, PC3 represents a shift away from a gut dominated by Bifidobacterium, as seen in young infants, towards the development of complex trophic networks as represented here by the combined abundance of the F. prausnitzii cluster, the P. stercorea cluster and the auxiliary cluster. PC3 is most strongly correlated with age. Percentages indicate the per cent variation explained by each principal component in the combined dataset.
Extended Data Fig. 1
Extended Data Fig. 1. Alpha diversity indexes did not differ between placebo and treatment groups at the three individual sampling timepoints.
The Fisher’s alpha diversity index (row a), the Simpson’s diversity index (row b), the Chao1 estimated richness (row c), and the observed richness (row d) did not differ between the placebo and treatment group at the three individual sampling timepoints DAY 1, DAY 15, and DAY 85. Data were tested for normality using the Anderson-Darling and the D’Agostino & Pearson test in Prism 9 for macOS. For Day 1 and Day 15 samples, the Fisher’s Alpha index, the Simpson’s index, and the Chao 1 index data were not normally distributed, whereas the Richness index data were normally distributed. For Day 85 samples the Fisher’s Alpha index and the Simpson’s index data were not normally distributed, whereas the Chao 1 index and the Richness index data were normally distributed. Not normally distributed data were tested with the two-tailed unpaired non-parametric Mann-Whitney test and normally distributed were tested with the two-tailed unpaired parametric t test. Data were considered to be statistically significant with a confidence level of 95%. Data were plotted using the Box and whiskers plot function in Prism 9 for macOS and whiskers showing all point from minimum to maximum values. The box always extends from the 25th to 75th percentiles. The line in the middle of the box is plotted at the median. In the day 1 dataset there were 520 samples, in the day 15 dataset there were 412 samples, in the day 85 dataset there were 457 samples.
Extended Data Fig. 2
Extended Data Fig. 2. Alpha diversity indexes differs between the 11 3-month age groups interval datasets in the combined sampling timepoints data.
The Fisher’s alpha diversity index (a), the Simpson’s diversity index (b), the Chao1 estimated richness (c), and the observed richness (d) did differ significantly across the 11 3-month age groups as analysed by the non-parametric Kruskal-Wallis test. Data were tested for normality using the Anderson-Darling and the D’Agostino & Pearson test in Prism 9 for macOS and were non-normally distributed. Data were considered to be statistically significant with a confidence level of 95%. Data were plotted using the Scatter dot plot function in Prism 9 for macOS with a line drawn at the mean with error bars extending to the standard deviation. In this overall general presentation of the alpha diversity indexes, all 1389 samples across the three sampling timepoints were combined. The same analysis was performed for the three different individual sampling timepoints Day 1, Day 15, and Day 85 which is shown in Extended Data Fig. 3.
Extended Data Fig. 3
Extended Data Fig. 3. Alpha diversity indexes stratified by the three sampling time points (Day 1, Day 15, and Day 85).
The Fisher’s alpha diversity index, the Chao1 estimated richness, and the observed richness were significantly different across the 11 3-month age groups as analysed by the non-parametric Kruskal-Wallis test. Data were tested for normality using the Anderson-Darling and the D’Agostino & Pearson test in Prism 9 for macOS and were non-normally distributed. The Simpson’s index was only significantly different in the day 1 dataset. Data were considered to be statistically significant with a confidence level of 95%. Data were plotted using the Scatter dot plot function in Prism 9 for macOS with a line drawn at the mean with error bars extending to the standard deviation. In the day 1 dataset there were 520 samples, in the day 15 dataset there were 412 samples, in the day 85 dataset there were 457 samples.
Extended Data Fig. 4
Extended Data Fig. 4. PCoA analysis for the three-age group comparison shows distinctive microbiome clusters.
PCoA based on Bray-Curtis distance matrix performed on three age group categories showed that the structure of bacterial communities differs between the young (7 to 12 mths), the middle (1 to 2 years), and the old (plus 2 years) age groups for the combined time-point dataset (a), for the day 1 samples (b), for the day 15 samples (c), and for the day 85 samples (d). The explained variance and the Eigenvalue (EV) for the coordinates 1 and 2 are shown in brackets at the left hand size of the Coordinate axis label.
Extended Data Fig. 5
Extended Data Fig. 5. PCoA analysis for the 11-age group comparison shows distinctive bacterial clusters.
PCoA based on Bray-Curtis distance matrix performed on 11 3-months age group categories showed that the structure of bacterial communities differs between the age groups for the combined time point dataset (a), for the day 1 samples (b), for the day 15 samples (c), and for the day 85 samples (d). The explained variance and the Eigenvalue (EV) for the coordinates 1 and 2 are shown in brackets at the left hand size of the Coordinate axis label. The colour code at the right hand side of each PCoA plot illustrates the different 3-months age groups.
Extended Data Fig. 6
Extended Data Fig. 6. Mixed-effect linear regression to show bacterial changes across the three different age groups.
Mixed-effect linear regression was conducted to examining the effect of the three different age groups. The mean changes (95% CI) in TSS + CSSlog2 transformed + normalized data of one to two years old samples and >2-year-old samples compared to seven months to 12 months samples are shown. The analysis was adjusted for season, site (fixed effect) and child ID (multiple sampling = random effect). The taxa are sorted from largest negative mean change to largest positive mean change on the x axis. The top ten taxa with a minimum abundance of 1% high highlighted in bold. Mixed-effects linear regression analysis was restricted to the top 50 taxa with a minimum abundance of 0.2%. Importantly, no adjustments for multiple comparisons were made to the 95% confidence intervals. Subject identifier (child ID) was included as a random-effect to account for repeated measures. In this analysis, all 1389 samples across the three sampling timepoints were combined. The black points shows the estimated change and the error bars show the 95% confidence interval.
Extended Data Fig. 7
Extended Data Fig. 7. Using Gap Statistic to identify the best number of clusters for bacterial trophic network analysis.
Gap statistic using the R function “clusGap” from the R package “cluster” version 2.1.2 was used to calculate a goodness of clustering measure, the “gap” statistic. The “k.max” parameter was set to 10, the bootstrap “B” parameter was set to 100, and the analysis was done with two different “FUNcluster” method including cluster:fanny and kmeans. The analysis was restricted to the top 50 TSS transformed taxa with a minimum abundance of 0.2%. a. The analysis using the “FUNcluster” method “kmeans”. b. the analysis using the “cluster::fanny”. The numbers of statistical identified clusters are characterized by a decrease in Gap value on the Y axis. Once there is not further decrease in the Gap value (line started to flattened out) on the y axis, indicates the optimal number of clusters. For this analysis all 1389 samples across the three sampling timepoints were combined. The error bars indicate one standard error.

Comment in

  • Microbiome assembly in The Gambia.
    Carter MM, Olm MR, Sonnenburg ED. Carter MM, et al. Nat Microbiol. 2022 Jan;7(1):18-19. doi: 10.1038/s41564-021-01036-1. Nat Microbiol. 2022. PMID: 34972823 No abstract available.

References

    1. Yatsunenko T, et al. Human gut microbiome viewed across age and geography. Nature. 2012;486:222–227. - PMC - PubMed
    1. De Filippo C, et al. Impact of diet in shaping gut microbiota revealed by a comparative study in children from Europe and rural Africa. Proc. Natl Acad. Sci. USA. 2010;107:14691–14696. - PMC - PubMed
    1. Kortekangas E, et al. Environmental exposures and child and maternal gut microbiota in rural Malawi. Paediatr. Perinat. Epidemiol. 2020;34:161–170. - PMC - PubMed
    1. Ayeni FA, et al. Infant and adult gut microbiome and metabolome in rural Bassa and urban settlers from Nigeria. Cell Rep. 2018;23:3056–3067. - PubMed
    1. Ursell LK, Metcalf JL, Parfrey LW, Knight R. Defining the human microbiome. Nutr. Rev. 2012;70(Suppl 1):S38–S44. - PMC - PubMed

Publication types

Associated data