. 2022 Feb:215:108916.
doi: 10.1016/j.exer.2021.108916. Epub 2021 Dec 29.

Lamina cribrosa vessel and collagen beam networks are distinct

Affiliations

Lamina cribrosa vessel and collagen beam networks are distinct

Susannah Waxman et al. Exp Eye Res. 2022 Feb.

Abstract

Our goal was to analyze the spatial interrelation between vascular and collagen networks in the lamina cribrosa (LC). Specifically, we quantified the percentages of collagen beams with/without vessels and of vessels inside/outside of collagen beams. To do this, the vasculature of six normal monkey eyes was labeled by perfusion post-mortem. After enucleation, coronal cryosections through the LC were imaged using fluorescence and polarized light microscopy to visualize the blood vessels and collagen beams, respectively. The images were registered to form 3D volumes. Beams and vessels were segmented, and their spatial interrelationship was quantified in 3D. We found that 22% of the beams contained a vessel (range 14%-32%), and 21% of vessels were outside beams (13%-36%). Stated differently, 78% of beams did not contain a vessel (68%-86%), and 79% of vessels were inside a beam (64%-87%). Individual monkeys differed significantly in the fraction of vessels outside beams (p < 0.01 by linear mixed effect analysis), but not in the fraction of beams with vessels (p > 0.05). There were no significant differences between contralateral eyes in the percent of beams with vessels and of vessels outside beams (p > 0.05). Our results show that the vascular and collagenous networks of the LC in monkey are clearly distinct, and the historical notions that each LC beam contains a vessel and all vessels are within beams are inaccurate. We postulate that vessels outside beams may be relatively more vulnerable to mechanical compression by elevated IOP than are vessels shielded inside of beams.

Keywords: Collagen; Lamina cribrosa; Morphology; Optic nerve head; Vasculature.


Figures

Figure 1:
Figure 1:
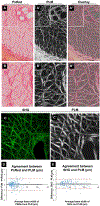
Polarized light microscopy (PLM) detection of LC collagen beams is in line with other well-established methods of collagen visualization. A) A 16μm-thick cryosection through the monkey LC was labeled with picrosirius red (PsRed), a collagen stain, and imaged via brightfield microscopy. Collagen is shown in darker pink/red. A’) The same section imaged via PLM reveals the same pattern of beams visualized via PsRed staining. This is evident in an overlay of these images in A”. B-B” show close up views of the region in A-A” within the white box. C) A second harmonic generation (SHG) image of the monkey LC to visualize collagen. C’) The same region of the section in C imaged via PLM as in A’ and B’. The same pattern of beams is visualized among SHG and PLM. The bottom row panels (D and E) show Bland-Altman plots to evaluate the agreement in LC beam widths obtained between PLM and PsRed (left) and between PLM and SHG (right). Overlaid on the scatterpoints on each plot are lines representing the following: best-fit linear function (dotted blue line), mean difference (black line), lower and upper 95% confidence interval limits (dashed red lines). For PLM vs PsRed, the mean difference was 0.12 μm and the SD of the differences was 1.25 μm. For PLM vs SHG, the mean difference was 0.36 μm and the SD of the differences was 0.97 μm. Overall, the plots show excellent agreement between the techniques. Every beam discernible with one technique was also discernible in the other.
Figure 2:
Figure 2:
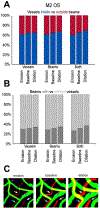
Results from the analysis of sensitivity to LC beam width in the OS eye of M2. The fractions of vessels inside vs outside beams (A) and of beams with vs without vessels (B) were calculated before and after changes (erosion of 3μm or dilation of 6μm) of beams, vessels or both. A visual representation of how erosion/dilation of beams (green) and vessels (red) can affect spatial relationships is shown in the diagram in C. Erosion/dilation of vessels and beams does not alter whether most beams are with/without vessels or whether most beams are inside/outside beams, as shown quantitatively in A and B. White arrows: vessels outside beams that stay outside beams despite erosion/dilation, purple arrows: vessels inside beams that remain inside beams despite erosion/dilation, cyan arrows: vessel outside beam that may appear as inside beam or outside beam depending upon erosion/dilation.
Figure 3.
Figure 3.
Collagen beams and vessels have distinct topologies across the LC. Example images of collagen (A) and vessels (B) in a single 16 μm-thick coronal section through the ONH at the level of the LC. In A, the color of the collagen is derived from its local orientation, and local intensity of the image is derived from the collagen density. Images of collagen were acquired using PLM (A, C), and images of vessels were acquired using FM (B, D.) C and D show maximum intensity projections of stacks of 19 sections (in C) and 8 sections (in D). Fewer sections were projected in D to avoid overcrowding. In C and D, collagen and vessels are color-coded by depth (see scale at bottom right for each image). Our imaging and segmentation focused on the vessels within the canal. This could cause vessels outside to appear discontinuous or “broken”. Hence, in D, vessels outside the scleral canal have been digitally masked. Contrast was adjusted to best display imaged features.
Figure 4.
Figure 4.
Aligned, registered, and merged FM and PLM images. Red (vessels) and green (collagen) merged image of a single 16 μm -thick coronal section shown along the XY plane. Here, the central retinal artery is well highlighted in the center of the image. Virtual sections along the XZ (bottom) and YZ (right) planes are depicted by the yellow demarcations. Dashed boxes indicate insets which correspond with magnified panels (right) showing detail. In this representative sample, collagen and vasculature were visible throughout. Note that the LC demonstrates a cupped shape, discernible in the coronal section, with beams present in the center and not in the upper left of this example, and in the virtual cross-sections.
Figure 5.
Figure 5.
Red (vessels) and green (collagen) merged images of a single 16μm-thick section. Left) Example of a vessel running along the outside of the collagen beam. Middle) Example of a vessel crossing a pore without any collagen support. Right) Example of a vessel that crosses perpendicular to a collagen beam.
Figure 6.
Figure 6.
Red (vessels) and green (collagen) merged image of 2 sections (~32 μm, left). The enlarged region of interest (right) shows 4 different interactions between collagen beams and vessels. Purple arrows: beams without any vessels. Grey arrow: vessel crossing a pore without any beam support. Blue arrow: vessel running adjacent to a beam and even crossing perpendicular to the next beam. Orange arrows: “traditional” vessel within the center of a collagen beam. A) View of the LC region in these sections, B) detail of white box in A, C) detail of yellow box in A. Dye brightness varied. Whilst it may appear as if the yellow box region in panel A has fewer vessels, adjusting the vessel red channel, panel C, it is readily discernible that this is not the case. No significant portions of dye-free LC were observed, indicating complete or near-complete vascular perfusion.
Figure 7.
Figure 7.
Vessels (DiI in red) and collagen (green) in a monkey ONH. Images are maximum intensity projections of an approximately 256μm-thick region containing the LC. Two areas are highlighted in A-C (solid and dashed boxes) to provide more detail. D-F show close-ups of the central LC within the solid white boxes in A-C. G-H show close-ups of peripheral LC and sclera within the dashed boxes of A-C. Some noteworthy features: 1 & 4) vessels without beams; 2) vessel crossing LC pore; 3) LC pore with no vessels; 5) vessel circling the scleral canal adjacent to the LC; 6) collagen beam without a vessel; 7) vessel feeding into the LC; and 8) vessel circling the canal further into the sclera.
Figure 8.
Figure 8.
Visualization of the 3D vessel and beam networks. Vessels and beams were segmented in FM and PLM images of every coronal section of a stack that included the LC region. The vessels and beams were reconstructed in 3D over the whole region. The beam segmentations were then used to identify the collagen-rich LC region. Based on the LC region, we then separated the vessels into four groups, shown in this figure using different colors: LC vessels were the vessels within the LC region (green), feeder vessels were peripheral to the LC, connecting to the larger arterioles surrounding the canal (red), and prelaminar and retrolaminar vessels were those within the scleral canal, anterior or posterior to the LC (light blue). The LC vessels were then further subdivided for analysis into those inside or outside LC beams (see Figures 9, 11, and 12). The panels in this figure show visualizations of the 3D vessel and beam networks. A-D show views of all the vessels reconstructed. A: coronal view from the front B: coronal view from the back, C: isometric view slightly posterior where the central LC and feeder vessels are clearly discernible. D: longitudinal view from the temporal side. The feeder vessels are discernible but the density of vessels obstructs seeing the LC clearly. To improve the visualization of the LC curved profile, longitudinal slabs were “cut” of both vessels and beams. E-F show a slab cut in the superior-inferior direction from the temporal side. G-H show a slab cut in the nasal-temporal direction seen from the inferior side. I-J show the nasal-temporal slab in isometric view. E, G, and I show only the vessels within the slabs. F, H, and J show the LC beams. The curved shape of the LC is easily discernible in the green LC vessels and white LC beams, surrounded by prelaminar and retrolaminar vessels and a few segments of feeder vessels. K is similar to J, but only one “cut” is shown, leaving the rest of the superior canal region to better visualize the prelaminar and feeder vessels. Note that the slabs are flat cuts of what are complex 3D architectures and therefore some beams and vessels may appear discontinuous when they are, in fact, continuous. To simplify visualization and allow focusing on the characteristics of the vessel network, all vessels are shown with the same diameter, despite the diameters varying. Also, the vessel location and coloring are set according to the location of vessel centroid nodes relative to triangles forming the beam surfaces. As such, they are approximate and some segment ends may extend with a given beyond the region they indicate. The analysis of LC beam and vessel inter-relationship in this work was based on the data as segmented, as described in the manuscript, and is much more precise than the visualization.
Figure 9.
Figure 9.
Full views from the front of the 3D reconstructed LC vessels and beams from monkey 2 OD. A) LC vessel segments colored according to their location relative to the beams: blue if inside a beam and red if outside. B) The LC beams are shown semi-transparent, with the LC vessels in red/blue as in Panel A. We were able to reconstruct the collagenous LC beams which vascular corrosion cast techniques destroy during processing. As in Figure 8, to simplify focusing on the network, all vessels are shown with the same diameter. Only vessels within the LC region are shown. The extreme complexity of the beam and vessel networks is readily apparent, with no clearly discernible pattern for either or for their inter-relationship. As for Figure 8, the segment coloring is approximate, with a few short blue segments that may appear to briefly step outside beams, and red segments within beams.
Figure 10:
Figure 10:
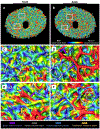
Visibility of pores through the LC depends upon LC orientation. The LC beam surface, color-coded by depth (red is most anterior, blue most posterior). A shows a full view of the LC. B and C are close-ups of the same location differing only on the perspective or direction of view. The colors are useful to discern how deep into the LC one can see. The view in B shows no white background, indicating that from this perspective there are no straight paths through the LC. Even a small rotation, as shown in C, reveals several points with straight paths through the LC. This illustrates the complexity of the LC and that not seeing all the way through does not mean that there are no pores. Note that because the pores are not straight, it is possible that there are no perspectives in which there is a direct path through the LC. The axon bundles can follow tortuous paths
Figure 11.
Figure 11.
Illustration and quantification of LC vessels inside vs. outside beams. Full views of the full LC of monkey 2, OD are shown from the front in A, B and C, and from the back in D, E and F. A magnification of the rectangle region marked in A, B and C from the front is shown in A’, B’ and C’. Similarly, the rectangle in D, E and F is shown magnified in D’, E’ and F’, from the back of the LC. The first four columns show LC vessels colored according to their location, red when outside beams and blue when inside a beam. Panels in a given column show the same region, varying only on how the beams are shown. Top row (A, A’, D and D’) shows LC beams as solid. This emphasizes LC vessels outside beams (in red). We have indicated a few vessels outside beams (grey arrows) or vessels adjacent to a beam, still outside (blue arrows). As elsewhere, the coloring is approximate and the endpoints of some vessels that are within beams are discernible. The middle row (B, B’, E and E’) show beams semi-transparent. This allows discerning vessels within the beams (blue). We have indicated a few vessels within beams (yellow arrows) and a few beams without vessels (purple arrows). The bottom row (C, C’, F and F’) do not show beams. G. The inter-relationship between LC vessels and beams was quantified, as described in the text. Results for 6 monkey LCs are shown as percentages. The bars in red/blue show the percentage of vessels inside vs. outside beams, whereas the grey bars show the percentage of beams with vs. without vessels. M1: monkey 1, M2: monkey 2, M3: monkey 3. Error bars are the standard deviation over the sections.
Figure 12.
Figure 12.
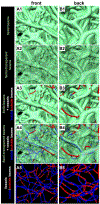
Magnified views of LC 3D reconstructions to illustrate the complex diversity of vessel-beam interrelationship. Two LC locations are shown, one seen from the front (left column, As) and another seen from the back (right column, Bs). Rows show the same location, varying in how the vessels and beams are shown, similar to Fig. 11. A1 & B1 show solid LC beams in teal. The back region exhibits slightly wider beams, but overall they are similar. A2 & B2 show the LC beams semi-transparent to enable visualizing the complexity of the structure in depth. A3 & B3 show solid LC beams and LC vessels. LC vessels outside beams are red, and inside beams are blue. A4 & B4 show semi-transparent beams with vessels inside/outside beams shown in blue/red, respectively. Vessels along beams are clearly discernible in both regions. A5 & B5 show only the LC vessel segments, colored as above. No clear pattern of vessels inside/outside beams emerges.
Figure 13.
Figure 13.
3D reconstruction of LC beams from monkey 2 OD, pseudocolored to indicate proximity to a vessel inside a beam. Reconstructions are shown from the front (A) and from the back (B). Details from the top and bottom boxes indicated in A and B are shown in the second and third rows, respectively. The intent of these images is to help readers grasp the inter-relationship between LC vessels and beams. Where a beam has a vessel within, the beam will be blue. Where a beam does not have a vessel within, it will be red. We have added a few arrows to note examples of beams without vessels (purple arrows), vessels outside beams (gray), vessels adjacent to beams (blue), and “traditional” vessels in beams (orange). These heatmaps are a tool for visualization and do not directly reflect our methods for quantitative analysis.

References

    1. Feit RH, Tomsak RL, Ellenberger C. Structural Factors in the Pathogenesis of Ischemic Optic Neuropathy. American Journal of Ophthalmology. 1984;98(1):105–108. doi:10.1016/0002-9394(84)90196-x - DOI - PubMed
    1. Beck RW, Savino PJ, Repka MX, Schatz NJ, Sergott RC. Optic disc structure in anterior ischemic optic neuropathy. Ophthalmology. 1984;91(11):1334–1337. - PubMed
    1. Sommer A Glaucoma risk factors observed in the Baltimore Eye Survey. Curr Opin Ophthalmol. 1996;7(2):93–98. - PubMed
    1. Rizzo JF 3rd. Unraveling the Enigma of Nonarteritic Anterior Ischemic Optic Neuropathy. J Neuroophthalmol. 2019;39(4):529–544. - PubMed
    1. Hayreh SS. Inter-individual variation in blood supply of the optic nerve head. Doc Ophthalmol. 1985;59(3):217–246. - PubMed

Publication types